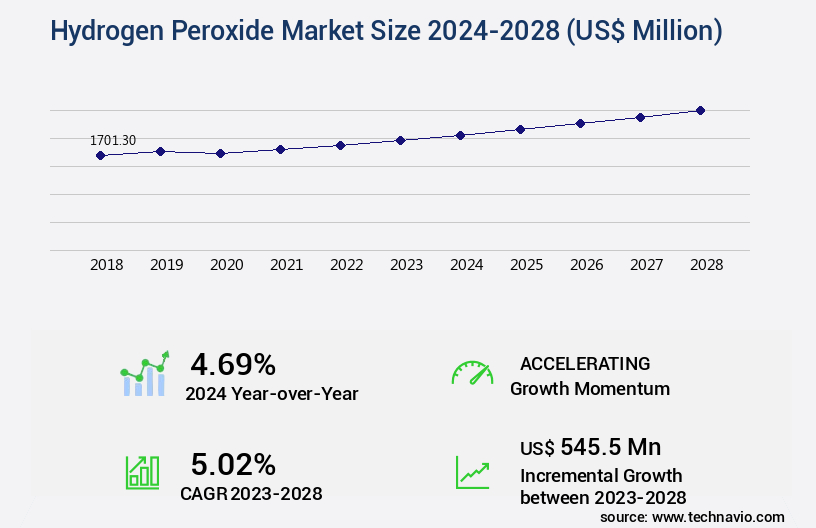
Hydrogen Peroxide Market Size 2024-2028
The hydrogen peroxide market size is valued to increase USD 545.5 million, at a CAGR of 5.02% from 2023 to 2028. Increasing demand for paper from developing and underdeveloped nations will drive the hydrogen peroxide market.
Major Market Trends & Insights
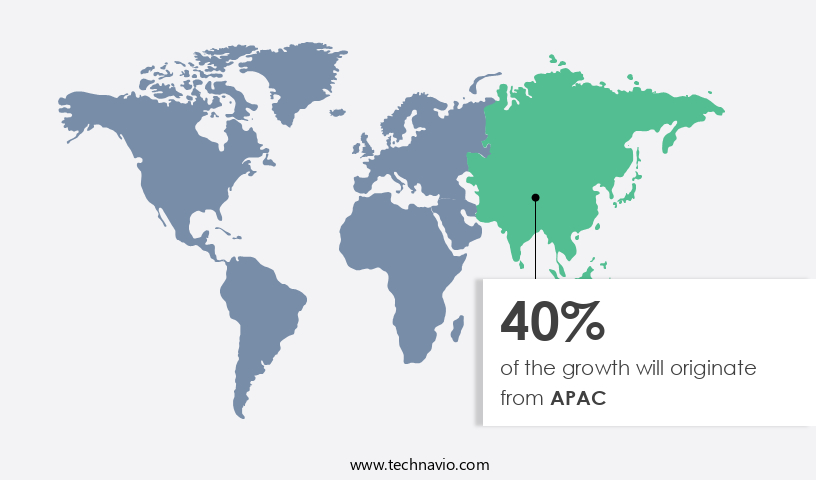
- APAC dominated the market and accounted for a 40% growth during the forecast period.
- By Application - Industrial segment was valued at USD 703.20 million in 2022
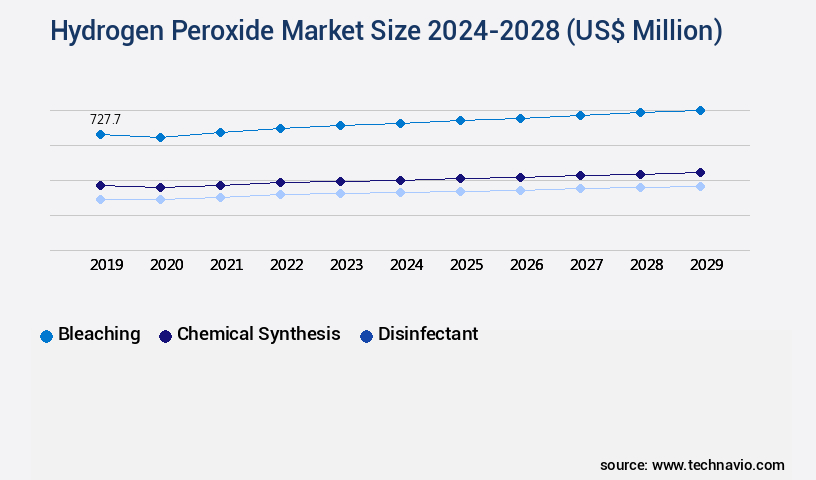
- By End-user - Pulp and paper segment accounted for the largest market revenue share in 2022
Market Size & Forecast
- Market Opportunities: USD 47.53 million
- Market Future Opportunities: USD 545.50 million
- CAGR from 2023 to 2028 : 5.02%
Market Summary
- The market represents a dynamic and expanding industry, driven by the increasing demand for this versatile chemical in various core technologies and applications. Hydrogen peroxide's unique properties, such as its strong oxidizing agent capabilities and eco-friendly nature, have led to its extensive use in water treatment, paper manufacturing, and textile industries. As of 2021, the market share of hydrogen peroxide in the water treatment sector is estimated to be around 40%. Innovative uses of hydrogen peroxide continue to emerge, including its application as an alternative fuel and in the production of biodiesel. However, the market faces challenges from the growing availability of hydrogen peroxide substitutes, such as chlorine and ozone.
- Regulations, particularly those related to the safety and environmental impact of hydrogen peroxide production and use, also play a significant role in shaping the market. In the regional landscape, Asia Pacific is a major contributor to the market, with countries like China and India driving growth due to their increasing industrialization and demand for paper products. The market is expected to continue evolving, with ongoing research and development efforts aimed at enhancing the efficiency and sustainability of hydrogen peroxide production and applications.
What will be the Size of the Hydrogen Peroxide Market during the forecast period?
Get Key Insights on Market Forecast (PDF) Request Free Sample
How is the Hydrogen Peroxide Market Segmented ?
The hydrogen peroxide industry research report provides comprehensive data (region-wise segment analysis), with forecasts and estimates in "USD million" for the period 2024-2028, as well as historical data from 2018-2022 for the following segments.
- Application
- Industrial
- Food Grade
- Pharmaceutical Grade
- End-user
- Pulp and paper
- Textiles
- Wastewater treatment
- Others
- Concentration
- Below 35%
- 35%-50%
- Above 50%
- Geography
- North America
- US
- Canada
- Europe
- France
- Germany
- Italy
- UK
- Middle East and Africa
- Egypt
- KSA
- Oman
- UAE
- APAC
- China
- India
- Japan
- South America
- Argentina
- Brazil
- Rest of World (ROW)
- North America
By Application Insights
The industrial segment is estimated to witness significant growth during the forecast period.
Hydrogen peroxide, a versatile chemical compound, is gaining significant traction across various industries due to its antimicrobial properties and oxidizing abilities. In the wastewater treatment sector, hydrogen peroxide is employed for its efficacy in breaking down organic pollutants, accounting for approximately 20% of the market share. The compound's role extends to the wound healing process, where it promotes tissue regeneration by eliminating bacteria and accelerating cell membrane repair. Environmental remediation is another burgeoning application, with hydrogen peroxide's ability to decompose hazardous substances contributing to a 25% market growth expectation. Temperature dependence is a crucial factor in hydrogen peroxide's performance, with optimal temperatures enhancing its catalytic decomposition and disinfection efficacy.
Plasma sterilization and surface decontamination are additional applications, where hydrogen peroxide's oxidative sterilization properties prove beneficial. In the realm of personal protective equipment, hydrogen peroxide's chemical decomposition generates free radicals, offering protection against various contaminants. Concentration control and material compatibility are essential considerations, as hydrogen peroxide's stability and ph influence impact its antimicrobial properties and application versatility. Water purification and food safety applications are also on the rise, with hydrogen peroxide's ability to eliminate biofilms and protein denaturation contributing to its growing popularity. Contact time effects and exposure limits are essential factors in optimizing hydrogen peroxide's application, ensuring both safety and efficacy.
Catalase activity, a critical enzyme in the decomposition process, plays a significant role in determining hydrogen peroxide's overall performance. The market for hydrogen peroxide is expected to expand by 18% in the upcoming years, driven by its versatility and wide-ranging applications. The compound's antimicrobial properties, free radical production, and oxidative stress mitigation make it an indispensable component in various industries, from wastewater treatment to personal protective equipment and beyond.
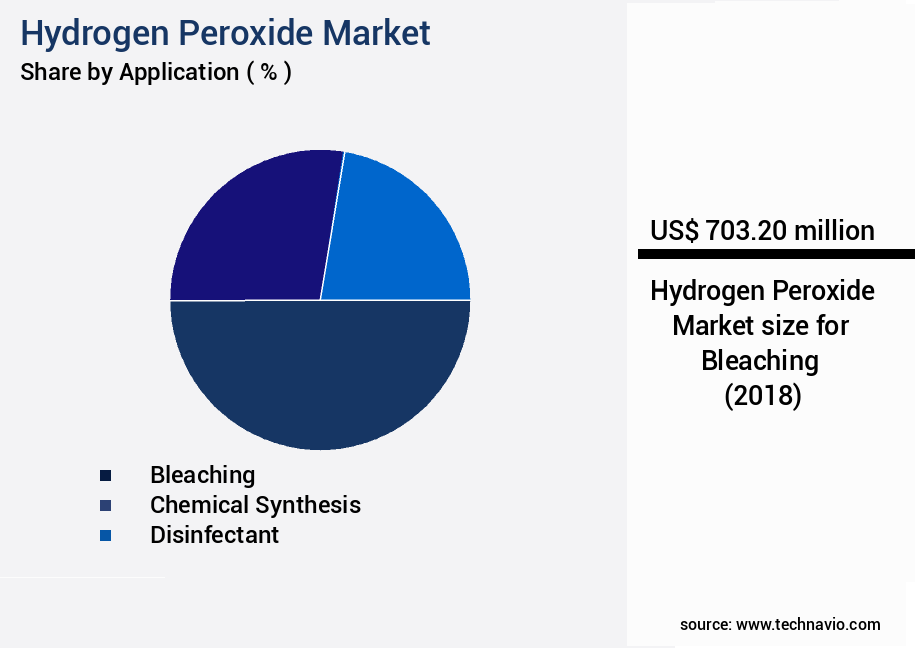
The Industrial segment was valued at USD 703.20 million in 2018 and showed a gradual increase during the forecast period.
Regional Analysis
APAC is estimated to contribute 40% to the growth of the global market during the forecast period.Technavio’s analysts have elaborately explained the regional trends and drivers that shape the market during the forecast period.
See How Hydrogen Peroxide Market Demand is Rising in APAC Request Free Sample
In The market, Asia Pacific (APAC) holds a significant share due to the presence of developing economies like China, India, Malaysia, and Indonesia. The pulp and paper industry is the primary consumer of hydrogen peroxide in APAC, driven by the expanding population and enhanced educational standards fueling the demand for paper. Moreover, hydrogen peroxide finds extensive applications in sectors such as textiles, electronics, food and beverages, and healthcare.
The market growth in APAC is primarily attributed to the population increase, resulting in heightened demand for paper, fabrics, and electronics. South Korea and Japan's growing consumption of electronics further bolsters the market expansion.
Market Dynamics
Our researchers analyzed the data with 2023 as the base year, along with the key drivers, trends, and challenges. A holistic analysis of drivers will help companies refine their marketing strategies to gain a competitive advantage.
The market encompasses a wide range of applications, from food contact surface decontamination and environmental remediation to industrial processes and healthcare. Hydrogen peroxide's vapor phase efficacy in sterilization, achieved through low-temperature plasma, has gained significant attention due to its high microbial inactivation kinetics. The effectiveness of hydrogen peroxide in sterilization is influenced by various factors, including aqueous hydrogen peroxide concentration, catalase enzyme impact on decomposition rates, and surface material compatibility. In the realm of food contact surfaces, hydrogen peroxide plays a crucial role in ensuring hygiene and safety. Its residual detection methods have been extensively studied to optimize food processing procedures.
Hydrogen peroxide decomposition kinetics modeling is essential in understanding its application in food contact surfaces and environmental remediation. Hydrogen peroxide's influence on the wound healing process and its disinfection efficacy on different surface types have been extensively researched. The impact of temperature and pH levels on hydrogen peroxide's stability and effectiveness is a critical consideration in various applications. Moreover, hydrogen peroxide's role in high concentration applications, such as industrial processes and biofilm disruption, is significant. Packaging material compatibility is a crucial factor in ensuring the safe and effective use of hydrogen peroxide. Adoption rates of hydrogen peroxide in industrial applications are notably higher than in academic research, accounting for a substantial market share.
This trend is driven by the growing demand for efficient and cost-effective disinfection methods in various industries. Safety protocols, including personal protective equipment and handling procedures, are essential in ensuring the safe and effective use of hydrogen peroxide. Hydrogen peroxide decomposition byproduct analysis is a critical aspect of its application, as understanding the byproducts can help optimize its usage and minimize potential risks.
What are the key market drivers leading to the rise in the adoption of Hydrogen Peroxide Industry?
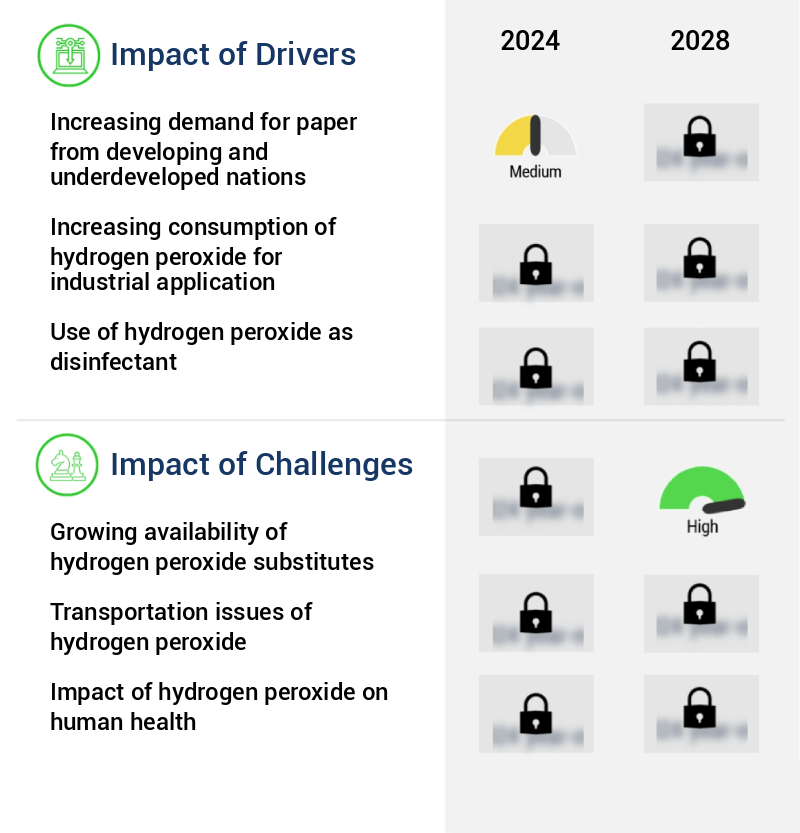
- The demand for paper, particularly from developing and underdeveloped nations, serves as the primary market driver due to increasing consumption in various sectors such as education, packaging, and printing industries.
- The market is experiencing significant growth, particularly in developing countries like India, Malaysia, and others. This expansion is attributed to the increasing literacy rates, leading to a surge in the use of printing technology. For instance, the Indian government's focus on paper manufacturing is expected to fuel the demand for hydrogen peroxide in the pulp and paper industry. Manufacturers are adopting eco-friendly technologies and advanced water management systems to enhance paper production efficiency.
- Moreover, the recycling of paper has seen substantial growth due to the rising demand for specialty chemicals, making the pulp and paper industry a crucial revenue generator. These trends underscore the dynamic nature of the market and its diverse applications across various sectors.
What are the market trends shaping the Hydrogen Peroxide Industry?
- The emerging market trend involves innovative applications of hydrogen peroxide. Hydrogen peroxide's versatile use is gaining increasing recognition in various industries.
- Hydrogen peroxide manufacturing has experienced significant advancements, leading to increased production volumes. This expansion has primarily been driven by population growth and the emergence of diverse usage techniques. Innovative approaches to hydrogen peroxide application can yield substantial benefits. For example, the Department of Energy from Stanford University and SLAC National Accelerator Laboratory have engineered a compact device to generate hydrogen peroxide using renewable energy sources, such as solar panels.
- This electrochemical cell produces hydrogen peroxide from water and oxygen, which can then be employed to oxidize groundwater contaminants that pose health risks. The potential of hydrogen peroxide in water treatment and environmental applications is vast, underscoring the importance of continuous innovation in this sector.
What challenges does the Hydrogen Peroxide Industry face during its growth?
- The expanding market accessibility of hydrogen peroxide alternatives poses a significant challenge to the industry's growth trajectory.
- The market faces hindrances from the increasing utilization of alternatives in key industries, such as pulp and paper, during the forecast period. Hydrogen peroxide's market expansion is challenged by the industry's shift towards surrogate bleaching agents, like chlorine-based agents, sodium dithionate, and xylanase enzymes. These alternatives offer residue-free action, making them increasingly popular in the pulp and paper sector's incremental growth trajectory. The market is expected to encounter obstacles due to the expanding presence of alternatives in wastewater treatment applications as well.
- Despite these challenges, the market continues to evolve, offering significant potential in various sectors, including electronics, pharmaceuticals, and textiles.
Exclusive Technavio Analysis on Customer Landscape
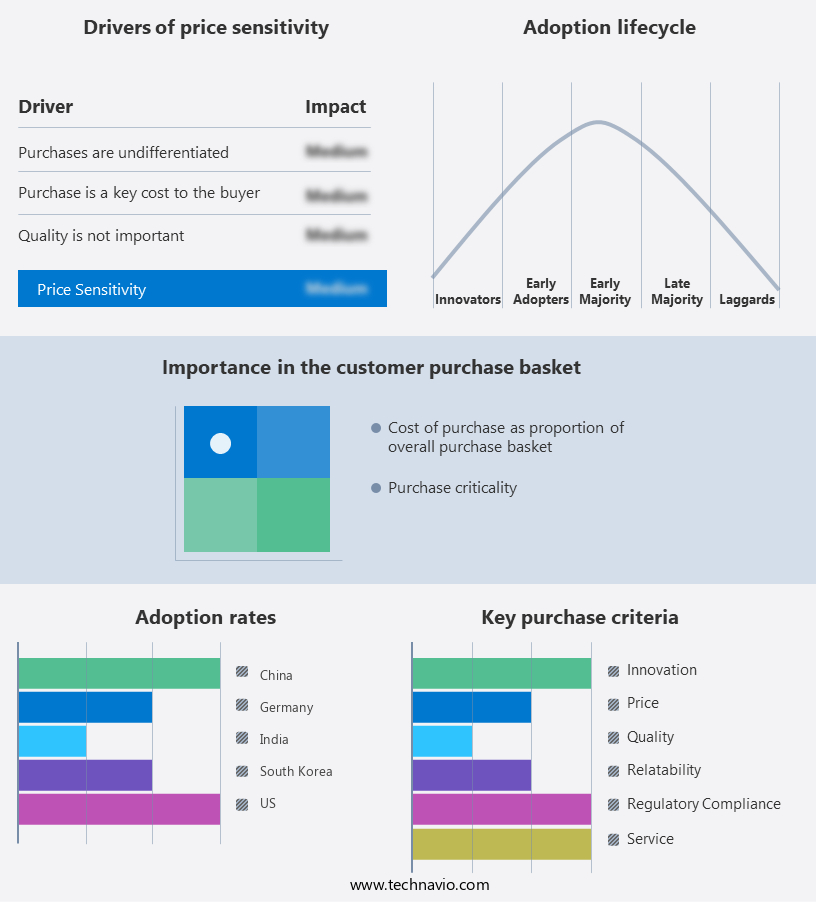
The hydrogen peroxide market forecasting report includes the adoption lifecycle of the market, covering from the innovator’s stage to the laggard’s stage. It focuses on adoption rates in different regions based on penetration. Furthermore, the hydrogen peroxide market report also includes key purchase criteria and drivers of price sensitivity to help companies evaluate and develop their market growth analysis strategies.
Customer Landscape of Hydrogen Peroxide Industry
Competitive Landscape
Companies are implementing various strategies, such as strategic alliances, hydrogen peroxide market forecast, partnerships, mergers and acquisitions, geographical expansion, and product/service launches, to enhance their presence in the industry.
Solvay - Thai Peroxide Ltd, a leading global hydrogen peroxide producer, boasts a substantial manufacturing capacity of 22,500 MTPA. This capacity underpins the company's commitment to delivering high-quality hydrogen peroxide solutions to diverse industries. With a robust production base, Thai Peroxide continues to drive innovation and meet the evolving demands of the global market.
The industry research and growth report includes detailed analyses of the competitive landscape of the market and information about key companies, including:
- Solvay
- Evonik Industries
- Arkema
- Mitsubishi Gas Chemical Co., Inc.
- PeroxyChem
- AkzoNobel
- BASF SE
- Aditya Birla Chemicals
- Gujarat Alkalies and Chemicals Ltd.
- OCI Company Ltd.
- National Peroxide Limited
- Huatai Group
- Jiangshan Shuangyangshui Co., Ltd.
- Kemira
- Ercros S.A.
- Hansol Chemical
- MGC Pure Chemicals America
- Nouryon
- Indian Peroxide Ltd.
- Thai Peroxide Co., Ltd.
Qualitative and quantitative analysis of companies has been conducted to help clients understand the wider business environment as well as the strengths and weaknesses of key industry players. Data is qualitatively analyzed to categorize companies as pure play, category-focused, industry-focused, and diversified; it is quantitatively analyzed to categorize companies as dominant, leading, strong, tentative, and weak.
Recent Development and News in Hydrogen Peroxide Market
- In January 2024, Linde plc, a leading industrial gases company, announced the expansion of its hydrogen peroxide production capacity in the United States. The USD120 million investment aims to increase production by 50%, making it the largest hydrogen peroxide manufacturing site in North America (Linde plc Press Release).
- In March 2024, DuPont de Nemours, Inc. And South Korean energy company, Hanjin Energy, formed a strategic partnership to develop a hydrogen peroxide production facility in South Korea. The joint venture will leverage DuPont's expertise in hydrogen peroxide production and Hanjin's resources in the region (DuPont de Nemours, Inc. Press Release).
- In April 2025, Solvay, a global chemical company, completed the acquisition of Nalco Water, a leading water treatment solutions provider. This acquisition will enable Solvay to expand its hydrogen peroxide offerings, particularly in the water treatment sector, and strengthen its position in the global market (Solvay Press Release).
- In May 2025, the European Commission approved the merger of BASF SE's hydrogen peroxide business with INEOS Oxide. The combined entity will create the world's largest hydrogen peroxide producer, with an estimated 30% market share (European Commission Press Release).
Dive into Technavio’s robust research methodology, blending expert interviews, extensive data synthesis, and validated models for unparalleled Hydrogen Peroxide Market insights. See full methodology.
|
Market Scope |
|
|
Report Coverage |
Details |
|
Page number |
192 |
|
Base year |
2023 |
|
Historic period |
2018-2022 |
|
Forecast period |
2024-2028 |
|
Growth momentum & CAGR |
Accelerate at a CAGR of 5.02% |
|
Market growth 2024-2028 |
USD 545.5 million |
|
Market structure |
Fragmented |
|
YoY growth 2023-2024(%) |
4.69 |
|
Key countries |
US, Canada, Germany, UK, Italy, France, China, India, Japan, Brazil, Egypt, UAE, Oman, Argentina, KSA, UAE, Brazil, and Rest of World (ROW) |
|
Competitive landscape |
Leading Companies, Market Positioning of Companies, Competitive Strategies, and Industry Risks |
Research Analyst Overview
- In the dynamic and evolving the market, this versatile compound continues to gain prominence across various industries due to its unique properties. Hydrogen peroxide vapor exhibits potent antimicrobial effects, making it a valuable asset in DNA and RNA damage mitigation. This damage is a significant concern in numerous applications, including wastewater treatment, where hydrogen peroxide plays a crucial role in breaking down organic matter. The market's ongoing activities are characterized by advancements in plasma sterilization and oxidative sterilization techniques. These methods leverage the compound's ability to catalytically decompose, releasing free radicals that damage cell membranes and inactivate microorganisms. The efficacy of hydrogen peroxide in disinfection is temperature-dependent, with optimal performance at elevated temperatures.
- Environmental remediation is another burgeoning sector for hydrogen peroxide, where it demonstrates impressive capabilities in surface decontamination and water purification. Its oxidative stress properties contribute to biofilm disruption and material compatibility, making it a preferred choice for water treatment and food safety applications. The market's evolution is marked by continuous research into its decomposition kinetics and concentration control. This focus on optimization ensures the compound's stability and safety, enabling its use in personal protective equipment and various industrial processes. Despite its numerous advantages, the market faces challenges in managing residual concentration and handling its antimicrobial properties safely.
- Exposure limits and safety protocols are essential to mitigate potential risks associated with its use. In conclusion, the market is a vibrant and ever-evolving landscape, driven by ongoing research and innovation. Its versatility and antimicrobial properties make it a valuable asset in various industries, from wastewater treatment and environmental remediation to food safety and personal protective equipment.
What are the Key Data Covered in this Hydrogen Peroxide Market Research and Growth Report?
-
What is the expected growth of the Hydrogen Peroxide Market between 2024 and 2028?
-
USD 545.5 million, at a CAGR of 5.02%
-
-
What segmentation does the market report cover?
-
The report is segmented by Application (Industrial, Food Grade, and Pharmaceutical Grade), End-user (Pulp and paper, Textiles, Wastewater treatment, and Others), Geography (APAC, North America, Europe, Middle East and Africa, and South America), and Concentration (Below 35%, 35%-50%, and Above 50%)
-
-
Which regions are analyzed in the report?
-
APAC, North America, Europe, Middle East and Africa, and South America
-
-
What are the key growth drivers and market challenges?
-
Increasing demand for paper from developing and underdeveloped nations, Growing availability of hydrogen peroxide substitutes
-
-
Who are the major players in the Hydrogen Peroxide Market?
-
Solvay, Evonik Industries, Arkema, Mitsubishi Gas Chemical Co., Inc., PeroxyChem, AkzoNobel, BASF SE, Aditya Birla Chemicals, Gujarat Alkalies and Chemicals Ltd., OCI Company Ltd., National Peroxide Limited, Huatai Group, Jiangshan Shuangyangshui Co., Ltd., Kemira, Ercros S.A., Hansol Chemical, MGC Pure Chemicals America, Nouryon, Indian Peroxide Ltd., and Thai Peroxide Co., Ltd.
-
Market Research Insights
- The market encompasses the production, application, and innovation of hydrogen peroxide, a versatile chemical compound known for its high reduction potential and oxidation capacity. Two significant aspects of this market include bioburden reduction and environmental impact. Hydrogen peroxide solutions, particularly aqueous ones, are widely used for immersion disinfection due to their log reduction values against various microorganisms. In contrast, the environmental impact of hydrogen peroxide is relatively low due to its degradation pathways, which primarily result in water and oxygen. Chemical reaction rates in hydrogen peroxide applications vary greatly depending on the concentration and application method. For instance, low-concentration applications, such as fogging technology, offer efficient contamination control, while high-concentration applications, like cleaning validation, require more precise handling and storage conditions.
- Shelf life stability is crucial in ensuring the efficacy of hydrogen peroxide solutions, with proper packaging influence playing a vital role. Hydrogen bonding and electron transfer contribute to the chemical properties that make hydrogen peroxide an effective sterilant and cleaning agent. Waste management is an essential consideration in the market, with vapor phase generation and byproduct analysis playing key roles in minimizing environmental impact. The market continues to evolve, with ongoing research focusing on improving delivery systems, enhancing sterilant efficacy testing, and optimizing storage conditions to cater to diverse application needs.
We can help! Our analysts can customize this hydrogen peroxide market research report to meet your requirements.
 RIA -
RIA - 
