
Marijuana Market Analysis, Size, and Forecast 2026-2030: North America (US, Canada, and Mexico), Europe (Germany, France, and Italy), APAC (China, Japan, and Australia), South America (Brazil, Argentina, and Chile), Middle East and Africa (South Africa, Israel, and Turkey), and Rest of World (ROW)

Marijuana Market Analysis, Size, and Forecast 2026-2030:
North America (US, Canada, and Mexico), Europe (Germany, France, and Italy), APAC (China, Japan, and Australia), South America (Brazil, Argentina, and Chile), Middle East and Africa (South Africa, Israel, and Turkey), and Rest of World (ROW)

Published: Oct 2026 290 Pages SKU: IRTNTR71020

Market Overview at a Glance

$167.65 B
Market Opportunity
36%
CAGR 2025 - 2030
86.8%
North America Growth
$18.11 B
Recreational marijuana segment 2024

Marijuana Market Size 2026-2030

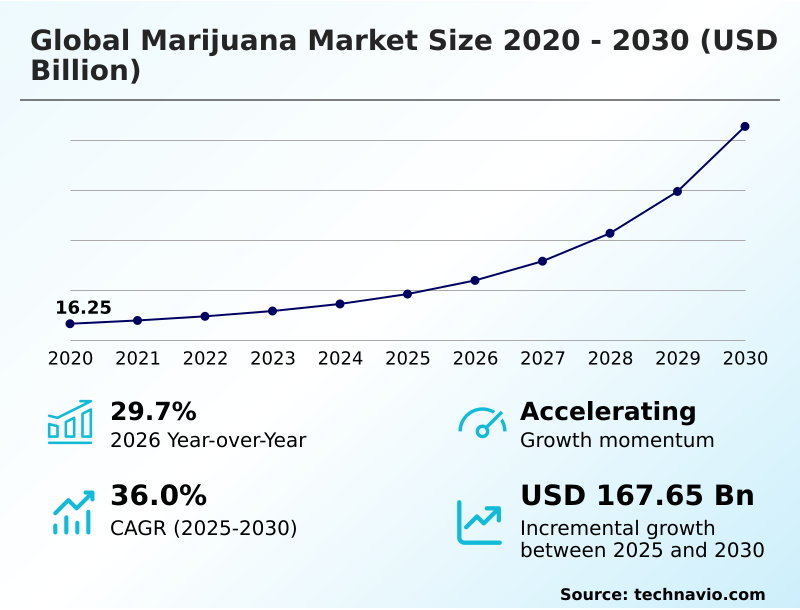
The marijuana market size is valued to increase by USD 167.65 billion, at a CAGR of 36% from 2025 to 2030. Therapeutic standardization accelerates pharmacy network growth will drive the marijuana market.

Major Market Trends & Insights

  • North America dominated the market and accounted for a 86.8% growth during the forecast period.
  • By Product - Recreational marijuana segment was valued at USD 18.11 billion in 2024
  • By Type - Oil and tinctures segment accounted for the largest market revenue share in 2024

Market Size & Forecast

  • Market Opportunities: USD 197.35 billion
  • Market Future Opportunities: USD 167.65 billion
  • CAGR from 2025 to 2030 : 36%

Market Summary

  • The Marijuana demonstrates accelerated commercial scaling driven by the transition toward specialized consumer packaged goods and standardized medicinal formulations. Retail operators increasingly optimize their supply chain infrastructure by integrating automated inventory management platforms, which has successfully reduced localized stockouts by 18% across major dispensary networks.
  • This structural expansion is primarily propelled by the integration of pharmaceutical-grade formulations into formal healthcare systems; as clinical research validates botanical efficacy, medical practitioners prescribe these therapies more frequently, establishing predictable commercial revenue streams. Conversely, the industry faces severe structural limitations due to fragmented regulatory frameworks across multiple jurisdictions.
  • Multinational enterprises must construct redundant compliance and testing departments to satisfy localized mandates, significantly elevating operational overhead and restricting agile cross-border commerce. To sustain competitive margins, leading cultivators continually refine their extraction and purification protocols, balancing high compliance costs against the rising consumer demand for precision-dosed, contaminant-free therapeutic products.

What will be the Size of the Marijuana Market during the forecast period?
Get Key Insights on Market Forecast (PDF) Get Free Sample

How is the Marijuana Market Segmented?

The marijuana industry research report provides comprehensive data (region-wise segment analysis), with forecasts and estimates in "USD million" for the period 2026-2030, as well as historical data from 2020-2024 for the following segments.

  • Product
    • Recreational marijuana
    • Medical marijuana
  • Type
    • Oil and tinctures
    • Flower
  • Product type
    • Dried
    • Extracts
    • Infused products
    • Pharmaceutical formulations
  • Geography
    • North America
      • US
      • Canada
      • Mexico
    • Europe
      • Germany
      • France
      • Italy
      • UK
      • Spain
      • The Netherlands
    • APAC
      • China
      • Japan
      • Australia
      • India
      • South Korea
      • Indonesia
    • South America
      • Brazil
      • Argentina
      • Chile
    • Middle East and Africa
      • South Africa
      • Israel
      • Turkey
      • Saudi Arabia
      • UAE

By Product Insights

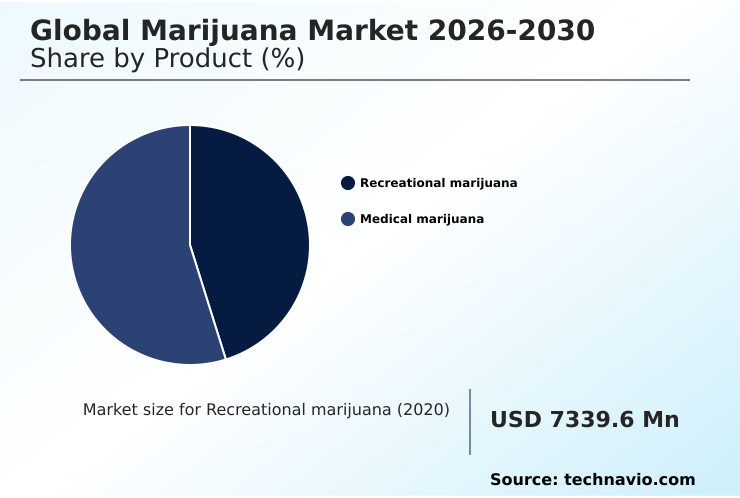
The recreational marijuana segment is estimated to witness significant growth during the forecast period.

The recreational segment of the Marijuana commands robust retail volume by delivering specialized consumer packaged goods directly to adult users. Operations leverage cannabinoid extraction and supercritical carbon dioxide methods to formulate potent, smokeless alternatives alongside traditional flower.

Cultivators utilize indoor environment agriculture and automated fertigation to maximize yields while ensuring terpene profile preservation. Compliance mandates require standardized dosage units and clinical-grade packaging to protect consumers and meet stringent regulatory thresholds.

Recent operational data indicates that enterprise operators scaling batch consistency testing workflows improved inventory throughput by 14% compared to legacy processing systems, significantly reducing product rejection rates.

Furthermore, adopting advanced delivery mechanisms originally developed for chronic pain management accelerates mainstream adoption of functional beverages, ultimately stabilizing highly predictable commercial sales channels.
Get Free Sample

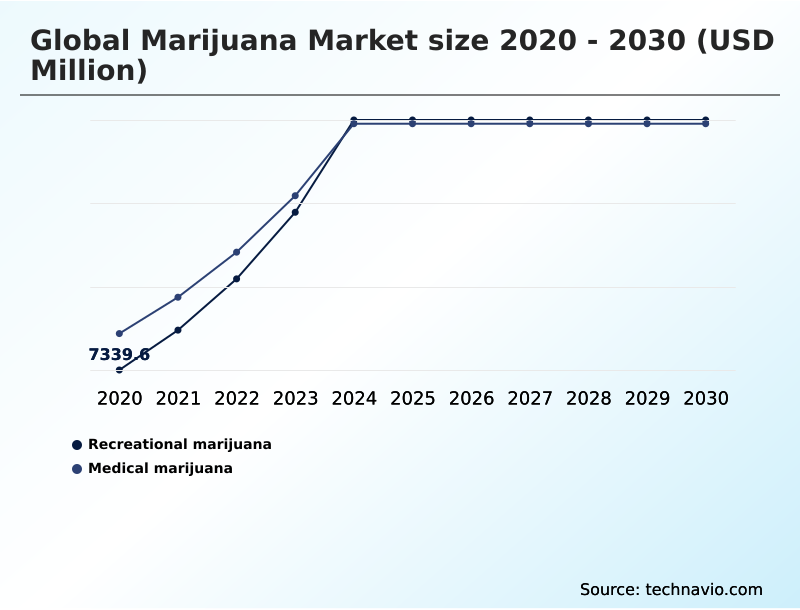
The Recreational marijuana segment was valued at USD 18.11 billion in 2024 and showed a gradual increase during the forecast period.
Get Free Sample

Regional Analysis

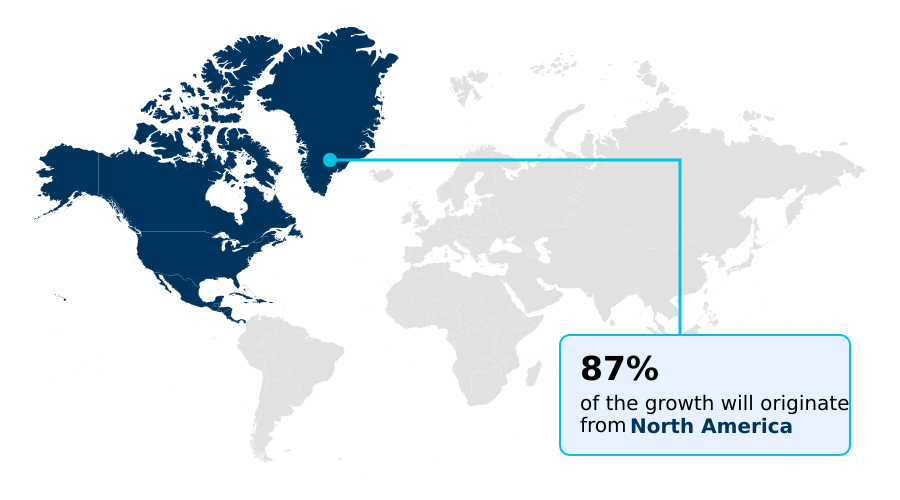
North America is estimated to contribute 86.8% to the growth of the global market during the forecast period.Technavio’s analysts have elaborately explained the regional trends and drivers that shape the market during the forecast period.
See How Marijuana Market Demand is Rising in North America Get Free Sample

The geographic landscape of the Marijuana reveals stark operational contrasts between established and emerging regulatory territories. North America captures an 86.8% share of incremental volume, driven by robust adult-use retail infrastructure and extensive commercial dispensary networks.

In contrast, the European sector relies almost exclusively on pharmaceutical-grade distribution, resulting in a 35% higher adoption rate of active pharmaceutical ingredients compared to North American recreational channels.

European operators aggressively prioritize microbiological purity and precise synthetic cannabinoid synthesis to satisfy strict healthcare import standards. Meanwhile, North American cultivators emphasize advanced strain genetics and automated harvest drying techniques to maximize flower yields.

These diverging priorities force multinational enterprises to split their supply chains; companies optimizing their curing protocols and decarboxylation processing for European export report a 28% increase in compliance overhead but achieve vastly superior price premiums.

Ensuring exact dosage homogeneity and mitigating agricultural pathogens remain universal mandates, directly shaping international distribution strategies and solvent recovery investments.

Market Dynamics

Our researchers analyzed the data with 2025 as the base year, along with the key drivers, trends, and challenges. A holistic analysis of drivers will help companies refine their marketing strategies to gain a competitive advantage.

  • The commercial evolution of the Marijuana heavily relies on the deployment of highly specialized processing infrastructure designed to meet both consumer lifestyle preferences and rigorous medical mandates. To achieve necessary product purity, enterprise manufacturers are rapidly integrating advanced supercritical cannabinoid extraction systems, which drastically minimize residual solvent contamination while scaling continuous commercial throughput.
  • By applying pharmaceutical grade indoor agriculture methods, licensed cultivators maintain exact environmental controls over lighting, humidity, and nutrient delivery, directly enhancing baseline crop yields and ensuring absolute chemical consistency across every harvest cycle. This level of environmental precision prevents pathogen development and standardizes the botanical inputs required for downstream processing.
  • Furthermore, processing facilities routinely implement standardized terpene profile preservation techniques to protect volatile aromatic compounds during extraction, thereby securing the distinct therapeutic and sensory characteristics demanded by premium retail segments. As consumers increasingly shift away from combustible delivery formats, brands are pivoting toward sophisticated infused beverage portfolios.
  • This transition is powered by the utilization of nano emulsion water soluble suspensions, which significantly accelerate metabolic absorption rates compared to traditional lipid-based edibles. Facilities adopting these advanced nano-formulations report a 40% improvement in active ingredient onset times relative to legacy products, directly elevating customer retention and reinforcing brand loyalty across highly competitive dispensary networks.
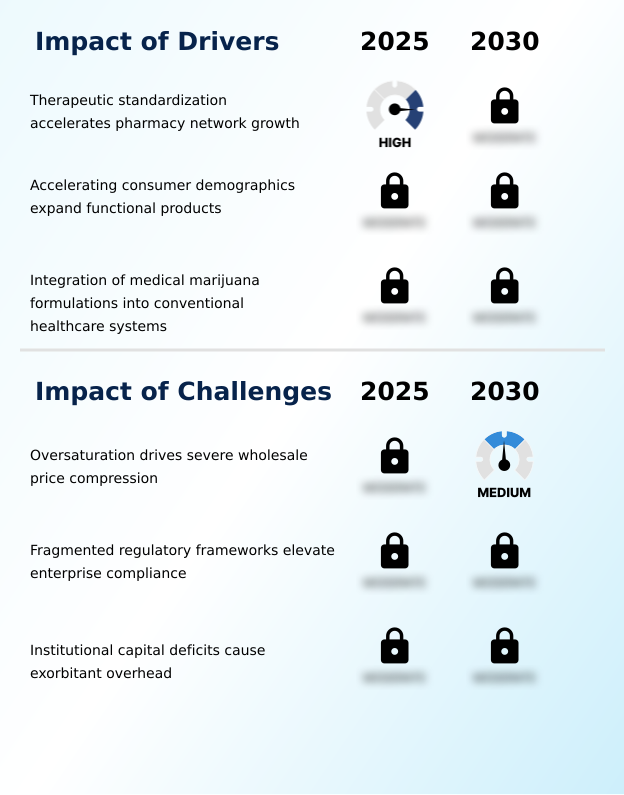
What are the key market drivers leading to the rise in the adoption of Marijuana Industry?

  • Therapeutic standardization accelerates pharmacy network growth by validating the clinical efficacy of botanical formulations for mainstream healthcare integration.

  • The integration of standardized botanical therapies into mainstream healthcare systems serves as a primary growth catalyst for the Marijuana. Pharmaceutical enterprises increasingly demand exact pharmacokinetic profiles to validate clinical efficacy for chronic condition management.
  • To achieve this, processors utilize wiped-film distillation and advanced infusion processing to isolate target compounds with absolute consistency.
  • The deployment of nano-emulsion technology and water-soluble suspensions has drastically improved bioavailability optimization, allowing onset times to decrease by 35% compared to conventional lipid-based carrier systems. This technical evolution directly enhances patient outcomes and accelerates regulatory approvals.
  • Consequently, operators investing in superior shelf-life stability and compliant child-resistant packaging secure lucrative direct-to-pharmacy distribution agreements, fundamentally transforming raw agricultural outputs into highly predictable, prescription-based revenue streams.

What are the market trends shaping the Marijuana Industry?

  • Convenience formulations increasingly drive product category dominance as consumers prioritize ready-to-use, standardized formats.

  • The transition toward convenience formulations and premium concentrate formats decisively shapes current product category dominance within the Marijuana. Consumers increasingly bypass raw flower in favor of discreet vaporizer cartridges and fast-acting edibles that precisely interact with the endocannabinoid system.
  • To meet this demand, manufacturers are scaling live resin production and extracting high-purity solventless rosin to preserve authentic aromatic profiles and maximize delta-9-tetrahydrocannabinol concentrations. This shift from manual preparation to ready-to-use formats has improved retail inventory turnover by 24% across leading dispensary networks. Additionally, the rising adoption of cannabidiol isolate supports expanding therapeutic applications, particularly for neurological symptom relief.
  • As patients pivot toward sublingual administration and targeted transdermal delivery systems, enterprise operators capture superior gross margins while delivering the standardized, smoke-free experiences that modern consumers mandate.

What challenges does the Marijuana Industry face during its growth?

  • Systemic overproduction drives severe wholesale price compression, persistently eroding operating margins and straining the financial stability of regional cultivators.

  • Severe wholesale price compression driven by localized overproduction presents a critical structural hurdle for the Marijuana. As cultivation capacities outpace consumer demand, agricultural yields routinely flood regional supply chains, forcing market valuations sharply downward.
  • Compounding this issue, processors attempting to scale plant-derived therapeutics must heavily invest in capital-intensive botanical extraction and chromatography purification equipment to meet strict good manufacturing practice standards. The mandatory implementation of rigorous winterization processes, safe handling of hydrocarbon solvents, and advanced cryogenic processing elevates baseline operational costs by over 28% compared to unregulated agricultural sectors.
  • Furthermore, fragmented compliance landscapes require multi-state operators to deploy redundant seed-to-sale tracking software for different botanical cultivars, draining corporate treasury reserves and severely limiting the agility required to maintain profitability in saturated territories.

Exclusive Technavio Analysis on Customer Landscape

The marijuana market forecasting report includes the adoption lifecycle of the market, covering from the innovator’s stage to the laggard’s stage. It focuses on adoption rates in different regions based on penetration. Furthermore, the marijuana market report also includes key purchase criteria and drivers of price sensitivity to help companies evaluate and develop their market growth analysis strategies.
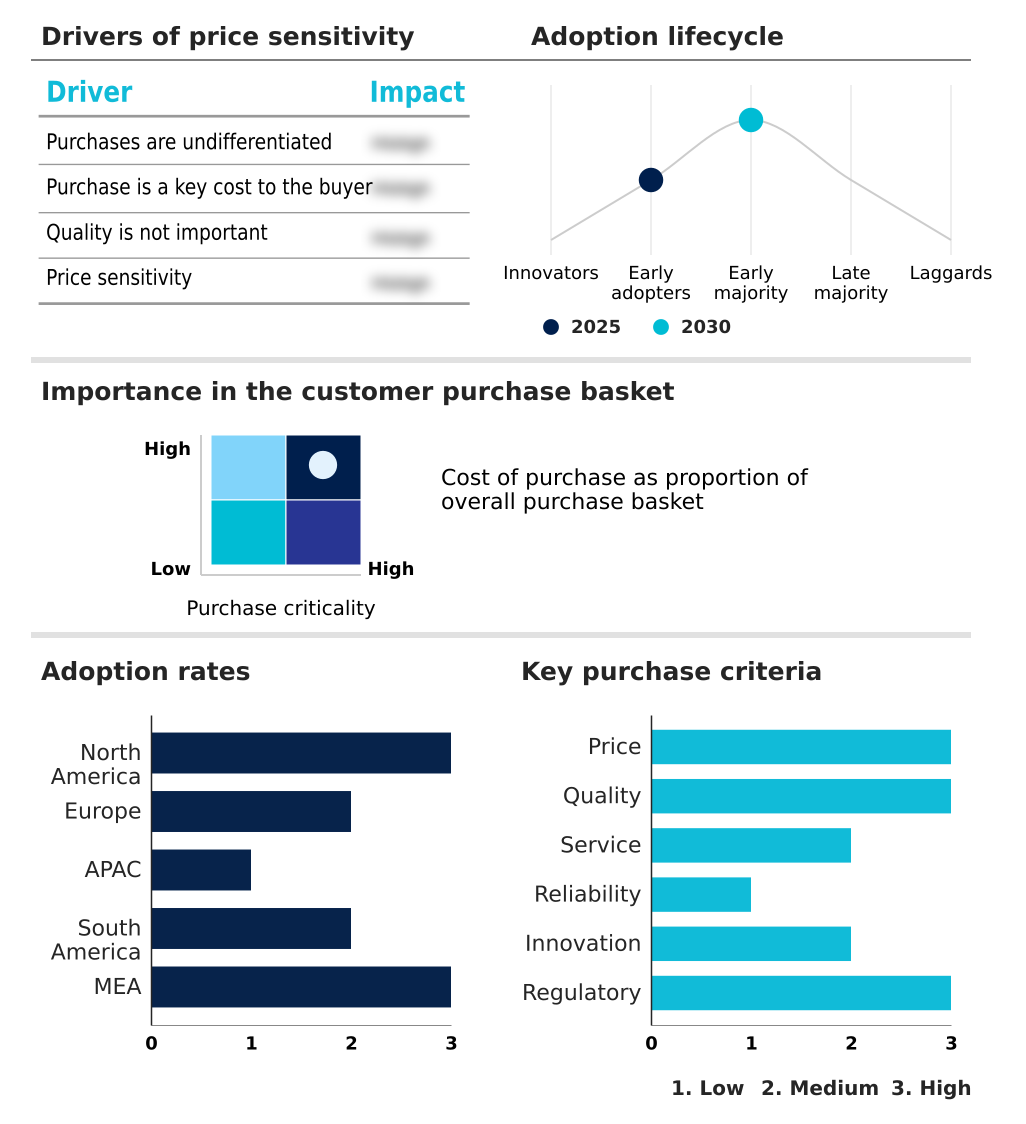
Customer Landscape of Marijuana Industry

Competitive Landscape

Companies are implementing various strategies, such as strategic alliances, marijuana market forecast, partnerships, mergers and acquisitions, geographical expansion, and product/service launches, to enhance their presence in the industry.

Ascend Wellness Holdings Inc. - The vendor provides standardized medical cannabis, premium flower, and specialized extracts, delivering consistent botanical formulations designed for compliant dispensary distribution and therapeutic applications.

The industry research and growth report includes detailed analyses of the competitive landscape of the market and information about key companies, including:

  • Ascend Wellness Holdings Inc.
  • Aurora Cannabis Inc.
  • Bedrocan International B.V.
  • Blum Holdings Inc.
  • Canopy Growth Corp.
  • Cresco Labs Inc.
  • Cronos Group Inc.
  • Curaleaf Holdings Inc.
  • CV Sciences Inc.
  • Little Green Pharma Ltd.
  • Medical Marijuana Inc.
  • MediPharm Labs Inc.
  • Organigram Holdings Inc.
  • SNDL Inc.
  • Terrascend Canada
  • Tilray Brands Inc.
  • Trulieve Cannabis Corp.
  • Verano Holdings LLC
  • Village Farms International Inc.

Qualitative and quantitative analysis of companies has been conducted to help clients understand the wider business environment as well as the strengths and weaknesses of key industry players. Data is qualitatively analyzed to categorize companies as pure play, category-focused, industry-focused, and diversified; it is quantitatively analyzed to categorize companies as dominant, leading, strong, tentative, and weak.

Recent Development and News in Marijuana market

  • In the Tobacco industry, the widespread adoption of precision vaporizer cartridges and advanced inhalation hardware has accelerated the development of non-combustible consumption formats, directly impacting Marijuana demand by driving the transition toward high-margin liquid oil and botanical cultivars.
  • In the Tobacco industry, the implementation of rigorous child-resistant packaging and clinical-grade packaging mandates for nicotine alternative products has established stringent compliance frameworks, directly impacting Marijuana operations by increasing manufacturing overhead and necessitating standardized dosage units across commercial dispensaries.
  • In the Tobacco industry, sophisticated seed-to-sale tracking and supply chain digitization protocols deployed to combat illicit trade have redefined distribution transparency, directly impacting Marijuana supply dynamics by forcing licensed cultivators to adopt identical traceability systems to ensure batch consistency testing.
  • In the Tobacco industry, corporate expansion into plant-derived therapeutics and wellness-oriented consumer products has spurred large-scale agricultural investments, directly impacting Marijuana competitive positioning as major enterprises leverage existing cryogenic processing and infusion processing infrastructure to capture emerging medical sectors.

Dive into Technavio’s robust research methodology, blending expert interviews, extensive data synthesis, and validated models for unparalleled Marijuana Market insights. See full methodology.

Market Scope
Page number 290
Base year 2025
Historic period 2020-2024
Forecast period 2026-2030
Growth momentum & CAGR Accelerate at a CAGR of 36%
Market growth 2026-2030 USD 167647.9 million
Market structure Fragmented
YoY growth 2025-2026(%) 29.7%
Key countries US, Canada, Mexico, Germany, France, Italy, UK, Spain, The Netherlands, China, Japan, Australia, India, South Korea, Indonesia, Brazil, Argentina, Chile, South Africa, Israel, Turkey, Saudi Arabia and UAE
Competitive landscape Leading Companies, Market Positioning of Companies, Competitive Strategies, and Industry Risks

Request Free Sample

Research Analyst Overview

  • The Marijuana undergoes continuous structural refinement as enterprise operators prioritize precision botanical manufacturing and omnichannel retail expansion. Modern dispensaries aggressively transition raw biomass into high-margin consumer packaged goods, significantly expanding the availability of fast-acting edibles and discrete vaporizers.
  • Multistate organizations navigating fragmented compliance landscapes increasingly centralize their processing hubs; this strategic consolidation has enabled top-tier manufacturers to achieve a 30% reduction in per-gram extraction costs compared to decentralized operations. Advanced cultivation facilities leverage automated climate control architectures to secure reliable chemical profiles and eliminate localized crop failures.
  • Furthermore, the integration of digital inventory management systems allows retail chains to align procurement directly with predictive consumer purchasing habits. The rising institutional focus on standardizing pharmaceutical formulations directly addresses boardroom-level compliance mandates, shielding specialized medical producers from the volatile price fluctuations typically observed in raw agricultural commodities.
  • Ultimately, sustained capital investments in extraction technology and digital retail infrastructure allow commercial entities to maximize transaction values while maintaining strict adherence to evolving global health regulations.

What are the Key Data Covered in this Marijuana Market Research and Growth Report?

  • What is the expected growth of the Marijuana Market between 2026 and 2030?

    • USD 167.65 billion, at a CAGR of 36%

  • What segmentation does the market report cover?

    • The report is segmented by Product (Recreational marijuana, and Medical marijuana), Type (Oil and tinctures, and Flower), Product Type (Dried, Extracts, Infused products, and Pharmaceutical formulations) and Geography (North America, Europe, APAC, South America, Middle East and Africa)

  • Which regions are analyzed in the report?

    • North America, Europe, APAC, South America and Middle East and Africa

  • What are the key growth drivers and market challenges?

    • Therapeutic standardization accelerates pharmacy network growth, Oversaturation drives severe wholesale price compression

  • Who are the major players in the Marijuana Market?

    • Ascend Wellness Holdings Inc., Aurora Cannabis Inc., Bedrocan International B.V., Blum Holdings Inc., Canopy Growth Corp., Cresco Labs Inc., Cronos Group Inc., Curaleaf Holdings Inc., CV Sciences Inc., Little Green Pharma Ltd., Medical Marijuana Inc., MediPharm Labs Inc., Organigram Holdings Inc., SNDL Inc., Terrascend Canada, Tilray Brands Inc., Trulieve Cannabis Corp., Verano Holdings LLC and Village Farms International Inc.

Market Research Insights

  • The Marijuana reflects a highly technical landscape where continuous bio-agricultural innovation meets strict pharmaceutical compliance. Cultivation enterprises increasingly adopt bioavailability optimization and transdermal delivery mechanisms to cater to advanced patient requirements. The deployment of advanced solvent recovery systems has lowered active processing costs by 22% compared to conventional methodologies, dramatically improving operational margins.
  • Concurrently, the implementation of stringent curing protocols and harvest drying workflows has reduced microbial failure rates by 15% across major testing facilities. By standardizing phytocannabinoid profiles and leveraging the entourage effect, manufacturers deliver highly reliable therapeutics that meet both complex regulatory mandates and expanding consumer expectations.

We can help! Our analysts can customize this marijuana market research report to meet your requirements.

Get in touch

1. Executive Summary

1.1 Market overview

Executive Summary - Chart on Market Overview
Executive Summary - Data Table on Market Overview
Executive Summary - Chart on Global Market Characteristics
Executive Summary - Chart on Market by Geography
Executive Summary - Chart on Market Segmentation by Product
Executive Summary - Chart on Market Segmentation by Type
Executive Summary - Chart on Market Segmentation by Product Type
Executive Summary - Chart on Incremental Growth
Executive Summary - Data Table on Incremental Growth
Executive Summary - Chart on Company Market Positioning

2. Technavio Analysis

2.1 Analysis of price sensitivity, lifecycle, customer purchase basket, adoption rates, and purchase criteria

2.2 Criticality of inputs and Factors of differentiation

Chart on Overview on criticality of inputs and factors of differentiation

2.3 Factors of disruption

Chart on Overview on factors of disruption

2.4 Impact of drivers and challenges

Chart on Impact of drivers and challenges in 2025 and 2030

3. Market Landscape

3.1 Market ecosystem

Chart on Parent Market
Data Table on - Parent Market

3.2 Market characteristics

Chart on Market characteristics analysis

3.3 Value chain analysis

Chart on Value chain analysis

4. Market Sizing

4.1 Market definition

Data Table on Offerings of companies included in the market definition

4.2 Market segment analysis

Market segments

4.3 Market size 2025

4.4 Market outlook: Forecast for 2025-2030

Chart on Global - Market size and forecast 2025-2030 ($ million)
Data Table on Global - Market size and forecast 2025-2030 ($ million)
Chart on Global Market: Year-over-year growth 2025-2030 (%)
Data Table on Global Market: Year-over-year growth 2025-2030 (%)

5. Historic Market Size

5.1 Global Marijuana Market 2020 - 2024

Historic Market Size - Data Table on Global Marijuana Market 2020 - 2024 ($ million)

5.2 Product segment analysis 2020 - 2024

Historic Market Size - Product Segment 2020 - 2024 ($ million)

5.3 Type segment analysis 2020 - 2024

Historic Market Size - Type Segment 2020 - 2024 ($ million)

5.4 Product Type segment analysis 2020 - 2024

Historic Market Size - Product Type Segment 2020 - 2024 ($ million)

5.5 Geography segment analysis 2020 - 2024

Historic Market Size - Geography Segment 2020 - 2024 ($ million)

5.6 Country segment analysis 2020 - 2024

Historic Market Size - Country Segment 2020 - 2024 ($ million)

6. Qualitative Analysis

6.1 Impact of AI on global marijuana market

6.2 Impact of geopolitical conflicts on global marijuana market

7. Five Forces Analysis

7.1 Five forces summary

Five forces analysis - Comparison between 2025 and 2030

7.2 Bargaining power of buyers

Bargaining power of buyers - Impact of key factors 2025 and 2030

7.3 Bargaining power of suppliers

Bargaining power of suppliers - Impact of key factors in 2025 and 2030

7.4 Threat of new entrants

Threat of new entrants - Impact of key factors in 2025 and 2030

7.5 Threat of substitutes

Threat of substitutes - Impact of key factors in 2025 and 2030

7.6 Threat of rivalry

Threat of rivalry - Impact of key factors in 2025 and 2030

7.7 Market condition

Chart on Market condition - Five forces 2025 and 2030

8. Market Segmentation by Product

8.1 Market segments

Chart on Product - Market share 2025-2030 (%)
Data Table on Product - Market share 2025-2030 (%)

8.2 Comparison by Product

Chart on Comparison by Product
Data Table on Comparison by Product

8.3 Recreational marijuana - Market size and forecast 2025-2030

Chart on Recreational marijuana - Market size and forecast 2025-2030 ($ million)
Data Table on Recreational marijuana - Market size and forecast 2025-2030 ($ million)
Chart on Recreational marijuana - Year-over-year growth 2025-2030 (%)
Data Table on Recreational marijuana - Year-over-year growth 2025-2030 (%)

8.4 Medical marijuana - Market size and forecast 2025-2030

Chart on Medical marijuana - Market size and forecast 2025-2030 ($ million)
Data Table on Medical marijuana - Market size and forecast 2025-2030 ($ million)
Chart on Medical marijuana - Year-over-year growth 2025-2030 (%)
Data Table on Medical marijuana - Year-over-year growth 2025-2030 (%)

8.5 Market opportunity by Product

Market opportunity by Product ($ million)
Data Table on Market opportunity by Product ($ million)

9. Market Segmentation by Type

9.1 Market segments

Chart on Type - Market share 2025-2030 (%)
Data Table on Type - Market share 2025-2030 (%)

9.2 Comparison by Type

Chart on Comparison by Type
Data Table on Comparison by Type

9.3 Oil and tinctures - Market size and forecast 2025-2030

Chart on Oil and tinctures - Market size and forecast 2025-2030 ($ million)
Data Table on Oil and tinctures - Market size and forecast 2025-2030 ($ million)
Chart on Oil and tinctures - Year-over-year growth 2025-2030 (%)
Data Table on Oil and tinctures - Year-over-year growth 2025-2030 (%)

9.4 Flower - Market size and forecast 2025-2030

Chart on Flower - Market size and forecast 2025-2030 ($ million)
Data Table on Flower - Market size and forecast 2025-2030 ($ million)
Chart on Flower - Year-over-year growth 2025-2030 (%)
Data Table on Flower - Year-over-year growth 2025-2030 (%)

9.5 Market opportunity by Type

Market opportunity by Type ($ million)
Data Table on Market opportunity by Type ($ million)

10. Market Segmentation by Product Type

10.1 Market segments

Chart on Product Type - Market share 2025-2030 (%)
Data Table on Product Type - Market share 2025-2030 (%)

10.2 Comparison by Product Type

Chart on Comparison by Product Type
Data Table on Comparison by Product Type

10.3 Dried - Market size and forecast 2025-2030

Chart on Dried - Market size and forecast 2025-2030 ($ million)
Data Table on Dried - Market size and forecast 2025-2030 ($ million)
Chart on Dried - Year-over-year growth 2025-2030 (%)
Data Table on Dried - Year-over-year growth 2025-2030 (%)

10.4 Extracts - Market size and forecast 2025-2030

Chart on Extracts - Market size and forecast 2025-2030 ($ million)
Data Table on Extracts - Market size and forecast 2025-2030 ($ million)
Chart on Extracts - Year-over-year growth 2025-2030 (%)
Data Table on Extracts - Year-over-year growth 2025-2030 (%)

10.5 Infused products - Market size and forecast 2025-2030

Chart on Infused products - Market size and forecast 2025-2030 ($ million)
Data Table on Infused products - Market size and forecast 2025-2030 ($ million)
Chart on Infused products - Year-over-year growth 2025-2030 (%)
Data Table on Infused products - Year-over-year growth 2025-2030 (%)

10.6 Pharmaceutical formulations - Market size and forecast 2025-2030

Chart on Pharmaceutical formulations - Market size and forecast 2025-2030 ($ million)
Data Table on Pharmaceutical formulations - Market size and forecast 2025-2030 ($ million)
Chart on Pharmaceutical formulations - Year-over-year growth 2025-2030 (%)
Data Table on Pharmaceutical formulations - Year-over-year growth 2025-2030 (%)

10.7 Market opportunity by Product Type

Market opportunity by Product Type ($ million)
Data Table on Market opportunity by Product Type ($ million)

11. Customer Landscape

11.1 Customer landscape overview

Analysis of price sensitivity, lifecycle, customer purchase basket, adoption rates, and purchase criteria

12. Geographic Landscape

12.1 Geographic segmentation

Chart on Market share by geography 2025-2030 (%)
Data Table on Market share by geography 2025-2030 (%)

12.2 Geographic comparison

Chart on Geographic comparison
Data Table on Geographic comparison

12.3 North America - Market size and forecast 2025-2030

Chart on North America - Market size and forecast 2025-2030 ($ million)
Data Table on North America - Market size and forecast 2025-2030 ($ million)
Chart on North America - Year-over-year growth 2025-2030 (%)
Data Table on North America - Year-over-year growth 2025-2030 (%)
Chart on Regional Comparison - North America
Data Table on Regional Comparison - North America

12.3.1 US - Market size and forecast 2025-2030

Chart on US - Market size and forecast 2025-2030 ($ million)
Data Table on US - Market size and forecast 2025-2030 ($ million)
Chart on US - Year-over-year growth 2025-2030 (%)
Data Table on US - Year-over-year growth 2025-2030 (%)

12.3.2 Canada - Market size and forecast 2025-2030

Chart on Canada - Market size and forecast 2025-2030 ($ million)
Data Table on Canada - Market size and forecast 2025-2030 ($ million)
Chart on Canada - Year-over-year growth 2025-2030 (%)
Data Table on Canada - Year-over-year growth 2025-2030 (%)

12.3.3 Mexico - Market size and forecast 2025-2030

Chart on Mexico - Market size and forecast 2025-2030 ($ million)
Data Table on Mexico - Market size and forecast 2025-2030 ($ million)
Chart on Mexico - Year-over-year growth 2025-2030 (%)
Data Table on Mexico - Year-over-year growth 2025-2030 (%)

12.4 Europe - Market size and forecast 2025-2030

Chart on Europe - Market size and forecast 2025-2030 ($ million)
Data Table on Europe - Market size and forecast 2025-2030 ($ million)
Chart on Europe - Year-over-year growth 2025-2030 (%)
Data Table on Europe - Year-over-year growth 2025-2030 (%)
Chart on Regional Comparison - Europe
Data Table on Regional Comparison - Europe

12.4.1 Germany - Market size and forecast 2025-2030

Chart on Germany - Market size and forecast 2025-2030 ($ million)
Data Table on Germany - Market size and forecast 2025-2030 ($ million)
Chart on Germany - Year-over-year growth 2025-2030 (%)
Data Table on Germany - Year-over-year growth 2025-2030 (%)

12.4.2 France - Market size and forecast 2025-2030

Chart on France - Market size and forecast 2025-2030 ($ million)
Data Table on France - Market size and forecast 2025-2030 ($ million)
Chart on France - Year-over-year growth 2025-2030 (%)
Data Table on France - Year-over-year growth 2025-2030 (%)

12.4.3 Italy - Market size and forecast 2025-2030

Chart on Italy - Market size and forecast 2025-2030 ($ million)
Data Table on Italy - Market size and forecast 2025-2030 ($ million)
Chart on Italy - Year-over-year growth 2025-2030 (%)
Data Table on Italy - Year-over-year growth 2025-2030 (%)

12.4.4 UK - Market size and forecast 2025-2030

Chart on UK - Market size and forecast 2025-2030 ($ million)
Data Table on UK - Market size and forecast 2025-2030 ($ million)
Chart on UK - Year-over-year growth 2025-2030 (%)
Data Table on UK - Year-over-year growth 2025-2030 (%)

12.4.5 Spain - Market size and forecast 2025-2030

Chart on Spain - Market size and forecast 2025-2030 ($ million)
Data Table on Spain - Market size and forecast 2025-2030 ($ million)
Chart on Spain - Year-over-year growth 2025-2030 (%)
Data Table on Spain - Year-over-year growth 2025-2030 (%)

12.4.6 The Netherlands - Market size and forecast 2025-2030

Chart on The Netherlands - Market size and forecast 2025-2030 ($ million)
Data Table on The Netherlands - Market size and forecast 2025-2030 ($ million)
Chart on The Netherlands - Year-over-year growth 2025-2030 (%)
Data Table on The Netherlands - Year-over-year growth 2025-2030 (%)

12.5 APAC - Market size and forecast 2025-2030

Chart on APAC - Market size and forecast 2025-2030 ($ million)
Data Table on APAC - Market size and forecast 2025-2030 ($ million)
Chart on APAC - Year-over-year growth 2025-2030 (%)
Data Table on APAC - Year-over-year growth 2025-2030 (%)
Chart on Regional Comparison - APAC
Data Table on Regional Comparison - APAC

12.5.1 China - Market size and forecast 2025-2030

Chart on China - Market size and forecast 2025-2030 ($ million)
Data Table on China - Market size and forecast 2025-2030 ($ million)
Chart on China - Year-over-year growth 2025-2030 (%)
Data Table on China - Year-over-year growth 2025-2030 (%)

12.5.2 Japan - Market size and forecast 2025-2030

Chart on Japan - Market size and forecast 2025-2030 ($ million)
Data Table on Japan - Market size and forecast 2025-2030 ($ million)
Chart on Japan - Year-over-year growth 2025-2030 (%)
Data Table on Japan - Year-over-year growth 2025-2030 (%)

12.5.3 Australia - Market size and forecast 2025-2030

Chart on Australia - Market size and forecast 2025-2030 ($ million)
Data Table on Australia - Market size and forecast 2025-2030 ($ million)
Chart on Australia - Year-over-year growth 2025-2030 (%)
Data Table on Australia - Year-over-year growth 2025-2030 (%)

12.5.4 India - Market size and forecast 2025-2030

Chart on India - Market size and forecast 2025-2030 ($ million)
Data Table on India - Market size and forecast 2025-2030 ($ million)
Chart on India - Year-over-year growth 2025-2030 (%)
Data Table on India - Year-over-year growth 2025-2030 (%)

12.5.5 South Korea - Market size and forecast 2025-2030

Chart on South Korea - Market size and forecast 2025-2030 ($ million)
Data Table on South Korea - Market size and forecast 2025-2030 ($ million)
Chart on South Korea - Year-over-year growth 2025-2030 (%)
Data Table on South Korea - Year-over-year growth 2025-2030 (%)

12.5.6 Indonesia - Market size and forecast 2025-2030

Chart on Indonesia - Market size and forecast 2025-2030 ($ million)
Data Table on Indonesia - Market size and forecast 2025-2030 ($ million)
Chart on Indonesia - Year-over-year growth 2025-2030 (%)
Data Table on Indonesia - Year-over-year growth 2025-2030 (%)

12.6 South America - Market size and forecast 2025-2030

Chart on South America - Market size and forecast 2025-2030 ($ million)
Data Table on South America - Market size and forecast 2025-2030 ($ million)
Chart on South America - Year-over-year growth 2025-2030 (%)
Data Table on South America - Year-over-year growth 2025-2030 (%)
Chart on Regional Comparison - South America
Data Table on Regional Comparison - South America

12.6.1 Brazil - Market size and forecast 2025-2030

Chart on Brazil - Market size and forecast 2025-2030 ($ million)
Data Table on Brazil - Market size and forecast 2025-2030 ($ million)
Chart on Brazil - Year-over-year growth 2025-2030 (%)
Data Table on Brazil - Year-over-year growth 2025-2030 (%)

12.6.2 Argentina - Market size and forecast 2025-2030

Chart on Argentina - Market size and forecast 2025-2030 ($ million)
Data Table on Argentina - Market size and forecast 2025-2030 ($ million)
Chart on Argentina - Year-over-year growth 2025-2030 (%)
Data Table on Argentina - Year-over-year growth 2025-2030 (%)

12.6.3 Chile - Market size and forecast 2025-2030

Chart on Chile - Market size and forecast 2025-2030 ($ million)
Data Table on Chile - Market size and forecast 2025-2030 ($ million)
Chart on Chile - Year-over-year growth 2025-2030 (%)
Data Table on Chile - Year-over-year growth 2025-2030 (%)

12.7 Middle East and Africa - Market size and forecast 2025-2030

Chart on Middle East and Africa - Market size and forecast 2025-2030 ($ million)
Data Table on Middle East and Africa - Market size and forecast 2025-2030 ($ million)
Chart on Middle East and Africa - Year-over-year growth 2025-2030 (%)
Data Table on Middle East and Africa - Year-over-year growth 2025-2030 (%)
Chart on Regional Comparison - Middle East and Africa
Data Table on Regional Comparison - Middle East and Africa

12.7.1 South Africa - Market size and forecast 2025-2030

Chart on South Africa - Market size and forecast 2025-2030 ($ million)
Data Table on South Africa - Market size and forecast 2025-2030 ($ million)
Chart on South Africa - Year-over-year growth 2025-2030 (%)
Data Table on South Africa - Year-over-year growth 2025-2030 (%)

12.7.2 Israel - Market size and forecast 2025-2030

Chart on Israel - Market size and forecast 2025-2030 ($ million)
Data Table on Israel - Market size and forecast 2025-2030 ($ million)
Chart on Israel - Year-over-year growth 2025-2030 (%)
Data Table on Israel - Year-over-year growth 2025-2030 (%)

12.7.3 Turkey - Market size and forecast 2025-2030

Chart on Turkey - Market size and forecast 2025-2030 ($ million)
Data Table on Turkey - Market size and forecast 2025-2030 ($ million)
Chart on Turkey - Year-over-year growth 2025-2030 (%)
Data Table on Turkey - Year-over-year growth 2025-2030 (%)

12.7.4 Saudi Arabia - Market size and forecast 2025-2030

Chart on Saudi Arabia - Market size and forecast 2025-2030 ($ million)
Data Table on Saudi Arabia - Market size and forecast 2025-2030 ($ million)
Chart on Saudi Arabia - Year-over-year growth 2025-2030 (%)
Data Table on Saudi Arabia - Year-over-year growth 2025-2030 (%)

12.7.5 UAE - Market size and forecast 2025-2030

Chart on UAE - Market size and forecast 2025-2030 ($ million)
Data Table on UAE - Market size and forecast 2025-2030 ($ million)
Chart on UAE - Year-over-year growth 2025-2030 (%)
Data Table on UAE - Year-over-year growth 2025-2030 (%)

12.8 Market opportunity by geography

Market opportunity by geography ($ million)
Data Tables on Market opportunity by geography ($ million)

13. Drivers, Challenges, and Opportunity

13.1 Market drivers

Therapeutic standardization accelerates pharmacy network growth
Accelerating consumer demographics expand functional products
Integration of medical marijuana formulations into conventional healthcare systems

13.2 Market challenges

Oversaturation drives severe wholesale price compression
Fragmented regulatory frameworks elevate enterprise compliance
Institutional capital deficits cause exorbitant overhead

13.3 Impact of drivers and challenges

Impact of drivers and challenges in 2025 and 2030

13.4 Market opportunities

Convenience formulations drive product category dominance
Omnichannel digital retail modernizes infrastructure
Institutional mergers accelerate cross border consolidation

14. Competitive Landscape

14.1 Overview

14.2

Overview on criticality of inputs and factors of differentiation

14.3 Landscape disruption

Overview on factors of disruption

14.4 Industry risks

Impact of key risks on business

15. Competitive Analysis

15.1 Companies profiled

Companies covered

15.2 Company ranking index

15.3 Market positioning of companies

Matrix on companies position and classification

15.4 Ascend Wellness Holdings Inc.

Ascend Wellness Holdings Inc. - Overview
Ascend Wellness Holdings Inc. - Business segments
Ascend Wellness Holdings Inc. - Key offerings
Ascend Wellness Holdings Inc. - Segment focus
SWOT

15.5 Aurora Cannabis Inc.

Aurora Cannabis Inc. - Overview
Aurora Cannabis Inc. - Product / Service
Aurora Cannabis Inc. - Key offerings
SWOT

15.6 Bedrocan International B.V.

Bedrocan International B.V. - Overview
Bedrocan International B.V. - Product / Service
Bedrocan International B.V. - Key offerings
SWOT

15.7 Canopy Growth Corp.

Canopy Growth Corp. - Overview
Canopy Growth Corp. - Business segments
Canopy Growth Corp. - Key news
Canopy Growth Corp. - Key offerings
Canopy Growth Corp. - Segment focus
SWOT

15.8 Cresco Labs Inc.

Cresco Labs Inc. - Overview
Cresco Labs Inc. - Product / Service
Cresco Labs Inc. - Key offerings
SWOT

15.9 Cronos Group Inc.

Cronos Group Inc. - Overview
Cronos Group Inc. - Business segments
Cronos Group Inc. - Key offerings
Cronos Group Inc. - Segment focus
SWOT

15.10 Curaleaf Holdings Inc.

Curaleaf Holdings Inc. - Overview
Curaleaf Holdings Inc. - Business segments
Curaleaf Holdings Inc. - Key offerings
Curaleaf Holdings Inc. - Segment focus
SWOT

15.11 CV Sciences Inc.

CV Sciences Inc. - Overview
CV Sciences Inc. - Business segments
CV Sciences Inc. - Key offerings
CV Sciences Inc. - Segment focus
SWOT

15.12 Little Green Pharma Ltd.

Little Green Pharma Ltd. - Overview
Little Green Pharma Ltd. - Product / Service
Little Green Pharma Ltd. - Key offerings
SWOT

15.13 MediPharm Labs Inc.

MediPharm Labs Inc. - Overview
MediPharm Labs Inc. - Product / Service
MediPharm Labs Inc. - Key offerings
SWOT

15.14 Organigram Holdings Inc.

Organigram Holdings Inc. - Overview
Organigram Holdings Inc. - Product / Service
Organigram Holdings Inc. - Key offerings
SWOT

15.15 SNDL Inc.

SNDL Inc. - Overview
SNDL Inc. - Product / Service
SNDL Inc. - Key offerings
SWOT

15.16 Terrascend Canada

Terrascend Canada - Overview
Terrascend Canada - Product / Service
Terrascend Canada - Key offerings
SWOT

15.17 Tilray Brands Inc.

Tilray Brands Inc. - Overview
Tilray Brands Inc. - Business segments
Tilray Brands Inc. - Key offerings
Tilray Brands Inc. - Segment focus
SWOT

15.18 Village Farms International Inc.

Village Farms International Inc. - Overview
Village Farms International Inc. - Business segments
Village Farms International Inc. - Key offerings
Village Farms International Inc. - Segment focus
SWOT

16. Appendix

16.1 Scope of the report

Market definition
Objectives
Notes and caveats

16.2 Inclusions and exclusions checklist

Inclusions checklist
Exclusions checklist

16.3 Currency conversion rates for US$

16.4 Research methodology

16.5 Data procurement

Information sources

16.6 Data validation

16.7 Validation techniques employed for market sizing

16.8 Data synthesis

16.9 360 degree market analysis

16.10 List of abbreviations

Research Methodology

Technavio presents a detailed picture of the market by way of study, synthesis, and summation of data from multiple sources. The analysts have presented the various facets of the market with a particular focus on identifying the key industry influencers. The data thus presented is comprehensive, reliable, and the result of extensive research, both primary and secondary.

INFORMATION SOURCES

Primary sources

  • Manufacturers and suppliers
  • Channel partners
  • Industry experts
  • Strategic decision makers

Secondary sources

  • Industry journals and periodicals
  • Government data
  • Financial reports of key industry players
  • Historical data
  • Press releases

DATA ANALYSIS

Data Synthesis

  • Collation of data
  • Estimation of key figures
  • Analysis of derived insights

Data Validation

  • Triangulation with data models
  • Reference against proprietary databases
  • Corroboration with industry experts

REPORT WRITING

Qualitative

  • Market drivers
  • Market challenges
  • Market trends
  • Five forces analysis

Quantitative

  • Market size and forecast
  • Market segmentation
  • Geographical insights
  • Competitive landscape

Interested in this report?

Get your sample now to see our research methodology and insights!

Download Now

Frequently Asked Questions

Marijuana market growth will increase by USD 167647.9 million during 2026-2030.

The Marijuana market is expected to grow at a CAGR of 36% during 2026-2030.

Marijuana market is segmented by Product (Recreational marijuana, Medical marijuana) Type (Oil and tinctures, Flower) Product type (Dried, Extracts, Infused products, Pharmaceutical formulations)

Ascend Wellness Holdings Inc., Aurora Cannabis Inc., Bedrocan International B.V., Blum Holdings Inc., Canopy Growth Corp., Cresco Labs Inc., Cronos Group Inc., Curaleaf Holdings Inc., CV Sciences Inc., Little Green Pharma Ltd., Medical Marijuana Inc., MediPharm Labs Inc., Organigram Holdings Inc., SNDL Inc., Terrascend Canada, Tilray Brands Inc., Trulieve Cannabis Corp., Verano Holdings LLC, Village Farms International Inc. are a few of the key vendors in the Marijuana market.

North America will register the highest growth rate of 86.8% among the other regions. Therefore, the Marijuana market in North America is expected to garner significant business opportunities for the vendors during the forecast period.

US, Canada, Mexico, Germany, France, Italy, UK, Spain, The Netherlands, China, Japan, Australia, India, South Korea, Indonesia, Brazil, Argentina, Chile, South Africa, Israel, Turkey, Saudi Arabia, UAE

  • Therapeutic standardization accelerates pharmacy network growth is the driving factor this market.

The Marijuana market vendors should focus on grabbing business opportunities from the Product segment as it accounted for the largest market share in the base year.
RIA - Research AI Assistant
Ask RIA
