Marine Power Systems Market Analysis APAC, Europe, North America, South America, Middle East and Africa - China, US, Germany, South Korea, Japan - Size and Forecast 2024-2028

Marine Power Systems Market Analysis APAC, Europe, North America, South America, Middle East and Africa - China, US, Germany, South Korea, Japan - Size and Forecast 2024-2028

Published: Jul 2024 196 Pages SKU: IRTNTR74303

Market Overview at a Glance

$3.42 B
Market Opportunity
3.49%
CAGR
3.32
YoY growth 2023-2024(%)

Marine Power Systems Market Size 2024-2028

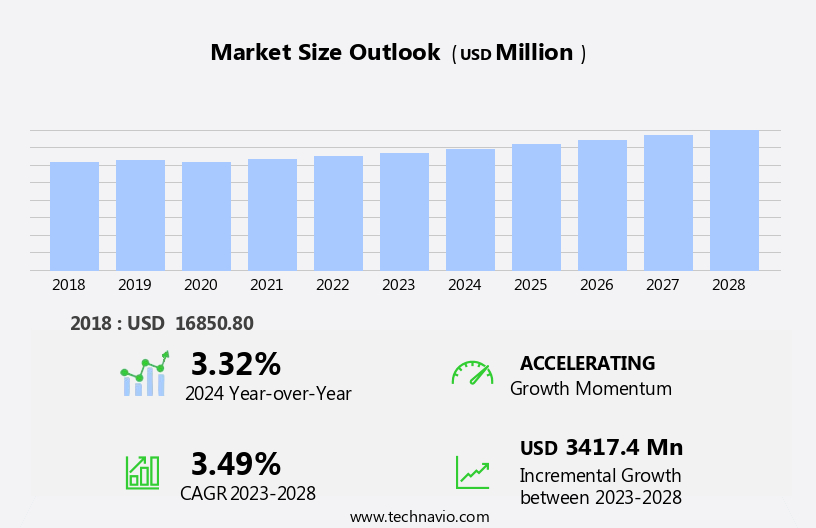
The marine power systems market size is forecast to increase by USD 3.42 billion, at a CAGR of 3.49% between 2023 and 2028.

  • The market is experiencing significant growth, driven primarily by the surge in commercial shipping and the expanding marine hybrid propulsion market. These trends reflect the increasing demand for more fuel-efficient and environmentally friendly solutions in the maritime industry. However, the collapse of the Greek shipbuilding industry poses a considerable challenge. This obstacle, as stated, could potentially impact the market's growth trajectory due to the industry's historical significance as a major player in marine power systems production. Companies seeking to capitalize on market opportunities must navigate this challenge by exploring alternative production hubs and partnerships.
  • Additionally, investing in research and development of advanced, cost-effective marine power systems will be crucial for long-term success. Overall, the market presents a dynamic and promising landscape, with opportunities for innovation and growth in the face of industry challenges. Companies that effectively address these challenges and capitalize on market trends will be well-positioned to succeed.

What will be the Size of the Marine Power Systems Market during the forecast period?

Marine Power Systems Market Size

Explore in-depth regional segment analysis with market size data - historical 2018-2022 and forecasts 2024-2028 - in the full report.  
Request Free Sample

The market continues to evolve, driven by advancements in technology and shifting market dynamics. Recreational marine applications, for instance, are witnessing significant growth as consumers seek more efficient and eco-friendly propulsion options. Sterndrive units and inboard engines are being gradually replaced by electric propulsion systems, which offer improved fuel efficiency and reduced emissions. Simultaneously, the commercial marine sector is exploring hybrid propulsion solutions to optimize performance and reduce operational costs. Hull design innovations are also gaining traction, with autonomous navigation and remote control systems becoming increasingly common. Control systems, marine electronics, and engine management systems are essential components of modern marine propulsion systems.

Fuel injection systems play a crucial role in enhancing fuel efficiency, while emissions regulations drive the demand for advanced emissions reduction technologies. Marine insurance, finance, and services are integral to the marine industry, providing essential support to boat dealerships and marine engineering firms. Spare parts and marine technology are also key areas of focus, as the industry strives to maintain optimal performance and ensure the longevity of marine assets. Fishing vessels and diesel engines continue to dominate the commercial marine sector, with ongoing research and development efforts aimed at enhancing their efficiency and sustainability. The market for marine power systems is characterized by continuous innovation and adaptation to meet the evolving needs of various sectors.

How is this Marine Power Systems Industry segmented?

The marine power systems industry research report provides comprehensive data (region-wise segment analysis), with forecasts and estimates in "USD million" for the period 2024-2028, as well as historical data from 2018-2022 for the following segments.

  • Type
    • Internal lighting
    • Navigation lighting
    • Surveillance systems
    • Engine control
    • Others
  • End-user
    • Commercial ships
    • Military vessel
    • Underwater vehicle
    • Leisure ships
    • Small recreational boats
  • Geography
    • North America
      • US
    • Europe
      • Germany
    • APAC
      • China
      • Japan
      • South Korea
    • Rest of World (ROW)

    By Type Insights

    The internal lighting segment is estimated to witness significant growth during the forecast period.

    In the dynamic the market, various segments contribute to the industry's growth and innovation. One such segment is the internal lighting systems, which play a crucial role in enhancing the functionality and aesthetics of marine vessels. These systems are integral to illuminating the interiors of ships, boats, and marine structures, catering to diverse lighting needs. LED lighting is a prominent technology in marine applications due to its energy efficiency, durability, and extended lifespan. It is used extensively for general illumination, task lighting, accent lighting, and decorative purposes within marine vessels. Navigation systems, marine electronics, and engine management systems often rely on LED lighting for clear visibility and optimal performance.

    Marine construction companies integrate these lighting systems during the building process, ensuring compliance with emissions regulations and enhancing fuel efficiency. Marine insurance providers consider well-lit interiors as a safety feature, potentially impacting insurance premiums. Fishing vessels, commercial marine, and recreational marine applications all benefit from advanced internal lighting systems. Furthermore, performance optimization and hybrid propulsion systems can be complemented by intelligent data analytics and remote control capabilities, which can be integrated into internal lighting systems for added functionality. Spare parts suppliers and boat dealerships offer replacement and maintenance services for these lighting systems, ensuring the longevity and reliability of marine vessels.

    In summary, the internal lighting segment in the market showcases the integration of various technologies and applications, driving innovation and growth within the industry.

    Marine Power Systems Market Size

    Request Free Sample

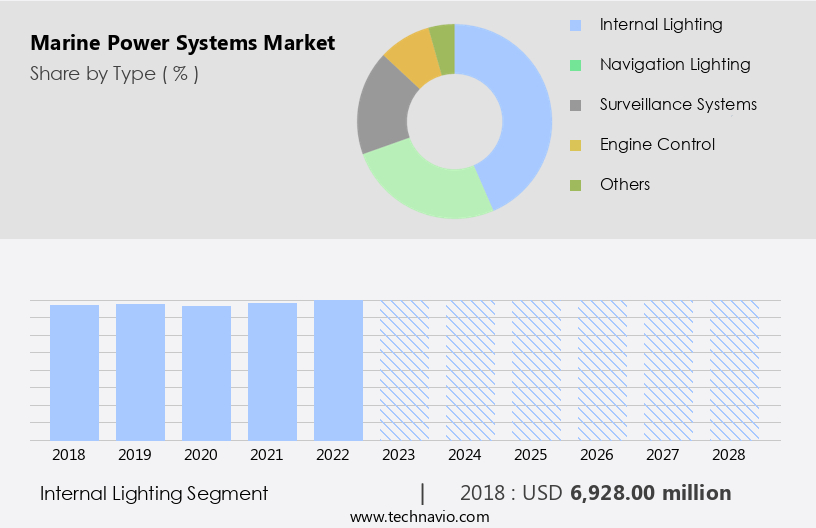
    The Internal lighting segment was valued at USD 6.93 billion in 2018 and showed a gradual increase during the forecast period.

    Regional Analysis

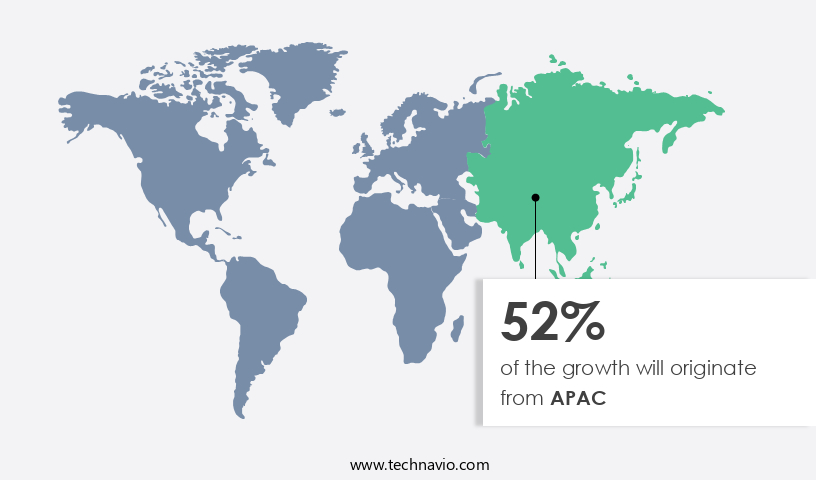
    APAC is estimated to contribute 52% to the growth of the global market during the forecast period.Technavio’s analysts have elaborately explained the regional trends and drivers that shape the market during the forecast period.

    Marine Power Systems Market Share by Geography

     Request Free Sample

    The maritime industry, a key facilitator of global trade, has seen significant growth due to the increasing demand for transporting raw materials and finished goods between Asia and Europe. This long-standing shipping route has witnessed the evolution of larger container ships, enabling mass production to shift towards Asia due to cost advantages. However, this growth has led to an escalating demand for new marine vessels, particularly container ships and tankers, to transport oil, natural gas, and mineral ores. Control systems, outboard motors, and navigation systems are essential components in the construction of these new marine vessels. Marine insurance, a crucial aspect of maritime commerce, ensures financial protection against potential risks.

    Marine electronics, including performance optimization systems and fuel efficiency technologies, contribute to enhancing the efficiency and productivity of these vessels. Marine finance, emissions regulations, and marine services facilitate the acquisition and operation of these new vessels. Hybrid propulsion systems, marine engineering, and spare parts are integral to the maintenance and upkeep of these vessels. Fuel injection systems, marine propulsion systems, and engine management systems ensure optimal performance and fuel efficiency. Fishing vessels, diesel engines, and marine technology are essential components of the recreational marine sector, while commercial marine operations rely on sterndrive units, inboard engines, electric propulsion, and gasoline engines.

    Hull design, autonomous navigation, and remote control systems are the latest advancements in marine technology, revolutionizing the industry. Marine construction, marine engineering, and boat dealerships are integral to the maritime industry's growth, providing the necessary infrastructure and services for the design, manufacturing, and sale of marine vessels. Data analytics and steering systems enable efficient operations and improved safety, while emissions regulations ensure environmental sustainability.

    Market Dynamics

    Our researchers analyzed the data with 2023 as the base year, along with the key drivers, trends, and challenges. A holistic analysis of drivers will help companies refine their marketing strategies to gain a competitive advantage.

    What are the key market drivers leading to the rise in the adoption of Marine Power Systems Industry?

    • The surge in commercial shipping activity serves as the primary market driver. 

    • The marine industry is experiencing growth due to the expanding global economy and increasing global trade volumes. Maritime transportation plays a significant role in the transportation of goods between different regions, primarily in the form of containers. This trend is driven by the global demand and supply of commodities and manufactured goods. Marine technology, including engine management systems for diesel engines, is essential to the efficient operation of fishing vessels and commercial marine applications. The marine engineering sector is focused on the design, development, and implementation of advanced technology to enhance the performance and reduce the environmental impact of marine vessels.
    • Spare parts and maintenance are critical components of the marine industry, ensuring the continuous operation of boats and ship fleets. Boat dealerships play a vital role in the distribution and sales of marine technology and vessels. The marine industry's growth is expected to continue as global economic expansion and development create new opportunities for marine technology and commercial marine applications.

    What are the market trends shaping the Marine Power Systems Industry?

    • The marine hybrid propulsion market is experiencing significant growth and is currently a notable trend in the maritime industry. This market's expansion is driven by the increasing demand for more fuel-efficient and environmentally friendly solutions for marine transportation.

    • The market is experiencing significant growth due to the increasing adoption of advanced propulsion systems in both recreational and commercial marine applications. Traditional gasoline engines and inboard engines are being replaced by more efficient and eco-friendly options, such as electric propulsion and hybrid systems. This shift is driven by stricter emission regulations, with authorities and major ports worldwide implementing guidelines to reduce pollution from marine vessels. For instance, the International Maritime Organization (IMO) introduced new regulations on ships' emissions in 2015, primarily affecting coastal regions in Europe and North America.
    • These areas are witnessing substantial developments in the market as shipping operators comply with the new emission standards. Another trend gaining traction is the integration of autonomous navigation and remote control systems, which enhance the overall efficiency and safety of marine vessels. In conclusion, the market is undergoing transformative changes, with a focus on sustainable and technologically advanced solutions.

    What challenges does the Marine Power Systems Industry face during its growth?

    • The collapse of Greece's shipbuilding industry poses a significant challenge to the industry's growth trajectory. 

    • The Eurozone crisis of 2009 significantly affected the European shipbuilding industry, particularly in Greece, which has historically been a major player in the global shipping trade. The sector was hit hard by the crisis, with surging borrowing costs and austerity measures resulting in a profound and long-term economic impact. For instance, Perama, a city on the Saronic Gulf in Greece, which relies heavily on the adjacent shipping port of Piraeus, experienced significant economic downturn. Despite these challenges, the marine industry is making a comeback, driven by advancements in technology and changing market dynamics. Control systems, outboard motors, navigation systems, marine insurance, marine electronics, marine construction, performance optimization, and hybrid propulsion are some of the key areas witnessing growth.
    • These technologies are enabling better efficiency, safety, and sustainability in marine operations. Moreover, the increasing demand for marine transportation and the need for cost-effective and eco-friendly solutions are further fueling the growth of the marine industry. The market is expected to continue its upward trajectory, driven by these trends and the gradual recovery of the global economy.

    Exclusive Customer Landscape

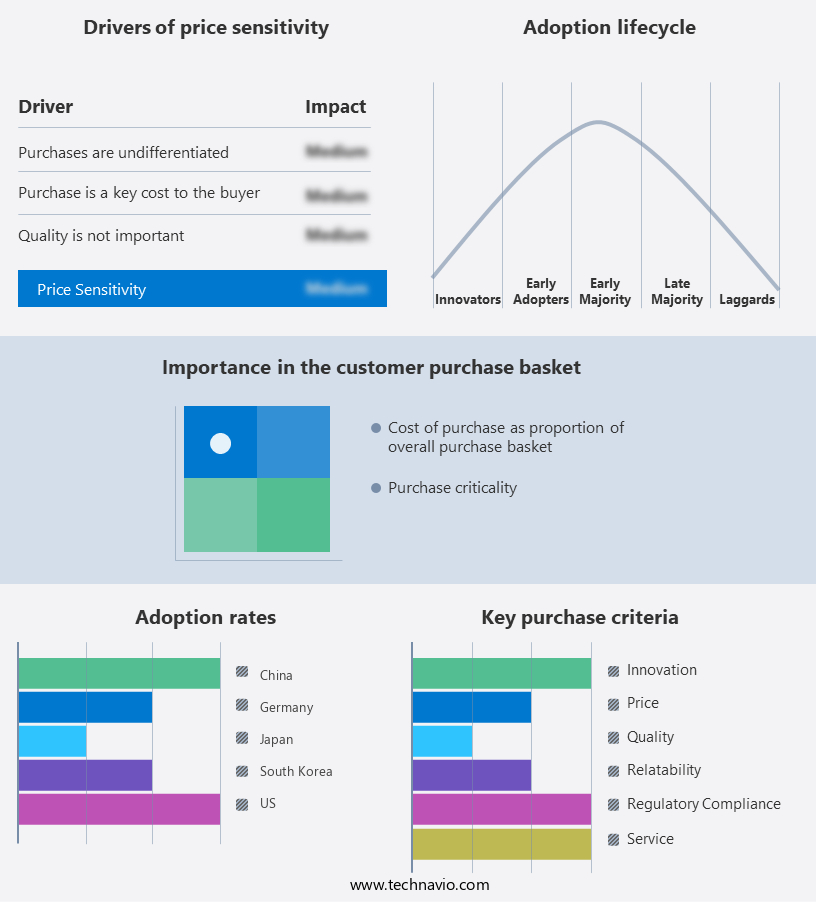
    The marine power systems market forecasting report includes the adoption lifecycle of the market, covering from the innovator’s stage to the laggard’s stage. It focuses on adoption rates in different regions based on penetration. Furthermore, the marine power systems market report also includes key purchase criteria and drivers of price sensitivity to help companies evaluate and develop their market growth analysis strategies.

    Marine Power Systems Market Share by Geography

     Customer Landscape

    Key Companies & Market Insights

    Companies are implementing various strategies, such as strategic alliances, marine power systems market forecast, partnerships, mergers and acquisitions, geographical expansion, and product/service launches, to enhance their presence in the industry.

    AB Volvo - Volvo Penta, a leading marine power systems subsidiary, delivers innovative solutions through its D1 Inboard Engine, D2 Saildrive, and D6 Inboard Engine product lines. These engines are renowned for their efficiency, reliability, and low emissions. Volvo Penta's commitment to advanced technology and sustainable power systems sets it apart in the marine industry. By continuously pushing the boundaries of engineering, Volvo Penta empowers customers to explore the world with confidence and minimal environmental impact.

    The industry research and growth report includes detailed analyses of the competitive landscape of the market and information about key companies, including:

    • AB Volvo
    • Atlas Marine Systems
    • Caterpillar Inc.
    • Cummins Inc.
    • Daihatsu Diesel Mfg. Co. Ltd.
    • ENAG SAS
    • EnerSys
    • Enpro Inc.
    • General Electric Co.
    • Hydraulic Marine Systems Inc.
    • Hyundai Electric and Energy Systems Co. Ltd.
    • Ingeteam Corp. S.A.
    • MAN Energy Solutions SE
    • Mitsubishi Heavy Industries Ltd.
    • NEWMAR
    • Perkins Engines Co. Ltd.
    • Rolls Royce Holdings Plc
    • Siemens AG
    • Wartsila Corp.
    • Yamaha Corp.

    Qualitative and quantitative analysis of companies has been conducted to help clients understand the wider business environment as well as the strengths and weaknesses of key industry players. Data is qualitatively analyzed to categorize companies as pure play, category-focused, industry-focused, and diversified; it is quantitatively analyzed to categorize companies as dominant, leading, strong, tentative, and weak.

    Recent Development and News in Marine Power Systems Market

    • In February 2023, Wave Energy Technologies, a leading marine power systems provider, announced the launch of their new WaveStar 1000, a next-generation wave energy converter. This innovative device is designed to deliver up to 1 MW of continuous power, making it one of the most powerful wave energy systems in the market (Wave Energy Technologies Press Release).
    • In March 2024, Siemens Gamesa Renewable Energy and Mitsui & Co. Ltd. Formed a strategic partnership to jointly develop floating wind and wave energy projects. This collaboration combines Siemens Gamesa's expertise in renewable energy technology with Mitsui's experience in project development and financing (Siemens Gamesa Renewable Energy Press Release).
    • In May 2024, Carbon Clean Solutions, an Indian clean technology company, raised USD50 million in a Series C funding round. A significant portion of the investment will be allocated towards the development of their marine carbon capture, utilization, and storage (CCUS) technology (Business Wire).
    • In October 2025, the European Union approved the Horizon Europe research and innovation program, which includes a €2.4 billion investment in ocean energy technologies. This funding will support the development and deployment of marine power systems, including wave, tidal, and offshore wind energy technologies (European Commission Press Release).

    Research Analyst Overview

    • The market encompasses various technologies and components, including fuel cell technology, exhaust systems, hull materials, marine robotics, engine cooling systems, radar systems, underwater vehicles, propeller design, composite materials, sonar systems, AIS transponders, marine batteries, fuel tank systems, corrosion protection, offshore wind power, marine lubricants, anti-fouling coatings, shaft materials, marine renewable energy, vibration damping, environmental impact, engine noise reduction, GPS navigation, and biodegradable fuels. Fuel cell technology is gaining traction as a clean energy alternative for marine applications. Exhaust systems are being redesigned to reduce emissions and improve fuel efficiency. Hull materials, such as composite materials, are being used to enhance durability and reduce weight.
    • Marine robotics and underwater vehicles are revolutionizing underwater inspections and maintenance, while radar systems and sonar systems provide enhanced situational awareness. Propeller design and engine cooling systems optimize performance and reduce fuel consumption. Corrosion protection and anti-fouling coatings extend the life of marine structures and reduce maintenance costs. Offshore wind power and marine renewable energy are growing sectors, with fuel tank systems and marine batteries essential for energy storage. Vibration damping and environmental impact reduction are key considerations in marine engineering. Engine noise reduction and GPS navigation enhance safety and comfort. Biodegradable fuels are a sustainable alternative to traditional fossil fuels.
    • Marine lubricants and shaft materials ensure efficient and reliable power transmission, while AIS transponders and GPS navigation enable real-time tracking and communication. Overall, the market is dynamic, with ongoing innovation and trends focused on sustainability, efficiency, and safety.

    Dive into Technavio’s robust research methodology, blending expert interviews, extensive data synthesis, and validated models for unparalleled Marine Power Systems Market insights. See full methodology.

    Market Scope

    Report Coverage

    Details

    Page number

    196

    Base year

    2023

    Historic period

    2018-2022

    Forecast period

    2024-2028

    Growth momentum & CAGR

    Accelerate at a CAGR of 3.49%

    Market growth 2024-2028

    USD 3417.4 million

    Market structure

    Fragmented

    YoY growth 2023-2024(%)

    3.32

    Key countries

    China, US, Germany, South Korea, and Japan

    Competitive landscape

    Leading Companies, Market Positioning of Companies, Competitive Strategies, and Industry Risks

    Request Free Sample

    What are the Key Data Covered in this Marine Power Systems Market Research and Growth Report?

    • CAGR of the Marine Power Systems industry during the forecast period
    • Detailed information on factors that will drive the growth and forecasting between 2024 and 2028
    • Precise estimation of the size of the market and its contribution of the industry in focus to the parent market
    • Accurate predictions about upcoming growth and trends and changes in consumer behaviour
    • Growth of the market across APAC, Europe, North America, South America, and Middle East and Africa
    • Thorough analysis of the market’s competitive landscape and detailed information about companies
    • Comprehensive analysis of factors that will challenge the marine power systems market growth of industry companies

    We can help! Our analysts can customize this marine power systems market research report to meet your requirements.

    Get in touch


    1 Executive Summary

    • 1.1 Market overview
      • Executive Summary - Chart on Market Overview
      • Executive Summary - Data Table on Market Overview
      • Executive Summary - Chart on Global Market Characteristics
      • Executive Summary - Chart on Market by Geography
      • Executive Summary - Chart on Market Segmentation by Type
      • Executive Summary - Chart on Market Segmentation by End-user
      • Executive Summary - Chart on Incremental Growth
      • Executive Summary - Data Table on Incremental Growth
      • Executive Summary - Chart on Company Market Positioning

    2 Market Landscape

    • 2.1 Market ecosystem
      • Parent Market
      • Data Table on - Parent Market
    • 2.2 Market characteristics
      • Market characteristics analysis
    • 2.3 Value chain analysis
      • Value Chain Analysis

    3 Market Sizing

    • 3.1 Market definition
      • Offerings of companies included in the market definition
    • 3.2 Market segment analysis
      • Market segments
    • 3.3 Market size 2023
      • 3.4 Market outlook: Forecast for 2023-2028
        • Chart on Global - Market size and forecast 2023-2028 ($ million)
        • Data Table on Global - Market size and forecast 2023-2028 ($ million)
        • Chart on Global Market: Year-over-year growth 2023-2028 (%)
        • Data Table on Global Market: Year-over-year growth 2023-2028 (%)

      4 Historic Market Size

      • 4.1 Global Marine Power Systems Market 2018 - 2022
        • Historic Market Size - Data Table on Global Marine Power Systems Market 2018 - 2022 ($ million)
      • 4.2 Type segment analysis 2018 - 2022
        • Historic Market Size - Type Segment 2018 - 2022 ($ million)
      • 4.3 End-user segment analysis 2018 - 2022
        • Historic Market Size - End-user Segment 2018 - 2022 ($ million)
      • 4.4 Geography segment analysis 2018 - 2022
        • Historic Market Size - Geography Segment 2018 - 2022 ($ million)
      • 4.5 Country segment analysis 2018 - 2022
        • Historic Market Size - Country Segment 2018 - 2022 ($ million)

      5 Five Forces Analysis

      • 5.1 Five forces summary
        • Five forces analysis - Comparison between 2023 and 2028
      • 5.2 Bargaining power of buyers
        • Bargaining power of buyers - Impact of key factors 2023 and 2028
      • 5.3 Bargaining power of suppliers
        • Bargaining power of suppliers - Impact of key factors in 2023 and 2028
      • 5.4 Threat of new entrants
        • Threat of new entrants - Impact of key factors in 2023 and 2028
      • 5.5 Threat of substitutes
        • Threat of substitutes - Impact of key factors in 2023 and 2028
      • 5.6 Threat of rivalry
        • Threat of rivalry - Impact of key factors in 2023 and 2028
      • 5.7 Market condition
        • Chart on Market condition - Five forces 2023 and 2028

      6 Market Segmentation by Type

      • 6.1 Market segments
        • Chart on Type - Market share 2023-2028 (%)
        • Data Table on Type - Market share 2023-2028 (%)
      • 6.2 Comparison by Type
        • Chart on Comparison by Type
        • Data Table on Comparison by Type
      • 6.3 Internal lighting - Market size and forecast 2023-2028
        • Chart on Internal lighting - Market size and forecast 2023-2028 ($ million)
        • Data Table on Internal lighting - Market size and forecast 2023-2028 ($ million)
        • Chart on Internal lighting - Year-over-year growth 2023-2028 (%)
        • Data Table on Internal lighting - Year-over-year growth 2023-2028 (%)
      • 6.4 Navigation lighting - Market size and forecast 2023-2028
        • Chart on Navigation lighting - Market size and forecast 2023-2028 ($ million)
        • Data Table on Navigation lighting - Market size and forecast 2023-2028 ($ million)
        • Chart on Navigation lighting - Year-over-year growth 2023-2028 (%)
        • Data Table on Navigation lighting - Year-over-year growth 2023-2028 (%)
      • 6.5 Surveillance systems - Market size and forecast 2023-2028
        • Chart on Surveillance systems - Market size and forecast 2023-2028 ($ million)
        • Data Table on Surveillance systems - Market size and forecast 2023-2028 ($ million)
        • Chart on Surveillance systems - Year-over-year growth 2023-2028 (%)
        • Data Table on Surveillance systems - Year-over-year growth 2023-2028 (%)
      • 6.6 Engine control - Market size and forecast 2023-2028
        • Chart on Engine control - Market size and forecast 2023-2028 ($ million)
        • Data Table on Engine control - Market size and forecast 2023-2028 ($ million)
        • Chart on Engine control - Year-over-year growth 2023-2028 (%)
        • Data Table on Engine control - Year-over-year growth 2023-2028 (%)
      • 6.7 Others - Market size and forecast 2023-2028
        • Chart on Others - Market size and forecast 2023-2028 ($ million)
        • Data Table on Others - Market size and forecast 2023-2028 ($ million)
        • Chart on Others - Year-over-year growth 2023-2028 (%)
        • Data Table on Others - Year-over-year growth 2023-2028 (%)
      • 6.8 Market opportunity by Type
        • Market opportunity by Type ($ million)
        • Data Table on Market opportunity by Type ($ million)

      7 Market Segmentation by End-user

      • 7.1 Market segments
        • Chart on End-user - Market share 2023-2028 (%)
        • Data Table on End-user - Market share 2023-2028 (%)
      • 7.2 Comparison by End-user
        • Chart on Comparison by End-user
        • Data Table on Comparison by End-user
      • 7.3 Commercial ships - Market size and forecast 2023-2028
        • Chart on Commercial ships - Market size and forecast 2023-2028 ($ million)
        • Data Table on Commercial ships - Market size and forecast 2023-2028 ($ million)
        • Chart on Commercial ships - Year-over-year growth 2023-2028 (%)
        • Data Table on Commercial ships - Year-over-year growth 2023-2028 (%)
      • 7.4 Military vessel - Market size and forecast 2023-2028
        • Chart on Military vessel - Market size and forecast 2023-2028 ($ million)
        • Data Table on Military vessel - Market size and forecast 2023-2028 ($ million)
        • Chart on Military vessel - Year-over-year growth 2023-2028 (%)
        • Data Table on Military vessel - Year-over-year growth 2023-2028 (%)
      • 7.5 Underwater vehicle - Market size and forecast 2023-2028
        • Chart on Underwater vehicle - Market size and forecast 2023-2028 ($ million)
        • Data Table on Underwater vehicle - Market size and forecast 2023-2028 ($ million)
        • Chart on Underwater vehicle - Year-over-year growth 2023-2028 (%)
        • Data Table on Underwater vehicle - Year-over-year growth 2023-2028 (%)
      • 7.6 Leisure ships - Market size and forecast 2023-2028
        • Chart on Leisure ships - Market size and forecast 2023-2028 ($ million)
        • Data Table on Leisure ships - Market size and forecast 2023-2028 ($ million)
        • Chart on Leisure ships - Year-over-year growth 2023-2028 (%)
        • Data Table on Leisure ships - Year-over-year growth 2023-2028 (%)
      • 7.7 Small recreational boats - Market size and forecast 2023-2028
        • Chart on Small recreational boats - Market size and forecast 2023-2028 ($ million)
        • Data Table on Small recreational boats - Market size and forecast 2023-2028 ($ million)
        • Chart on Small recreational boats - Year-over-year growth 2023-2028 (%)
        • Data Table on Small recreational boats - Year-over-year growth 2023-2028 (%)
      • 7.8 Market opportunity by End-user
        • Market opportunity by End-user ($ million)
        • Data Table on Market opportunity by End-user ($ million)

      8 Customer Landscape

      • 8.1 Customer landscape overview
        • Analysis of price sensitivity, lifecycle, customer purchase basket, adoption rates, and purchase criteria

      9 Geographic Landscape

      • 9.1 Geographic segmentation
        • Chart on Market share by geography 2023-2028 (%)
        • Data Table on Market share by geography 2023-2028 (%)
      • 9.2 Geographic comparison
        • Chart on Geographic comparison
        • Data Table on Geographic comparison
      • 9.3 APAC - Market size and forecast 2023-2028
        • Chart on APAC - Market size and forecast 2023-2028 ($ million)
        • Data Table on APAC - Market size and forecast 2023-2028 ($ million)
        • Chart on APAC - Year-over-year growth 2023-2028 (%)
        • Data Table on APAC - Year-over-year growth 2023-2028 (%)
      • 9.4 Europe - Market size and forecast 2023-2028
        • Chart on Europe - Market size and forecast 2023-2028 ($ million)
        • Data Table on Europe - Market size and forecast 2023-2028 ($ million)
        • Chart on Europe - Year-over-year growth 2023-2028 (%)
        • Data Table on Europe - Year-over-year growth 2023-2028 (%)
      • 9.5 North America - Market size and forecast 2023-2028
        • Chart on North America - Market size and forecast 2023-2028 ($ million)
        • Data Table on North America - Market size and forecast 2023-2028 ($ million)
        • Chart on North America - Year-over-year growth 2023-2028 (%)
        • Data Table on North America - Year-over-year growth 2023-2028 (%)
      • 9.6 South America - Market size and forecast 2023-2028
        • Chart on South America - Market size and forecast 2023-2028 ($ million)
        • Data Table on South America - Market size and forecast 2023-2028 ($ million)
        • Chart on South America - Year-over-year growth 2023-2028 (%)
        • Data Table on South America - Year-over-year growth 2023-2028 (%)
      • 9.7 Middle East and Africa - Market size and forecast 2023-2028
        • Chart on Middle East and Africa - Market size and forecast 2023-2028 ($ million)
        • Data Table on Middle East and Africa - Market size and forecast 2023-2028 ($ million)
        • Chart on Middle East and Africa - Year-over-year growth 2023-2028 (%)
        • Data Table on Middle East and Africa - Year-over-year growth 2023-2028 (%)
      • 9.8 China - Market size and forecast 2023-2028
        • Chart on China - Market size and forecast 2023-2028 ($ million)
        • Data Table on China - Market size and forecast 2023-2028 ($ million)
        • Chart on China - Year-over-year growth 2023-2028 (%)
        • Data Table on China - Year-over-year growth 2023-2028 (%)
      • 9.9 US - Market size and forecast 2023-2028
        • Chart on US - Market size and forecast 2023-2028 ($ million)
        • Data Table on US - Market size and forecast 2023-2028 ($ million)
        • Chart on US - Year-over-year growth 2023-2028 (%)
        • Data Table on US - Year-over-year growth 2023-2028 (%)
      • 9.10 Germany - Market size and forecast 2023-2028
        • Chart on Germany - Market size and forecast 2023-2028 ($ million)
        • Data Table on Germany - Market size and forecast 2023-2028 ($ million)
        • Chart on Germany - Year-over-year growth 2023-2028 (%)
        • Data Table on Germany - Year-over-year growth 2023-2028 (%)
      • 9.11 South Korea - Market size and forecast 2023-2028
        • Chart on South Korea - Market size and forecast 2023-2028 ($ million)
        • Data Table on South Korea - Market size and forecast 2023-2028 ($ million)
        • Chart on South Korea - Year-over-year growth 2023-2028 (%)
        • Data Table on South Korea - Year-over-year growth 2023-2028 (%)
      • 9.12 Japan - Market size and forecast 2023-2028
        • Chart on Japan - Market size and forecast 2023-2028 ($ million)
        • Data Table on Japan - Market size and forecast 2023-2028 ($ million)
        • Chart on Japan - Year-over-year growth 2023-2028 (%)
        • Data Table on Japan - Year-over-year growth 2023-2028 (%)
      • 9.13 Market opportunity by geography
        • Market opportunity by geography ($ million)
        • Data Tables on Market opportunity by geography ($ million)

      10 Drivers, Challenges, and Opportunity/Restraints

      • 10.1 Market drivers
        • 10.2 Market challenges
          • 10.3 Impact of drivers and challenges
            • Impact of drivers and challenges in 2023 and 2028
          • 10.4 Market opportunities/restraints

            11 Competitive Landscape

            • 11.1 Overview
              • 11.2 Competitive Landscape
                • Overview on criticality of inputs and factors of differentiation
              • 11.3 Landscape disruption
                • Overview on factors of disruption
              • 11.4 Industry risks
                • Impact of key risks on business

              12 Competitive Analysis

              • 12.1 Companies profiled
                • Companies covered
              • 12.2 Market positioning of companies
                • Matrix on companies position and classification
              • 12.3 AB Volvo
                • AB Volvo - Overview
                • AB Volvo - Business segments
                • AB Volvo - Key news
                • AB Volvo - Key offerings
                • AB Volvo - Segment focus
              • 12.4 Atlas Marine Systems
                • Atlas Marine Systems - Overview
                • Atlas Marine Systems - Product / Service
                • Atlas Marine Systems - Key offerings
              • 12.5 Caterpillar Inc.
                • Caterpillar Inc. - Overview
                • Caterpillar Inc. - Business segments
                • Caterpillar Inc. - Key news
                • Caterpillar Inc. - Key offerings
                • Caterpillar Inc. - Segment focus
              • 12.6 Cummins Inc.
                • Cummins Inc. - Overview
                • Cummins Inc. - Business segments
                • Cummins Inc. - Key news
                • Cummins Inc. - Key offerings
                • Cummins Inc. - Segment focus
              • 12.7 Daihatsu Diesel Mfg. Co. Ltd.
                • Daihatsu Diesel Mfg. Co. Ltd. - Overview
                • Daihatsu Diesel Mfg. Co. Ltd. - Business segments
                • Daihatsu Diesel Mfg. Co. Ltd. - Key news
                • Daihatsu Diesel Mfg. Co. Ltd. - Key offerings
                • Daihatsu Diesel Mfg. Co. Ltd. - Segment focus
              • 12.8 EnerSys
                • EnerSys - Overview
                • EnerSys - Business segments
                • EnerSys - Key news
                • EnerSys - Key offerings
                • EnerSys - Segment focus
              • 12.9 Enpro Inc.
                • Enpro Inc. - Overview
                • Enpro Inc. - Business segments
                • Enpro Inc. - Key news
                • Enpro Inc. - Key offerings
                • Enpro Inc. - Segment focus
              • 12.10 General Electric Co.
                • General Electric Co. - Overview
                • General Electric Co. - Business segments
                • General Electric Co. - Key news
                • General Electric Co. - Key offerings
                • General Electric Co. - Segment focus
              • 12.11 Hydraulic Marine Systems Inc.
                • Hydraulic Marine Systems Inc. - Overview
                • Hydraulic Marine Systems Inc. - Product / Service
                • Hydraulic Marine Systems Inc. - Key offerings
              • 12.12 Hyundai Electric and Energy Systems Co. Ltd.
                • Hyundai Electric and Energy Systems Co. Ltd. - Overview
                • Hyundai Electric and Energy Systems Co. Ltd. - Product / Service
                • Hyundai Electric and Energy Systems Co. Ltd. - Key offerings
              • 12.13 Ingeteam Corp. S.A.
                • Ingeteam Corp. S.A. - Overview
                • Ingeteam Corp. S.A. - Product / Service
                • Ingeteam Corp. S.A. - Key offerings
              • 12.14 MAN Energy Solutions SE
                • MAN Energy Solutions SE - Overview
                • MAN Energy Solutions SE - Product / Service
                • MAN Energy Solutions SE - Key offerings
              • 12.15 Mitsubishi Heavy Industries Ltd.
                • Mitsubishi Heavy Industries Ltd. - Overview
                • Mitsubishi Heavy Industries Ltd. - Business segments
                • Mitsubishi Heavy Industries Ltd. - Key news
                • Mitsubishi Heavy Industries Ltd. - Key offerings
                • Mitsubishi Heavy Industries Ltd. - Segment focus
              • 12.16 NEWMAR
                • NEWMAR - Overview
                • NEWMAR - Product / Service
                • NEWMAR - Key offerings
              • 12.17 Perkins Engines Co. Ltd.
                • Perkins Engines Co. Ltd. - Overview
                • Perkins Engines Co. Ltd. - Product / Service
                • Perkins Engines Co. Ltd. - Key offerings

              13 Appendix

              • 13.1 Scope of the report
                • 13.2 Inclusions and exclusions checklist
                  • Inclusions checklist
                  • Exclusions checklist
                • 13.3 Currency conversion rates for US$
                  • Currency conversion rates for US$
                • 13.4 Research methodology
                  • Research methodology
                • 13.5 Data procurement
                  • Information sources
                • 13.6 Data validation
                  • Data validation
                • 13.7 Validation techniques employed for market sizing
                  • Validation techniques employed for market sizing
                • 13.8 Data synthesis
                  • Data synthesis
                • 13.8 360 degree market analysis
                  • 360 degree market analysis
                • 13.10 List of abbreviations
                  • List of abbreviations

                Research Methodology

                Technavio presents a detailed picture of the market by way of study, synthesis, and summation of data from multiple sources. The analysts have presented the various facets of the market with a particular focus on identifying the key industry influencers. The data thus presented is comprehensive, reliable, and the result of extensive research, both primary and secondary.

                INFORMATION SOURCES

                Primary sources

                • Manufacturers and suppliers
                • Channel partners
                • Industry experts
                • Strategic decision makers

                Secondary sources

                • Industry journals and periodicals
                • Government data
                • Financial reports of key industry players
                • Historical data
                • Press releases

                DATA ANALYSIS

                Data Synthesis

                • Collation of data
                • Estimation of key figures
                • Analysis of derived insights

                Data Validation

                • Triangulation with data models
                • Reference against proprietary databases
                • Corroboration with industry experts

                REPORT WRITING

                Qualitative

                • Market drivers
                • Market challenges
                • Market trends
                • Five forces analysis

                Quantitative

                • Market size and forecast
                • Market segmentation
                • Geographical insights
                • Competitive landscape

                Interested in this report?

                Get your sample now to see our research methodology and insights!

                Download Now

                Frequently Asked Questions

                Marine Power Systems market growth will increase by $ 3417.4 mn during 2024-2028.

                The Marine Power Systems market is expected to grow at a CAGR of 3.49% during 2024-2028.

                Marine Power Systems market is segmented by Type( Internal lighting, Navigation lighting, Surveillance systems, Engine control, Others) End-user( Commercial ships, Military vessel, Underwater vehicle, Leisure ships, Small recreational boats)

                AB Volvo, Atlas Marine Systems, Caterpillar Inc., Cummins Inc., Daihatsu Diesel Mfg. Co. Ltd., ENAG SAS, EnerSys, Enpro Inc., General Electric Co., Hydraulic Marine Systems Inc., Hyundai Electric and Energy Systems Co. Ltd., Ingeteam Corp. S.A., MAN Energy Solutions SE, Mitsubishi Heavy Industries Ltd., NEWMAR, Perkins Engines Co. Ltd., Rolls Royce Holdings Plc, Siemens AG, Wartsila Corp., Yamaha Corp. are a few of the key vendors in the Marine Power Systems market.

                APAC will register the highest growth rate of 52% among the other regions. Therefore, the Marine Power Systems market in APAC is expected to garner significant business opportunities for the vendors during the forecast period.

                China, US, Germany, South Korea, Japan

                • Surge in commercial shippingGlobal commercial shipping is witnessing growth due to an increase in globalization. The global economies are interlinked is the driving factor this market.
                • which directly affects global trade volumes. Global trade is also rising along with economic expansion is the driving factor this market.
                • in which maritime trade plays a major role. Therefore is the driving factor this market.
                • global economic expansion and development have provided enormous opportunities to the marine industry is the driving factor this market.
                • owing to the global demand and supply of commodities and manufactured goods. Sea transportation is a necessary means for the transport of goods among different regions. Transportation of goods via the sea route takes place mostly in the form of containers is the driving factor this market.
                • with products categorized as either less-container-load or full-container-load. Ship tankers are used to transport goods such as oil is the driving factor this market.
                • grain is the driving factor this market.
                • and coal in bulk. Therefore is the driving factor this market.
                • tankers are ideal for transporting heavy and bulky goods and products that involve longer lead times. Shipping of commercial goods offers many advantages: Ships use less fuel compared to trucks and trains and thus produce less carbon dioxide is the driving factor this market.
                • a greenhouse gas that contributes considerably to global warming. In addition is the driving factor this market.
                • ships are associated with lower emissions of air pollutants is the driving factor this market.
                • including carbon monoxide and oxides of sulfur and nitrogen is the driving factor this market.
                • when compared with trucks and trains. Ships produce less noise pollution. The low rumble of a ship's engine is less noisy than the roar of the engines of trucks and trains. Fewer major accidents are recorded in ship transport when compared with trucks and trains is the driving factor this market.
                • rendering them a much safer mode of transport of goods. While there are incidents of ships running aground is the driving factor this market.
                • serious accidents and cargo spills occur rarely. The rise in the adoption of shipping and its importance to seaborne trade is the driving factor this market.
                • along with the emergence of developing countries in shipbuilding and related activities is the driving factor this market.
                • are expected to drive the demand for marine power systems is the driving factor this market.
                • which is the driving factor this market.
                • in turn is the driving factor this market.
                • will contribute to the growth of the global marine power systems market during the forecast period. is the driving factor this market.

                The Marine Power Systems market vendors should focus on grabbing business opportunities from the Internal lighting segment as it accounted for the largest market share in the base year.
                RIA - Research AI Assistant
                Ask RIA