Marketplace Optimization And Fraud Prevention Technologies Market Analysis, Size, and Forecast 2026-2030: North America (US, Canada, and Mexico), Europe (UK, Germany, and France), APAC (China, Japan, and India), South America (Brazil, Argentina, and Colombia), Middle East and Africa (UAE, Saudi Arabia, and South Africa), and Rest of World (ROW)

Marketplace Optimization And Fraud Prevention Technologies Market Analysis, Size, and Forecast 2026-2030:
North America (US, Canada, and Mexico), Europe (UK, Germany, and France), APAC (China, Japan, and India), South America (Brazil, Argentina, and Colombia), Middle East and Africa (UAE, Saudi Arabia, and South Africa), and Rest of World (ROW)

Published: Mar 2026 302 Pages SKU: IRTNTR81365

Market Overview at a Glance

$8.28 B
Market Opportunity
21.4%
CAGR 2025 - 2030
41.3%
North America Growth
$2.98 B
Software segment 2024

Marketplace Optimization And Fraud Prevention Technologies Market Size 2026-2030

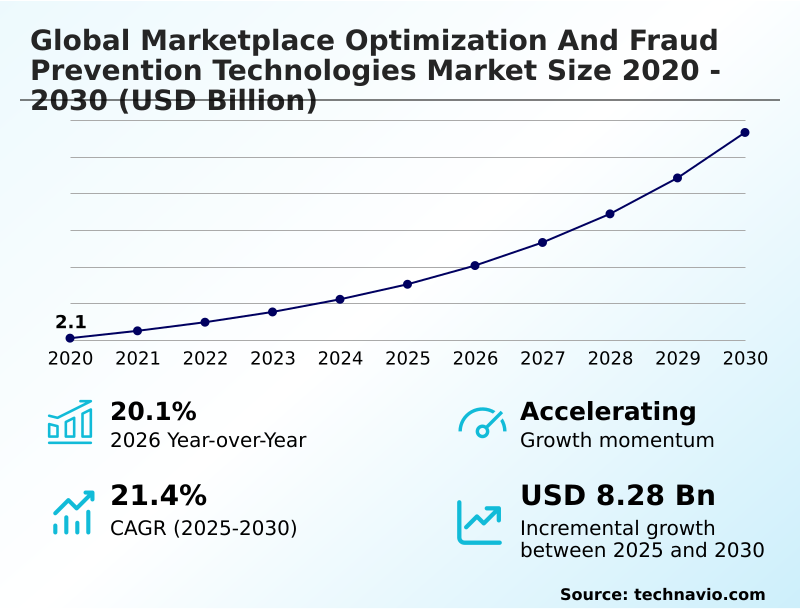
The marketplace optimization and fraud prevention technologies market size is valued to increase by USD 8.28 billion, at a CAGR of 21.4% from 2025 to 2030. Escalation of sophisticated digital fraud and synthetic identity theft will drive the marketplace optimization and fraud prevention technologies market.

Major Market Trends & Insights

  • North America dominated the market and accounted for a 41.3% growth during the forecast period.
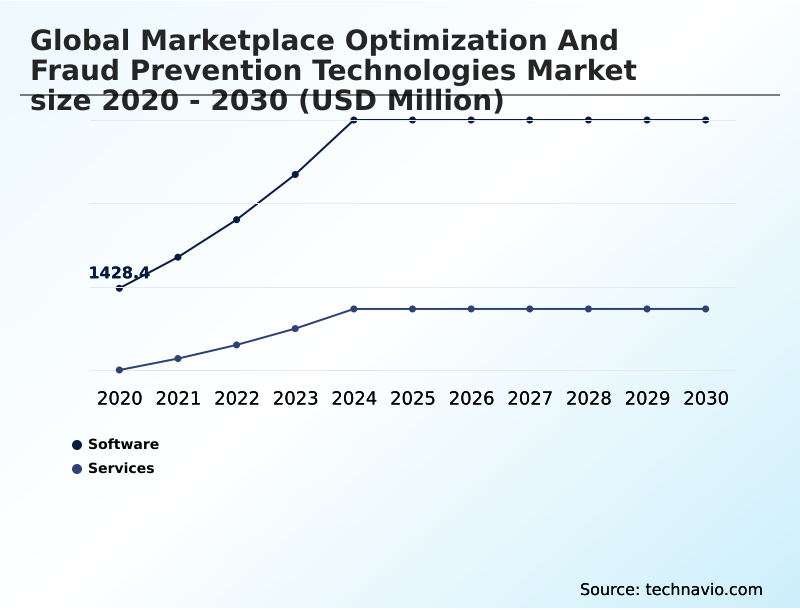
  • By Component - Software segment was valued at USD 2.98 billion in 2024
  • By Deployment - Cloud based segment accounted for the largest market revenue share in 2024

Market Size & Forecast

  • Market Opportunities: USD 11.22 billion
  • Market Future Opportunities: USD 8.28 billion
  • CAGR from 2025 to 2030 : 21.4%

Market Summary

  • The marketplace optimization and fraud prevention technologies market is defined by the dual objectives of enhancing commercial efficiency and securing digital ecosystems. As e-commerce platforms scale, they face increasingly sophisticated threats, from AI-driven bot attacks targeting inventory to complex synthetic identity fraud schemes designed to exploit financial systems.
  • Consequently, organizations are integrating multi-layered defensive strategies that combine real-time behavioral analytics with predictive risk-scoring engines. For instance, a multi-national retail platform uses user interaction patterns not only to personalize product recommendations but also to detect anomalies indicative of account takeover protection failure.
  • This synergy is critical, as optimization technologies focused on improving the frictionless user experience must operate in concert with security measures like continuous authentication protocols to avoid creating vulnerabilities.
  • The adoption of secure cloud architectures and unified neural networks allows for the rapid deployment of these integrated solutions, enabling businesses to protect revenue streams while fostering consumer trust in an intricate digital economy.

What will be the Size of the Marketplace Optimization And Fraud Prevention Technologies Market during the forecast period?

Get Key Insights on Market Forecast (PDF) Request Free Sample

How is the Marketplace Optimization And Fraud Prevention Technologies Market Segmented?

The marketplace optimization and fraud prevention technologies industry research report provides comprehensive data (region-wise segment analysis), with forecasts and estimates in "USD million" for the period 2026-2030, as well as historical data from 2020-2024 for the following segments.

  • Component
    • Software
    • Services
  • Deployment
    • Cloud based
    • On premises
  • Application
    • Payment fraud
    • Identity theft
    • New account fraud
    • Refund and policy abuse
    • Others
  • Geography
    • North America
      • US
      • Canada
      • Mexico
    • Europe
      • UK
      • Germany
      • France
    • APAC
      • China
      • Japan
      • India
    • South America
      • Brazil
      • Argentina
      • Colombia
    • Middle East and Africa
      • UAE
      • Saudi Arabia
      • South Africa
    • Rest of World (ROW)

By Component Insights

The software segment is estimated to witness significant growth during the forecast period.

The software segment is central to marketplace integrity, providing the technical architecture for security and optimization. These applications, often deployed via secure cloud architectures, utilize advanced risk-scoring engines and graph analysis to map complex relationships and identify fraudulent networks.

Core functionalities include device fingerprinting to track hardware signatures and specialized algorithms designed to counter specific threats like promo-code abuse, content scraping, and triangulation fraud.

The sophistication of these systems has led to a significant decrease in financial losses, with some platforms reporting a 15% reduction in chargebacks after implementing real-time analytical tools.

This component enables centralized security management, supports dynamic return policies, and optimizes reverse logistics optimization through better risk assessment informed by retail analytics, often in collaboration with an international cybersecurity coalition or a payment technology corporation.

Request Free Sample

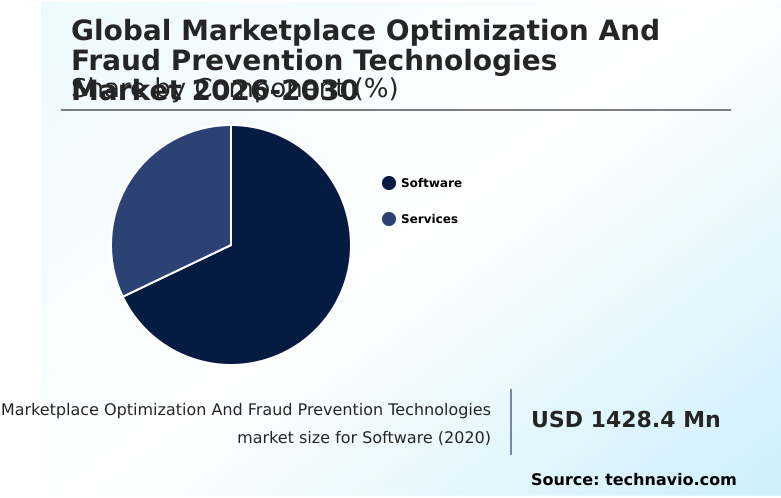
The Software segment was valued at USD 2.98 billion in 2024 and showed a gradual increase during the forecast period.

Request Free Sample

Regional Analysis

North America is estimated to contribute 41.3% to the growth of the global market during the forecast period.Technavio’s analysts have elaborately explained the regional trends and drivers that shape the market during the forecast period.

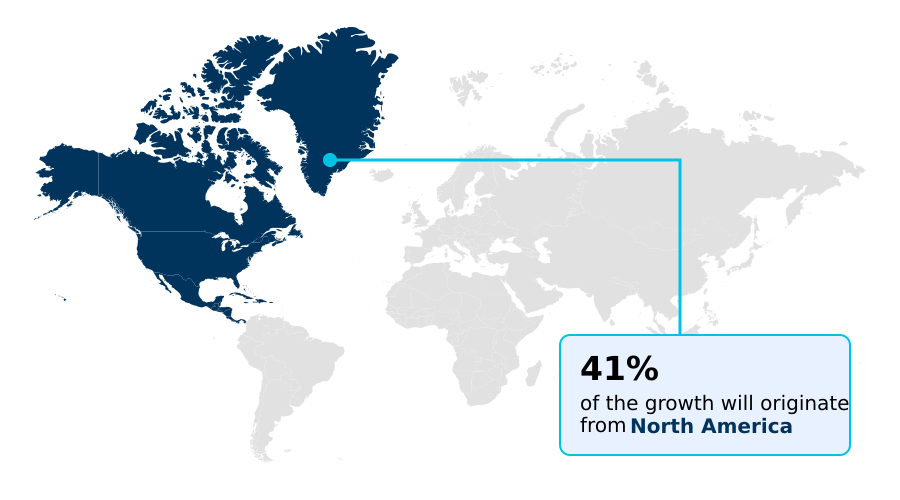
See How Marketplace Optimization And Fraud Prevention Technologies Market Demand is Rising in North America Request Free Sample

The geographic landscape is shaped by regional regulatory and technological trends. In South America, the focus is on securing instant payment ecosystems against high-velocity fraud.

In the UK, mitigating authorized push payment fraud is a priority, driving advancements in real-time transaction monitoring. Across all mature markets, biometric verification and digital identity verification are becoming standard for user onboarding checks.

A key objective for any marketplace platform provider is enhancing search optimization algorithms while securing the payment gateway security. Many regions are seeing a rise in regulatory-driven fraud prevention, pushing firms to use alternative data for risk assessment.

This has been particularly effective in social commerce security, where platforms have seen a 41.3% greater success rate in identifying fraudulent accounts by analyzing non-traditional data points.

Market Dynamics

Our researchers analyzed the data with 2025 as the base year, along with the key drivers, trends, and challenges. A holistic analysis of drivers will help companies refine their marketing strategies to gain a competitive advantage.

  • The strategic imperative for digital platforms is balancing frictionless journeys with security. This involves developing unified fraud prevention frameworks that can effectively manage risks in instant payment systems while integrating behavioral biometrics seamlessly. A primary focus is on preventing synthetic identity creation and combatting account takeover with biometrics, which are foundational to building resilient digital marketplace ecosystems.
  • Success requires not only using AI for proactive threat hunting but also optimizing search with fraud detection to create a holistic defense. Advanced platforms are now leveraging graph analysis for fraud rings and analyzing real time behavioral patterns to move beyond simple transaction monitoring.
  • This integrated approach helps in detecting promo code and policy abuse and is crucial for securing cross border e commerce. The challenge of managing data sovereignty compliance and ensuring algorithmic transparency in decisions remains, but platforms that excel are reducing false positives in real-time and optimizing logistics with fraud data.
  • A key metric of success is the ability to handle emerging threats like authorized push payment fraud while simultaneously protecting platforms from generative AI attacks, with integrated systems showing a two-fold greater efficiency in threat neutralization compared to legacy, rule-based engines.

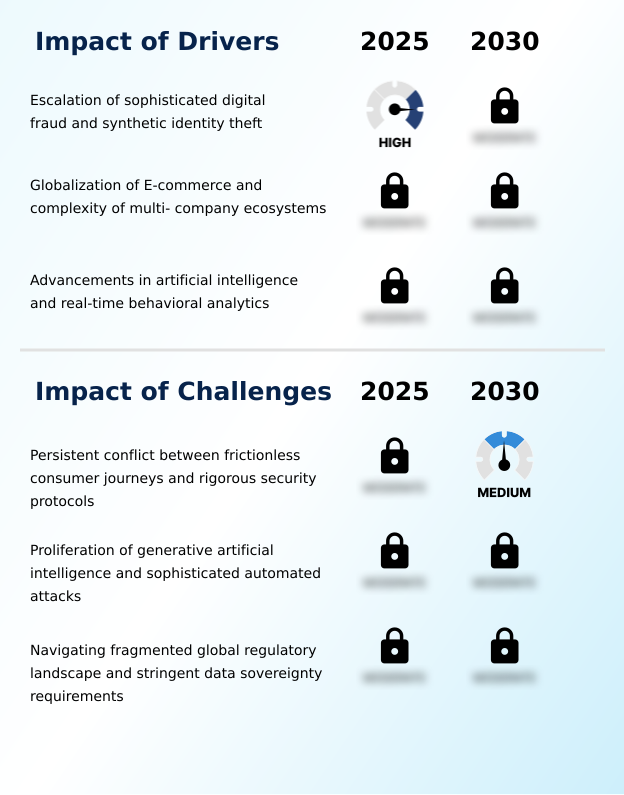
What are the key market drivers leading to the rise in the adoption of Marketplace Optimization And Fraud Prevention Technologies Industry?

  • The market's growth is primarily driven by the escalating sophistication of digital fraud, including the significant threat posed by synthetic identity theft.

  • The market is expanding due to the need for sophisticated defenses against threats amplified by large language models and AI-driven bot attacks. Organizations are implementing real-time behavioral analytics and continuous authentication protocols to secure cross-border payment processing.
  • The use of a generative AI suite for training models and applying localized risk scoring enhances precision. A robust digital commerce infrastructure is essential for secure multi-company marketplaces, with a financial technology provider often enabling the necessary tools.
  • This has led to an increase in cross-platform risk data exchange and partnerships with entities like a global logistics firm to integrate physical and digital data.
  • The integration of real-time threat intelligence has proven to reduce incident detection times by over 30%, showcasing the value of adaptive security frameworks.

What are the market trends shaping the Marketplace Optimization And Fraud Prevention Technologies Industry?

  • The market is witnessing a definitive transition toward passive behavioral biometrics. This shift prioritizes a frictionless authentication experience without compromising security.

  • A dominant trend is the convergence of optimization and security, enabled by unified neural networks and vector-based search. Systems now employ passive behavioral biometrics to monitor user interaction patterns invisibly, creating a frictionless user experience. This data is shared through a collaborative intelligence network, often using a standardized behavioral signature protocol.
  • The adoption of federated learning allows for insights without centralizing sensitive data, a key development for open banking integration. Platforms are becoming intelligent self-optimizing ecosystems governed by standardized security protocols and explainable AI models.
  • These capabilities are managed through unified orchestration platforms, which have demonstrated an 18% improvement in threat response times compared to siloed systems, marking a shift toward proactive, integrated defense.

What challenges does the Marketplace Optimization And Fraud Prevention Technologies Industry face during its growth?

  • A primary challenge restraining market growth is the persistent conflict between creating a frictionless consumer journey and implementing rigorous security protocols.

  • A significant challenge is the rise of automated attacks using deepfake detection bypasses and pixel-injection vulnerability exploits, demanding robust account takeover protection. The proliferation of synthetic identity fraud requires multi-layered defensive strategies beyond traditional identity verification software. Organizations are adopting decentralized identity models and proactive threat hunting to stay ahead.
  • However, navigating data sovereignty rules complicates chargeback management and supply chain optimization. Striking a balance is crucial, as overly aggressive algorithms can negatively impact customer lifetime value. The drive for algorithmic transparency further complicates model development.
  • These advanced threats require continuous investment, with security budgets increasing by an average of 25% year-over-year for large e-commerce platforms to counter sophisticated fraud rings.

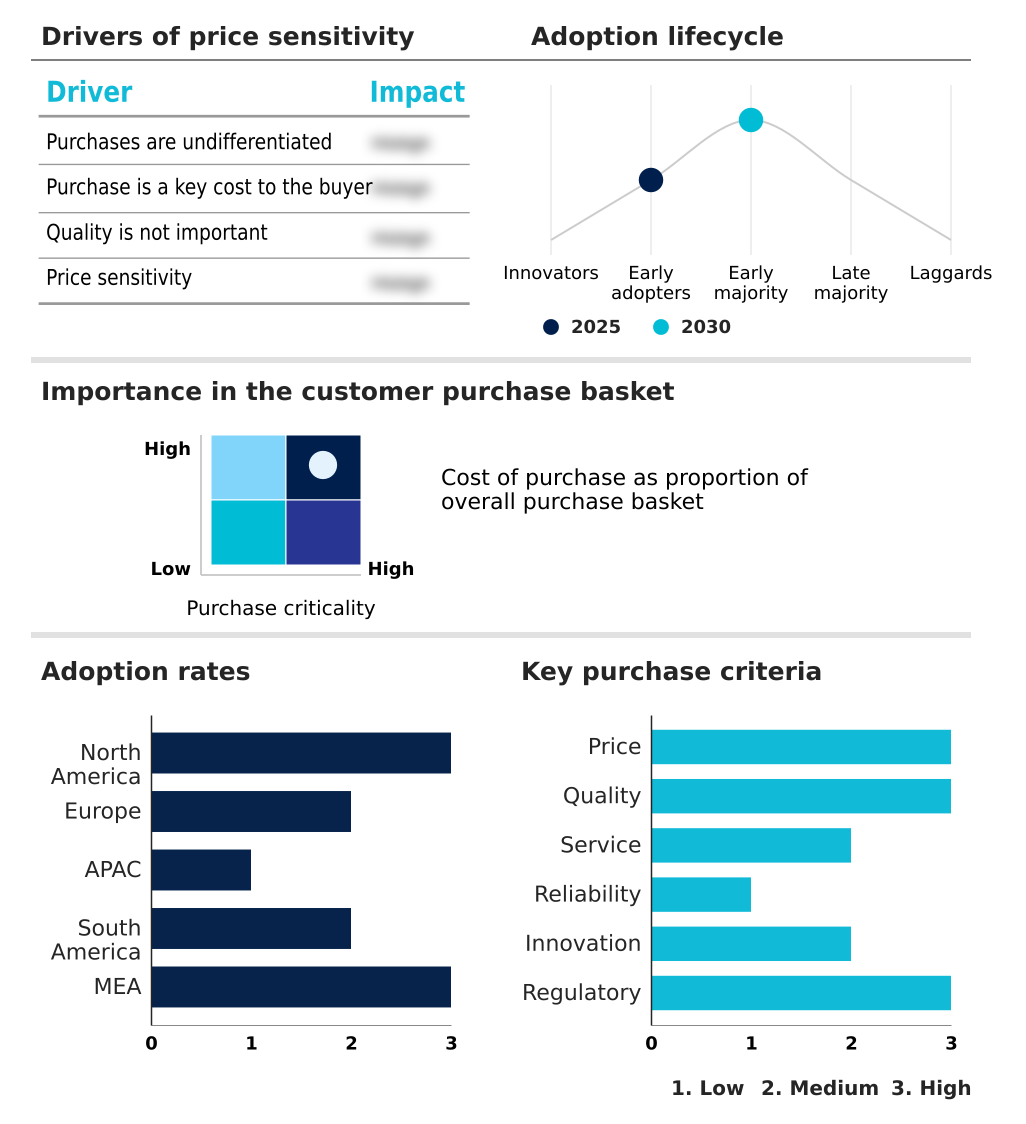
Exclusive Technavio Analysis on Customer Landscape

The marketplace optimization and fraud prevention technologies market forecasting report includes the adoption lifecycle of the market, covering from the innovator’s stage to the laggard’s stage. It focuses on adoption rates in different regions based on penetration. Furthermore, the marketplace optimization and fraud prevention technologies market report also includes key purchase criteria and drivers of price sensitivity to help companies evaluate and develop their market growth analysis strategies.

Customer Landscape of Marketplace Optimization And Fraud Prevention Technologies Industry

Competitive Landscape

Companies are implementing various strategies, such as strategic alliances, marketplace optimization and fraud prevention technologies market forecast, partnerships, mergers and acquisitions, geographical expansion, and product/service launches, to enhance their presence in the industry.

Accertify Inc. - Delivers unified platforms integrating secure payments, risk management, and marketplace optimization, ensuring transactional integrity and enhancing operational efficiency for digital commerce ecosystems.

The industry research and growth report includes detailed analyses of the competitive landscape of the market and information about key companies, including:

  • Accertify Inc.
  • Adyen NV
  • Checkout Ltd.
  • ClearSale S.A.
  • Cybersource.
  • Entrust Corp.
  • Experian Plc
  • Forter Ltd.
  • Jumio Corp.
  • LexisNexis Risk Solutions.
  • Mangopay S.A.
  • Mirakl SAS.
  • Ravelin Technology Ltd.
  • Riskified Ltd.
  • SEON Technologies Ltd.
  • Sift Science Inc.
  • Signifyd Inc.
  • Stripe Inc.
  • Tipalti Inc.
  • TransUnion

Qualitative and quantitative analysis of companies has been conducted to help clients understand the wider business environment as well as the strengths and weaknesses of key industry players. Data is qualitatively analyzed to categorize companies as pure play, category-focused, industry-focused, and diversified; it is quantitatively analyzed to categorize companies as dominant, leading, strong, tentative, and weak.

Recent Development and News in Marketplace optimization and fraud prevention technologies market

  • In August 2025, a leading enterprise marketplace platform provider announced a strategic partnership with a global logistics firm to integrate real-time tracking data into its fraud detection engine.
  • In October 2025, a major technology firm specializing in retail analytics unveiled a generative AI suite that creates synthetic datasets for training fraud detection models, enabling proactive threat simulation.
  • In November 2025, the central banking authority of a prominent South American nation implemented a mandatory real-time fraud alert system for digital marketplaces to report suspicious metadata.
  • In May 2025, a major North American payment technology corporation introduced a standardized behavioral signature protocol, allowing merchants to share non-identifiable interaction metadata to build a collective intelligence network.

Dive into Technavio’s robust research methodology, blending expert interviews, extensive data synthesis, and validated models for unparalleled Marketplace Optimization And Fraud Prevention Technologies Market insights. See full methodology.

Market Scope
Page number 302
Base year 2025
Historic period 2020-2024
Forecast period 2026-2030
Growth momentum & CAGR Accelerate at a CAGR of 21.4%
Market growth 2026-2030 USD 8276.5 million
Market structure Fragmented
YoY growth 2025-2026(%) 20.1%
Key countries US, Canada, Mexico, UK, Germany, France, The Netherlands, Spain, Italy, China, Japan, India, Australia, South Korea, Indonesia, Brazil, Argentina, Colombia, UAE, Saudi Arabia, South Africa, Israel and Turkey
Competitive landscape Leading Companies, Market Positioning of Companies, Competitive Strategies, and Industry Risks

Request Free Sample

Research Analyst Overview

  • The market is undergoing a significant transformation as organizations shift from reactive defense to predictive security frameworks. Core to this evolution is the integration of advanced analytical tools like risk-scoring engines and graph analysis to combat threats such as synthetic identity fraud and triangulation fraud.
  • The use of passive behavioral biometrics and continuous authentication protocols is becoming standard, analyzing subtle user interaction patterns to preemptively identify malicious actors. Technologies are also being deployed to counter specific exploits, including promo-code abuse, content scraping, and schemes leveraging pixel-injection vulnerability.
  • This requires multi-layered defensive strategies that can navigate complex issues like data sovereignty and the demand for algorithmic transparency. For boardroom decisions, the key is balancing investment in a generative AI suite for optimization against the costs of chargeback management.
  • Internal audits have shown that over-sensitive fraud algorithms can inadvertently block up to 15% of legitimate high-value transactions, highlighting the critical need for precisely calibrated systems.

What are the Key Data Covered in this Marketplace Optimization And Fraud Prevention Technologies Market Research and Growth Report?

  • What is the expected growth of the Marketplace Optimization And Fraud Prevention Technologies Market between 2026 and 2030?

    • USD 8.28 billion, at a CAGR of 21.4%

  • What segmentation does the market report cover?

    • The report is segmented by Component (Software, and Services), Deployment (Cloud based, and On premises), Application (Payment fraud, Identity theft, New account fraud, Refund and policy abuse, and Others) and Geography (North America, Europe, APAC, South America, Middle East and Africa)

  • Which regions are analyzed in the report?

    • North America, Europe, APAC, South America and Middle East and Africa

  • What are the key growth drivers and market challenges?

    • Escalation of sophisticated digital fraud and synthetic identity theft, Persistent conflict between frictionless consumer journeys and rigorous security protocols

  • Who are the major players in the Marketplace Optimization And Fraud Prevention Technologies Market?

    • Accertify Inc., Adyen NV, Checkout Ltd., ClearSale S.A., Cybersource., Entrust Corp., Experian Plc, Forter Ltd., Jumio Corp., LexisNexis Risk Solutions., Mangopay S.A., Mirakl SAS., Ravelin Technology Ltd., Riskified Ltd., SEON Technologies Ltd., Sift Science Inc., Signifyd Inc., Stripe Inc., Tipalti Inc. and TransUnion

Market Research Insights

  • The market is shaped by the convergence of security and growth objectives, managed through unified orchestration platforms. The adoption of intelligent self-optimizing ecosystems is rising, with businesses reporting a 15% reduction in false positives by using explainable AI models for risk assessment. To facilitate this, a collaborative intelligence network enables cross-platform risk data exchange under standardized security protocols.
  • This approach is crucial for secure multi-company marketplaces, where real-time analysis of user behavior helps maintain a frictionless user experience without compromising security. Organizations utilizing these integrated strategies have shown a 20% higher customer lifetime value compared to those with siloed security and marketing operations, demonstrating the clear business case for a holistic approach.

We can help! Our analysts can customize this marketplace optimization and fraud prevention technologies market research report to meet your requirements.

Get in touch

1. Executive Summary

1.1 Market overview

Executive Summary - Chart on Market Overview
Executive Summary - Data Table on Market Overview
Executive Summary - Chart on Global Market Characteristics
Executive Summary - Chart on Market by Geography
Executive Summary - Chart on Market Segmentation by Component
Executive Summary - Chart on Market Segmentation by Deployment
Executive Summary - Chart on Market Segmentation by Application
Executive Summary - Chart on Incremental Growth
Executive Summary - Data Table on Incremental Growth
Executive Summary - Chart on Company Market Positioning

2. Technavio Analysis

2.1 Analysis of price sensitivity, lifecycle, customer purchase basket, adoption rates, and purchase criteria

2.2 Criticality of inputs and Factors of differentiation

Chart on Overview on criticality of inputs and factors of differentiation

2.3 Factors of disruption

Chart on Overview on factors of disruption

2.4 Impact of drivers and challenges

Chart on Impact of drivers and challenges in 2025 and 2030

3. Market Landscape

3.1 Market ecosystem

Chart on Parent Market
Data Table on - Parent Market

3.2 Market characteristics

Chart on Market characteristics analysis

3.3 Value chain analysis

Chart on Value chain analysis

4. Market Sizing

4.1 Market definition

Data Table on Offerings of companies included in the market definition

4.2 Market segment analysis

Market segments

4.3 Market size 2025

4.4 Market outlook: Forecast for 2025-2030

Chart on Global - Market size and forecast 2025-2030 ($ million)
Data Table on Global - Market size and forecast 2025-2030 ($ million)
Chart on Global Market: Year-over-year growth 2025-2030 (%)
Data Table on Global Market: Year-over-year growth 2025-2030 (%)

5. Historic Market Size

5.1 Global Marketplace Optimization And Fraud Prevention Technologies Market 2020 - 2024

Historic Market Size - Data Table on Global Marketplace Optimization And Fraud Prevention Technologies Market 2020 - 2024 ($ million)

5.2 Component segment analysis 2020 - 2024

Historic Market Size - Component Segment 2020 - 2024 ($ million)

5.3 Deployment segment analysis 2020 - 2024

Historic Market Size - Deployment Segment 2020 - 2024 ($ million)

5.4 Application segment analysis 2020 - 2024

Historic Market Size - Application Segment 2020 - 2024 ($ million)

5.5 Geography segment analysis 2020 - 2024

Historic Market Size - Geography Segment 2020 - 2024 ($ million)

5.6 Country segment analysis 2020 - 2024

Historic Market Size - Country Segment 2020 - 2024 ($ million)

6. Qualitative Analysis

6.1 The AI impact on Global Marketplace Optimization and Fraud Prevention Technologies Market

6.2 Impact of geopolitical conflicts on Global Marketplace Optimization and Fraud Prevention Technologies Market

7. Five Forces Analysis

7.1 Five forces summary

Five forces analysis - Comparison between 2025 and 2030

7.2 Bargaining power of buyers

Bargaining power of buyers - Impact of key factors 2025 and 2030

7.3 Bargaining power of suppliers

Bargaining power of suppliers - Impact of key factors in 2025 and 2030

7.4 Threat of new entrants

Threat of new entrants - Impact of key factors in 2025 and 2030

7.5 Threat of substitutes

Threat of substitutes - Impact of key factors in 2025 and 2030

7.6 Threat of rivalry

Threat of rivalry - Impact of key factors in 2025 and 2030

7.7 Market condition

Chart on Market condition - Five forces 2025 and 2030

8. Market Segmentation by Component

8.1 Market segments

Chart on Component - Market share 2025-2030 (%)
Data Table on Component - Market share 2025-2030 (%)

8.2 Comparison by Component

Chart on Comparison by Component
Data Table on Comparison by Component

8.3 Software - Market size and forecast 2025-2030

Chart on Software - Market size and forecast 2025-2030 ($ million)
Data Table on Software - Market size and forecast 2025-2030 ($ million)
Chart on Software - Year-over-year growth 2025-2030 (%)
Data Table on Software - Year-over-year growth 2025-2030 (%)

8.4 Services - Market size and forecast 2025-2030

Chart on Services - Market size and forecast 2025-2030 ($ million)
Data Table on Services - Market size and forecast 2025-2030 ($ million)
Chart on Services - Year-over-year growth 2025-2030 (%)
Data Table on Services - Year-over-year growth 2025-2030 (%)

8.5 Market opportunity by Component

Market opportunity by Component ($ million)
Data Table on Market opportunity by Component ($ million)

9. Market Segmentation by Deployment

9.1 Market segments

Chart on Deployment - Market share 2025-2030 (%)
Data Table on Deployment - Market share 2025-2030 (%)

9.2 Comparison by Deployment

Chart on Comparison by Deployment
Data Table on Comparison by Deployment

9.3 Cloud based - Market size and forecast 2025-2030

Chart on Cloud based - Market size and forecast 2025-2030 ($ million)
Data Table on Cloud based - Market size and forecast 2025-2030 ($ million)
Chart on Cloud based - Year-over-year growth 2025-2030 (%)
Data Table on Cloud based - Year-over-year growth 2025-2030 (%)

9.4 On premises - Market size and forecast 2025-2030

Chart on On premises - Market size and forecast 2025-2030 ($ million)
Data Table on On premises - Market size and forecast 2025-2030 ($ million)
Chart on On premises - Year-over-year growth 2025-2030 (%)
Data Table on On premises - Year-over-year growth 2025-2030 (%)

9.5 Market opportunity by Deployment

Market opportunity by Deployment ($ million)
Data Table on Market opportunity by Deployment ($ million)

10. Market Segmentation by Application

10.1 Market segments

Chart on Application - Market share 2025-2030 (%)
Data Table on Application - Market share 2025-2030 (%)

10.2 Comparison by Application

Chart on Comparison by Application
Data Table on Comparison by Application

10.3 Payment fraud - Market size and forecast 2025-2030

Chart on Payment fraud - Market size and forecast 2025-2030 ($ million)
Data Table on Payment fraud - Market size and forecast 2025-2030 ($ million)
Chart on Payment fraud - Year-over-year growth 2025-2030 (%)
Data Table on Payment fraud - Year-over-year growth 2025-2030 (%)

10.4 Identity theft - Market size and forecast 2025-2030

Chart on Identity theft - Market size and forecast 2025-2030 ($ million)
Data Table on Identity theft - Market size and forecast 2025-2030 ($ million)
Chart on Identity theft - Year-over-year growth 2025-2030 (%)
Data Table on Identity theft - Year-over-year growth 2025-2030 (%)

10.5 New account fraud - Market size and forecast 2025-2030

Chart on New account fraud - Market size and forecast 2025-2030 ($ million)
Data Table on New account fraud - Market size and forecast 2025-2030 ($ million)
Chart on New account fraud - Year-over-year growth 2025-2030 (%)
Data Table on New account fraud - Year-over-year growth 2025-2030 (%)

10.6 Refund and policy abuse - Market size and forecast 2025-2030

Chart on Refund and policy abuse - Market size and forecast 2025-2030 ($ million)
Data Table on Refund and policy abuse - Market size and forecast 2025-2030 ($ million)
Chart on Refund and policy abuse - Year-over-year growth 2025-2030 (%)
Data Table on Refund and policy abuse - Year-over-year growth 2025-2030 (%)

10.7 Others - Market size and forecast 2025-2030

Chart on Others - Market size and forecast 2025-2030 ($ million)
Data Table on Others - Market size and forecast 2025-2030 ($ million)
Chart on Others - Year-over-year growth 2025-2030 (%)
Data Table on Others - Year-over-year growth 2025-2030 (%)

10.8 Market opportunity by Application

Market opportunity by Application ($ million)
Data Table on Market opportunity by Application ($ million)

11. Customer Landscape

11.1 Customer landscape overview

Analysis of price sensitivity, lifecycle, customer purchase basket, adoption rates, and purchase criteria

12. Geographic Landscape

12.1 Geographic segmentation

Chart on Market share by geography 2025-2030 (%)
Data Table on Market share by geography 2025-2030 (%)

12.2 Geographic comparison

Chart on Geographic comparison
Data Table on Geographic comparison

12.3 North America - Market size and forecast 2025-2030

Chart on North America - Market size and forecast 2025-2030 ($ million)
Data Table on North America - Market size and forecast 2025-2030 ($ million)
Chart on North America - Year-over-year growth 2025-2030 (%)
Data Table on North America - Year-over-year growth 2025-2030 (%)
Chart on Regional Comparison - North America
Data Table on Regional Comparison - North America

12.3.1 US - Market size and forecast 2025-2030

Chart on US - Market size and forecast 2025-2030 ($ million)
Data Table on US - Market size and forecast 2025-2030 ($ million)
Chart on US - Year-over-year growth 2025-2030 (%)
Data Table on US - Year-over-year growth 2025-2030 (%)

12.3.2 Canada - Market size and forecast 2025-2030

Chart on Canada - Market size and forecast 2025-2030 ($ million)
Data Table on Canada - Market size and forecast 2025-2030 ($ million)
Chart on Canada - Year-over-year growth 2025-2030 (%)
Data Table on Canada - Year-over-year growth 2025-2030 (%)

12.3.3 Mexico - Market size and forecast 2025-2030

Chart on Mexico - Market size and forecast 2025-2030 ($ million)
Data Table on Mexico - Market size and forecast 2025-2030 ($ million)
Chart on Mexico - Year-over-year growth 2025-2030 (%)
Data Table on Mexico - Year-over-year growth 2025-2030 (%)

12.4 Europe - Market size and forecast 2025-2030

Chart on Europe - Market size and forecast 2025-2030 ($ million)
Data Table on Europe - Market size and forecast 2025-2030 ($ million)
Chart on Europe - Year-over-year growth 2025-2030 (%)
Data Table on Europe - Year-over-year growth 2025-2030 (%)
Chart on Regional Comparison - Europe
Data Table on Regional Comparison - Europe

12.4.1 UK - Market size and forecast 2025-2030

Chart on UK - Market size and forecast 2025-2030 ($ million)
Data Table on UK - Market size and forecast 2025-2030 ($ million)
Chart on UK - Year-over-year growth 2025-2030 (%)
Data Table on UK - Year-over-year growth 2025-2030 (%)

12.4.2 Germany - Market size and forecast 2025-2030

Chart on Germany - Market size and forecast 2025-2030 ($ million)
Data Table on Germany - Market size and forecast 2025-2030 ($ million)
Chart on Germany - Year-over-year growth 2025-2030 (%)
Data Table on Germany - Year-over-year growth 2025-2030 (%)

12.4.3 France - Market size and forecast 2025-2030

Chart on France - Market size and forecast 2025-2030 ($ million)
Data Table on France - Market size and forecast 2025-2030 ($ million)
Chart on France - Year-over-year growth 2025-2030 (%)
Data Table on France - Year-over-year growth 2025-2030 (%)

12.4.4 The Netherlands - Market size and forecast 2025-2030

Chart on The Netherlands - Market size and forecast 2025-2030 ($ million)
Data Table on The Netherlands - Market size and forecast 2025-2030 ($ million)
Chart on The Netherlands - Year-over-year growth 2025-2030 (%)
Data Table on The Netherlands - Year-over-year growth 2025-2030 (%)

12.4.5 Spain - Market size and forecast 2025-2030

Chart on Spain - Market size and forecast 2025-2030 ($ million)
Data Table on Spain - Market size and forecast 2025-2030 ($ million)
Chart on Spain - Year-over-year growth 2025-2030 (%)
Data Table on Spain - Year-over-year growth 2025-2030 (%)

12.4.6 Italy - Market size and forecast 2025-2030

Chart on Italy - Market size and forecast 2025-2030 ($ million)
Data Table on Italy - Market size and forecast 2025-2030 ($ million)
Chart on Italy - Year-over-year growth 2025-2030 (%)
Data Table on Italy - Year-over-year growth 2025-2030 (%)

12.5 APAC - Market size and forecast 2025-2030

Chart on APAC - Market size and forecast 2025-2030 ($ million)
Data Table on APAC - Market size and forecast 2025-2030 ($ million)
Chart on APAC - Year-over-year growth 2025-2030 (%)
Data Table on APAC - Year-over-year growth 2025-2030 (%)
Chart on Regional Comparison - APAC
Data Table on Regional Comparison - APAC

12.5.1 China - Market size and forecast 2025-2030

Chart on China - Market size and forecast 2025-2030 ($ million)
Data Table on China - Market size and forecast 2025-2030 ($ million)
Chart on China - Year-over-year growth 2025-2030 (%)
Data Table on China - Year-over-year growth 2025-2030 (%)

12.5.2 Japan - Market size and forecast 2025-2030

Chart on Japan - Market size and forecast 2025-2030 ($ million)
Data Table on Japan - Market size and forecast 2025-2030 ($ million)
Chart on Japan - Year-over-year growth 2025-2030 (%)
Data Table on Japan - Year-over-year growth 2025-2030 (%)

12.5.3 India - Market size and forecast 2025-2030

Chart on India - Market size and forecast 2025-2030 ($ million)
Data Table on India - Market size and forecast 2025-2030 ($ million)
Chart on India - Year-over-year growth 2025-2030 (%)
Data Table on India - Year-over-year growth 2025-2030 (%)

12.5.4 Australia - Market size and forecast 2025-2030

Chart on Australia - Market size and forecast 2025-2030 ($ million)
Data Table on Australia - Market size and forecast 2025-2030 ($ million)
Chart on Australia - Year-over-year growth 2025-2030 (%)
Data Table on Australia - Year-over-year growth 2025-2030 (%)

12.5.5 South Korea - Market size and forecast 2025-2030

Chart on South Korea - Market size and forecast 2025-2030 ($ million)
Data Table on South Korea - Market size and forecast 2025-2030 ($ million)
Chart on South Korea - Year-over-year growth 2025-2030 (%)
Data Table on South Korea - Year-over-year growth 2025-2030 (%)

12.5.6 Indonesia - Market size and forecast 2025-2030

Chart on Indonesia - Market size and forecast 2025-2030 ($ million)
Data Table on Indonesia - Market size and forecast 2025-2030 ($ million)
Chart on Indonesia - Year-over-year growth 2025-2030 (%)
Data Table on Indonesia - Year-over-year growth 2025-2030 (%)

12.6 South America - Market size and forecast 2025-2030

Chart on South America - Market size and forecast 2025-2030 ($ million)
Data Table on South America - Market size and forecast 2025-2030 ($ million)
Chart on South America - Year-over-year growth 2025-2030 (%)
Data Table on South America - Year-over-year growth 2025-2030 (%)
Chart on Regional Comparison - South America
Data Table on Regional Comparison - South America

12.6.1 Brazil - Market size and forecast 2025-2030

Chart on Brazil - Market size and forecast 2025-2030 ($ million)
Data Table on Brazil - Market size and forecast 2025-2030 ($ million)
Chart on Brazil - Year-over-year growth 2025-2030 (%)
Data Table on Brazil - Year-over-year growth 2025-2030 (%)

12.6.2 Argentina - Market size and forecast 2025-2030

Chart on Argentina - Market size and forecast 2025-2030 ($ million)
Data Table on Argentina - Market size and forecast 2025-2030 ($ million)
Chart on Argentina - Year-over-year growth 2025-2030 (%)
Data Table on Argentina - Year-over-year growth 2025-2030 (%)

12.6.3 Colombia - Market size and forecast 2025-2030

Chart on Colombia - Market size and forecast 2025-2030 ($ million)
Data Table on Colombia - Market size and forecast 2025-2030 ($ million)
Chart on Colombia - Year-over-year growth 2025-2030 (%)
Data Table on Colombia - Year-over-year growth 2025-2030 (%)

12.7 Middle East and Africa - Market size and forecast 2025-2030

Chart on Middle East and Africa - Market size and forecast 2025-2030 ($ million)
Data Table on Middle East and Africa - Market size and forecast 2025-2030 ($ million)
Chart on Middle East and Africa - Year-over-year growth 2025-2030 (%)
Data Table on Middle East and Africa - Year-over-year growth 2025-2030 (%)
Chart on Regional Comparison - Middle East and Africa
Data Table on Regional Comparison - Middle East and Africa

12.7.1 UAE - Market size and forecast 2025-2030

Chart on UAE - Market size and forecast 2025-2030 ($ million)
Data Table on UAE - Market size and forecast 2025-2030 ($ million)
Chart on UAE - Year-over-year growth 2025-2030 (%)
Data Table on UAE - Year-over-year growth 2025-2030 (%)

12.7.2 Saudi Arabia - Market size and forecast 2025-2030

Chart on Saudi Arabia - Market size and forecast 2025-2030 ($ million)
Data Table on Saudi Arabia - Market size and forecast 2025-2030 ($ million)
Chart on Saudi Arabia - Year-over-year growth 2025-2030 (%)
Data Table on Saudi Arabia - Year-over-year growth 2025-2030 (%)

12.7.3 South Africa - Market size and forecast 2025-2030

Chart on South Africa - Market size and forecast 2025-2030 ($ million)
Data Table on South Africa - Market size and forecast 2025-2030 ($ million)
Chart on South Africa - Year-over-year growth 2025-2030 (%)
Data Table on South Africa - Year-over-year growth 2025-2030 (%)

12.7.4 Israel - Market size and forecast 2025-2030

Chart on Israel - Market size and forecast 2025-2030 ($ million)
Data Table on Israel - Market size and forecast 2025-2030 ($ million)
Chart on Israel - Year-over-year growth 2025-2030 (%)
Data Table on Israel - Year-over-year growth 2025-2030 (%)

12.7.5 Turkey - Market size and forecast 2025-2030

Chart on Turkey - Market size and forecast 2025-2030 ($ million)
Data Table on Turkey - Market size and forecast 2025-2030 ($ million)
Chart on Turkey - Year-over-year growth 2025-2030 (%)
Data Table on Turkey - Year-over-year growth 2025-2030 (%)

12.8 Market opportunity by geography

Market opportunity by geography ($ million)
Data Tables on Market opportunity by geography ($ million)

13. Drivers, Challenges, and Opportunity

13.1 Market drivers

Escalation of sophisticated digital fraud and synthetic identity theft
Globalization of E-commerce and complexity of multi- company ecosystems
Advancements in artificial intelligence and real-time behavioral analytics

13.2 Market challenges

Persistent conflict between frictionless consumer journeys and rigorous security protocols
Proliferation of generative artificial intelligence and sophisticated automated attacks
Navigating fragmented global regulatory landscape and stringent data sovereignty requirements

13.3 Impact of drivers and challenges

Impact of drivers and challenges in 2025 and 2030

13.4 Market opportunities

Transition toward passive behavioral biometrics and frictionless authentication
Convergence of search optimization and fraud detection through unified neural networks
Rise of regulatory-driven fraud prevention protocols in instant payment ecosystems

14. Competitive Landscape

14.1 Overview

14.2

Overview on criticality of inputs and factors of differentiation

14.3 Landscape disruption

Overview on factors of disruption

14.4 Industry risks

Impact of key risks on business

15. Competitive Analysis

15.1 Companies profiled

Companies covered

15.2 Company ranking index

15.3 Market positioning of companies

Matrix on companies position and classification

15.4 Adyen NV

Adyen NV - Overview
Adyen NV - Product / Service
Adyen NV - Key offerings
SWOT

15.5 Checkout Ltd.

Checkout Ltd. - Overview
Checkout Ltd. - Product / Service
Checkout Ltd. - Key offerings
SWOT

15.6 Entrust Corp.

Entrust Corp. - Overview
Entrust Corp. - Product / Service
Entrust Corp. - Key offerings
SWOT

15.7 Experian Plc

Experian Plc - Overview
Experian Plc - Business segments
Experian Plc - Key offerings
Experian Plc - Segment focus
SWOT

15.8 Forter Ltd.

Forter Ltd. - Overview
Forter Ltd. - Product / Service
Forter Ltd. - Key offerings
SWOT

15.9 Jumio Corp.

Jumio Corp. - Overview
Jumio Corp. - Product / Service
Jumio Corp. - Key news
Jumio Corp. - Key offerings
SWOT

15.10 LexisNexis Risk Solutions.

LexisNexis Risk Solutions. - Overview
LexisNexis Risk Solutions. - Product / Service
LexisNexis Risk Solutions. - Key offerings
SWOT

15.11 Mangopay S.A.

Mangopay S.A. - Overview
Mangopay S.A. - Product / Service
Mangopay S.A. - Key offerings
SWOT

15.12 Mirakl SAS.

Mirakl SAS. - Overview
Mirakl SAS. - Product / Service
Mirakl SAS. - Key offerings
SWOT

15.13 Riskified Ltd.

Riskified Ltd. - Overview
Riskified Ltd. - Product / Service
Riskified Ltd. - Key offerings
SWOT

15.14 SEON Technologies Ltd.

SEON Technologies Ltd. - Overview
SEON Technologies Ltd. - Product / Service
SEON Technologies Ltd. - Key offerings
SWOT

15.15 Sift Science Inc.

Sift Science Inc. - Overview
Sift Science Inc. - Product / Service
Sift Science Inc. - Key offerings
SWOT

15.16 Signifyd Inc.

Signifyd Inc. - Overview
Signifyd Inc. - Product / Service
Signifyd Inc. - Key offerings
SWOT

15.17 Stripe Inc.

Stripe Inc. - Overview
Stripe Inc. - Product / Service
Stripe Inc. - Key offerings
SWOT

15.18 TransUnion

TransUnion - Overview
TransUnion - Business segments
TransUnion - Key news
TransUnion - Key offerings
TransUnion - Segment focus
SWOT

16. Appendix

16.1 Scope of the report

Market definition
Objectives
Notes and caveats

16.2 Inclusions and exclusions checklist

Inclusions checklist
Exclusions checklist

16.3 Currency conversion rates for US$

16.4 Research methodology

16.5 Data procurement

Information sources

16.6 Data validation

16.7 Validation techniques employed for market sizing

16.8 Data synthesis

16.9 360 degree market analysis

16.10 List of abbreviations

Research Methodology

Technavio presents a detailed picture of the market by way of study, synthesis, and summation of data from multiple sources. The analysts have presented the various facets of the market with a particular focus on identifying the key industry influencers. The data thus presented is comprehensive, reliable, and the result of extensive research, both primary and secondary.

INFORMATION SOURCES

Primary sources

  • Manufacturers and suppliers
  • Channel partners
  • Industry experts
  • Strategic decision makers

Secondary sources

  • Industry journals and periodicals
  • Government data
  • Financial reports of key industry players
  • Historical data
  • Press releases

DATA ANALYSIS

Data Synthesis

  • Collation of data
  • Estimation of key figures
  • Analysis of derived insights

Data Validation

  • Triangulation with data models
  • Reference against proprietary databases
  • Corroboration with industry experts

REPORT WRITING

Qualitative

  • Market drivers
  • Market challenges
  • Market trends
  • Five forces analysis

Quantitative

  • Market size and forecast
  • Market segmentation
  • Geographical insights
  • Competitive landscape

Interested in this report?

Get your sample now to see our research methodology and insights!

Download Now

Frequently Asked Questions

Marketplace Optimization And Fraud Prevention Technologies market growth will increase by USD 8276.5 million during 2026-2030.

The Marketplace Optimization And Fraud Prevention Technologies market is expected to grow at a CAGR of 21.4% during 2026-2030.

Marketplace Optimization And Fraud Prevention Technologies market is segmented by Component (Software, Services) Deployment (Cloud based, On premises) Application (Payment fraud, Identity theft, New account fraud, Refund and policy abuse, Others)

Accertify Inc., Adyen NV, Checkout Ltd., ClearSale S.A., Cybersource., Entrust Corp., Experian Plc, Forter Ltd., Jumio Corp., LexisNexis Risk Solutions., Mangopay S.A., Mirakl SAS., Ravelin Technology Ltd., Riskified Ltd., SEON Technologies Ltd., Sift Science Inc., Signifyd Inc., Stripe Inc., Tipalti Inc., TransUnion are a few of the key vendors in the Marketplace Optimization And Fraud Prevention Technologies market.

North America will register the highest growth rate of 41.3% among the other regions. Therefore, the Marketplace Optimization And Fraud Prevention Technologies market in North America is expected to garner significant business opportunities for the vendors during the forecast period.

US, Canada, Mexico, UK, Germany, France, The Netherlands, Spain, Italy, China, Japan, India, Australia, South Korea, Indonesia, Brazil, Argentina, Colombia, UAE, Saudi Arabia, South Africa, Israel, Turkey

  • Escalation of sophisticated digital fraud and synthetic identity theft is the driving factor this market.

The Marketplace Optimization And Fraud Prevention Technologies market vendors should focus on grabbing business opportunities from the Component segment as it accounted for the largest market share in the base year.
RIA - Research AI Assistant
Ask RIA