
Melt Blown Polypropylene Filters Market Analysis, Size, and Forecast 2026-2030: APAC (China, Japan, and India), North America (US, Canada, and Mexico), Europe (Germany, UK, and France), South America (Brazil, Argentina, and Chile), Middle East and Africa (Saudi Arabia, UAE, and South Africa), and Rest of World (ROW)

Melt Blown Polypropylene Filters Market Analysis, Size, and Forecast 2026-2030:
APAC (China, Japan, and India), North America (US, Canada, and Mexico), Europe (Germany, UK, and France), South America (Brazil, Argentina, and Chile), Middle East and Africa (Saudi Arabia, UAE, and South Africa), and Rest of World (ROW)

Published: Oct 2026 296 Pages SKU: IRTNTR75884

Market Overview at a Glance

$1.22 B
Market Opportunity
7.2%
CAGR 2025 - 2030
41.8%
APAC Growth
$2.15 B
Liquid segment 2024

Melt Blown Polypropylene Filters Market Size 2026-2030

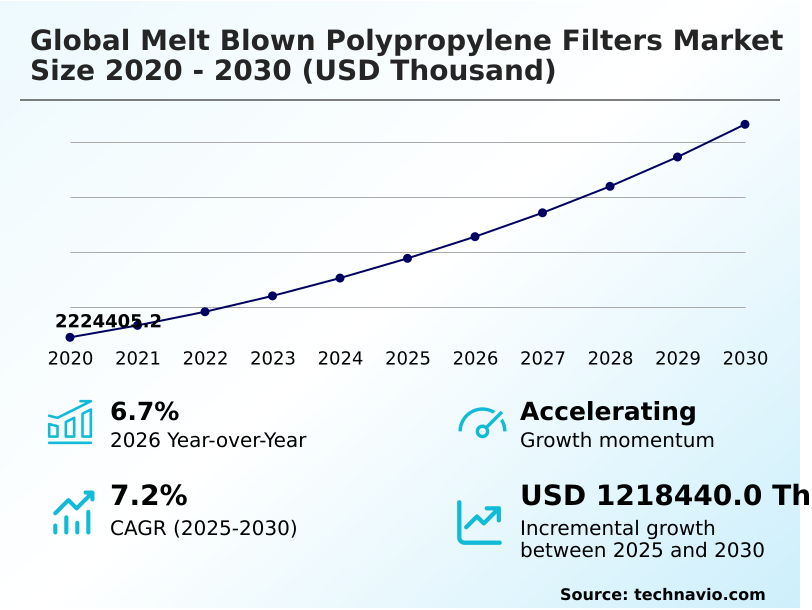
The melt blown polypropylene filters market size is valued to increase by USD 1.22 billion, at a CAGR of 7.2% from 2025 to 2030. Expansion in water treatment will drive the melt blown polypropylene filters market.

Major Market Trends & Insights

  • APAC dominated the market and accounted for a 41.8% growth during the forecast period.
  • By Type - Liquid segment was valued at USD 2.15 billion in 2024
  • By End-user - Waste water treatment segment accounted for the largest market revenue share in 2024

Market Size & Forecast

  • Market Opportunities:
  • Market Future Opportunities: USD 1.22 billion
  • CAGR from 2025 to 2030 : 7.2%

Market Summary

  • The Melt Blown Polypropylene Filters Market demonstrates robust expansion driven by escalating requirements for high-purity fluid processing across municipal and industrial sectors. Facility operators continuously upgrade purification infrastructure to protect delicate membrane systems from premature fouling.
  • For instance in large-scale seawater desalination projects the strategic integration of advanced pre-filtration skids has extended the operational lifespan of reverse osmosis pumps by up to 35% significantly lowering maintenance expenditures. The continuous expansion in advanced water treatment acts as a primary catalyst as stricter environmental regulations compel industrial plants to adopt highly efficient depth filtration media.
  • Conversely extreme volatility in petrochemical feedstock prices poses a significant structural challenge periodically squeezing manufacturing margins and disrupting long-term procurement budgets. Overall the steadfast commitment to securing clean water supplies and optimizing industrial fluid separation ensures a sustained upward trajectory for these critical filtration components.

What will be the Size of the Melt Blown Polypropylene Filters Market during the forecast period?
Get Key Insights on Market Forecast (PDF) Get Free Sample

How is the Melt Blown Polypropylene Filters Market Segmented?

The melt blown polypropylene filters industry research report provides comprehensive data (region-wise segment analysis), with forecasts and estimates in "USD thousand" for the period 2026-2030, as well as historical data from 2020-2024 for the following segments.

  • Type
    • Liquid
    • Air
  • End-user
    • Waste water treatment
    • Food and beverages
    • Chemical
    • Pharmaceuticals
    • Others
  • Distribution channel
    • Distributors
    • Direct sales
    • Online retail
  • Geography
    • APAC
      • China
      • Japan
      • India
      • South Korea
      • Australia
      • Indonesia
    • North America
      • US
      • Canada
      • Mexico
    • Europe
      • Germany
      • UK
      • France
      • Italy
      • Spain
      • The Netherlands
    • South America
      • Brazil
      • Argentina
      • Chile
    • Middle East and Africa
      • Saudi Arabia
      • UAE
      • South Africa
      • Turkey
      • Israel

By Type Insights

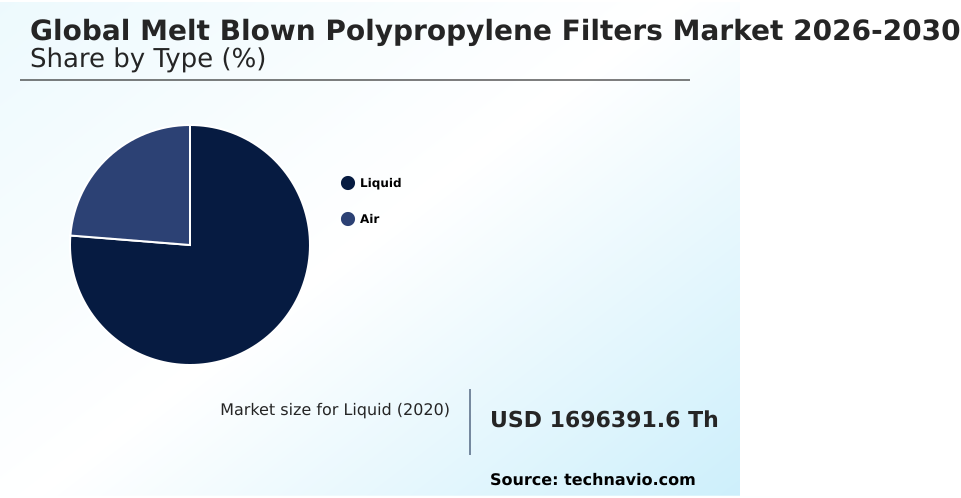
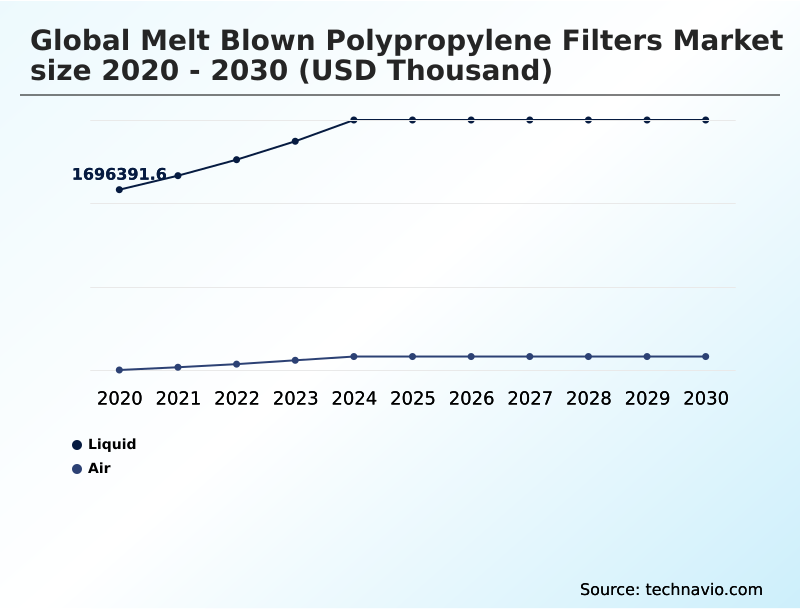
The liquid segment is estimated to witness significant growth during the forecast period.

Liquid filtration configurations represent the foundational core of the Melt Blown Polypropylene Filters market driving critical separation processes across global industries.

Facility operators prioritize these specialized cartridges for their exceptional particulate retention and unique gradient density matrix which traps progressively finer particles deep within the filter bed.

This architectural advantage maximizes dirt holding capacity yielding a 40% increase in operational lifecycle compared to conventional surface filters. Chemical processing and water treatment sectors mandate these components to eliminate colloidal impurities while ensuring structural stability under fluctuating conditions.

Through targeted flow rate optimization and strategic pressure drop minimization industrial plants achieve up to a 25% reduction in pumping energy expenditure. The continuous reliance on robust liquid depth filters highlights their indispensability in maintaining uninterrupted high-efficiency purification operations.
Get Free Sample

The Liquid segment was valued at USD 2.15 billion in 2024 and showed a gradual increase during the forecast period.
Get Free Sample

Regional Analysis

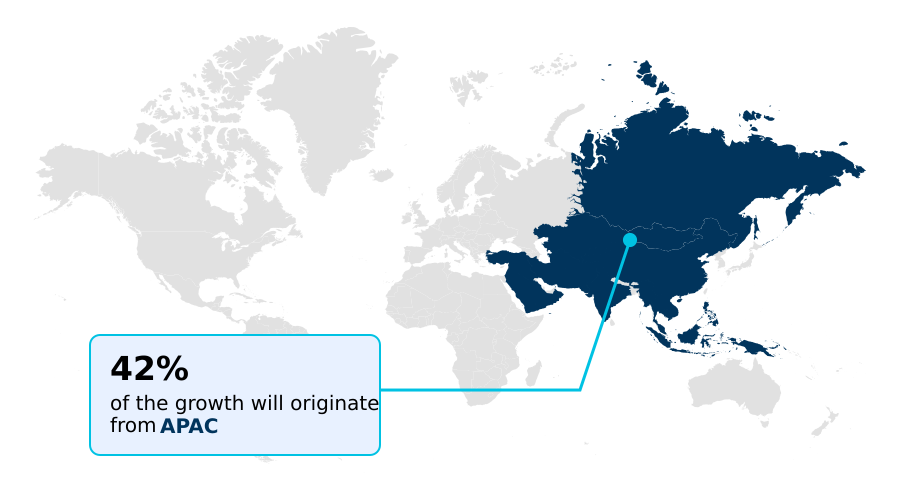
APAC is estimated to contribute 41.8% to the growth of the global market during the forecast period.Technavio’s analysts have elaborately explained the regional trends and drivers that shape the market during the forecast period.
See How Melt Blown Polypropylene Filters Market Demand is Rising in APAC Get Free Sample

The geographic distribution of the Melt Blown Polypropylene Filters market highlights distinct adoption patterns driven by regional industrialization and environmental mandates.

APAC dominates the landscape due to massive municipal infrastructure upgrades across China and India achieving a 45% faster deployment rate of large-scale water purification systems compared to Europe.

In North America the focus remains heavily on precision industrial filtration and pharmaceutical sterile filtration where stringent compliance protocols in sterile processing necessitate specialized cartridges featuring an optimized pore structure.

By leveraging media that guarantees absolute retention ratings North American bioprocessing facilities report a 20% reduction in batch contamination incidents. Meanwhile emerging economies prioritize cost-effective suspended solids removal to meet basic wastewater discharge limits.

These contrasting regional priorities compel filtration manufacturers to diversify their product portfolios balancing high-volume standard pre-filters with premium exact-specification components to capture diverse international demands.

Market Dynamics

Our researchers analyzed the data with 2025 as the base year, along with the key drivers, trends, and challenges. A holistic analysis of drivers will help companies refine their marketing strategies to gain a competitive advantage.

  • The optimization of complex fluid purification systems heavily relies on the strategic deployment of advanced filtration technologies to ensure uninterrupted industrial operations. Facility managers increasingly specify multi zone depth filter cartridges to capture a broader spectrum of particulate sizes within a single component.
  • This structural innovation utilizes engineered gradient density filter media which traps larger contaminants on the exterior while securing microscopic particles deep within the core. A primary operational focus remains reverse osmosis membrane protection as effectively removing suspended solids prevents premature scaling and extends the lifespan of expensive secondary purification assets.
  • Consequently plants integrating these heavy-duty pre-filters observe a 35% improvement in maintenance intervals. Furthermore high pressure pump fouling prevention is critical in large-scale municipal desalination where uninterrupted flow rates are necessary to meet regional water demands. As global environmental agencies enforce stricter industrial effluent discharge limits chemical and manufacturing plants are compelled to upgrade their wastewater treatment trains.
  • By absorbing heavy particulate loads reliably these specialized polypropylene filters enable facilities to achieve rigorous compliance standards while simultaneously optimizing overall processing efficiency and reducing unplanned system downtime.
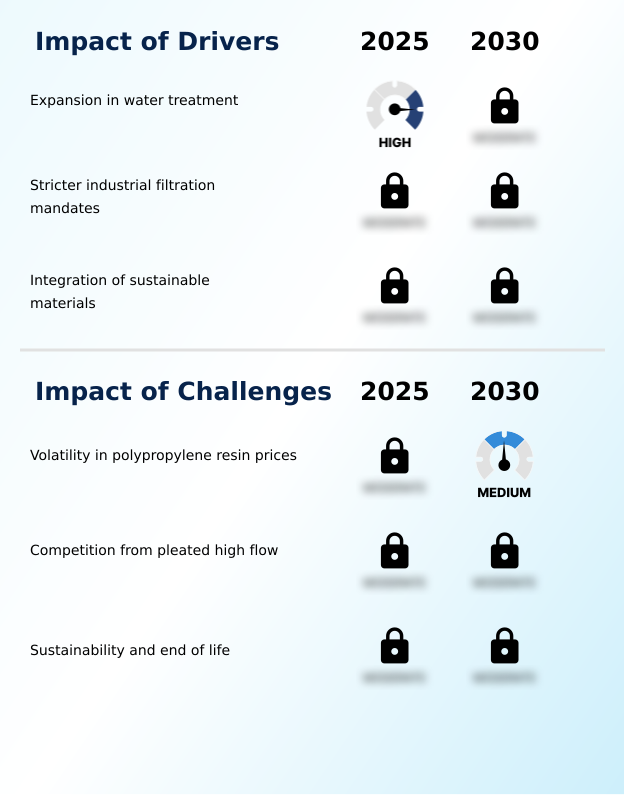
What are the key market drivers leading to the rise in the adoption of Melt Blown Polypropylene Filters Industry?

  • The continuous expansion of advanced water treatment infrastructure acts as the primary driver accelerating market demand.

  • The intensifying global focus on water scarcity and stringent environmental compliance serves as the primary catalyst accelerating Melt Blown Polypropylene Filters adoption.
  • Heavy industries and utility providers are executing massive municipal infrastructure upgrades to ensure reliable access to high purity water for growing populations and complex manufacturing operations.
  • The mandatory enforcement of strict effluent discharge compliance forces chemical processing plants to implement robust pre-filtration stages successfully achieving a 40% improvement in continuous wastewater reclamation efficiency.
  • By integrating specialized polypropylene cartridges facility managers guarantee critical membrane fouling prevention safeguarding delicate reverse osmosis modules from abrasive damage. This proactive approach to particulate fouling mitigation directly extends the operational lifespan of expensive secondary assets by nearly 25%.
  • Consequently businesses experience significantly lower replacement costs and reduced system downtime validating the essential role of depth filters in modern fluid processing.

What are the market trends shaping the Melt Blown Polypropylene Filters Industry?

  • Rapid desalination plant capacity growth serves as a prominent emerging trend shaping the market landscape.

  • The Melt Blown Polypropylene Filters sector is experiencing a rapid technological shift as manufacturers focus on enhancing filtration efficiency and sustainability. Modern depth filtration systems increasingly incorporate advanced virgin polymer resin to ensure consistent fiber integrity and structural stability under high-stress conditions.
  • In massive municipal applications the integration of automated filtration skids has streamlined desalination pretreatment processes yielding a 35% reduction in manual oversight requirements. Plant operators are actively extending backwashing cycles by utilizing cartridges with superior dirt-holding capabilities which lowers water waste by up to 20%.
  • Furthermore forward-thinking extrusion facilities are implementing closed loop recycling protocols to repurpose production scrap without compromising filter performance. These strategic innovations directly improve operational resilience allowing industrial and municipal end-users to achieve rigorous purity standards while simultaneously decreasing overall environmental footprints and equipment maintenance expenditures.

What challenges does the Melt Blown Polypropylene Filters Industry face during its growth?

  • Extreme volatility in polypropylene resin prices remains a major structural challenge impeding steady industry expansion.

  • Extreme volatility in raw material supply chains presents a formidable structural barrier constraining the Melt Blown Polypropylene Filters landscape. Consistent polymeric extrusion relies entirely on the stable availability of specialized petrochemical feedstock which remains highly susceptible to global crude oil price fluctuations.
  • When resin costs surge unexpectedly manufacturing overheads expand rapidly diminishing profit margins for mid-tier nonwoven converters by up to 15%. Maintaining precise microfiber web formation and controlling the variable fiber diameter becomes increasingly complex when alternative lower-grade resins are substituted.
  • Furthermore end-users in the pharmaceutical and chemical sectors demand uncompromising chemical resistance and aggressive chemical compatibility meaning producers cannot compromise on material quality without risking catastrophic filter failure. This continuous financial instability forces procurement teams to maintain costly safety inventories thereby tying up working capital and delaying strategic investments in next-generation manufacturing capabilities.

Exclusive Technavio Analysis on Customer Landscape

The melt blown polypropylene filters market forecasting report includes the adoption lifecycle of the market, covering from the innovator’s stage to the laggard’s stage. It focuses on adoption rates in different regions based on penetration. Furthermore, the melt blown polypropylene filters market report also includes key purchase criteria and drivers of price sensitivity to help companies evaluate and develop their market growth analysis strategies.
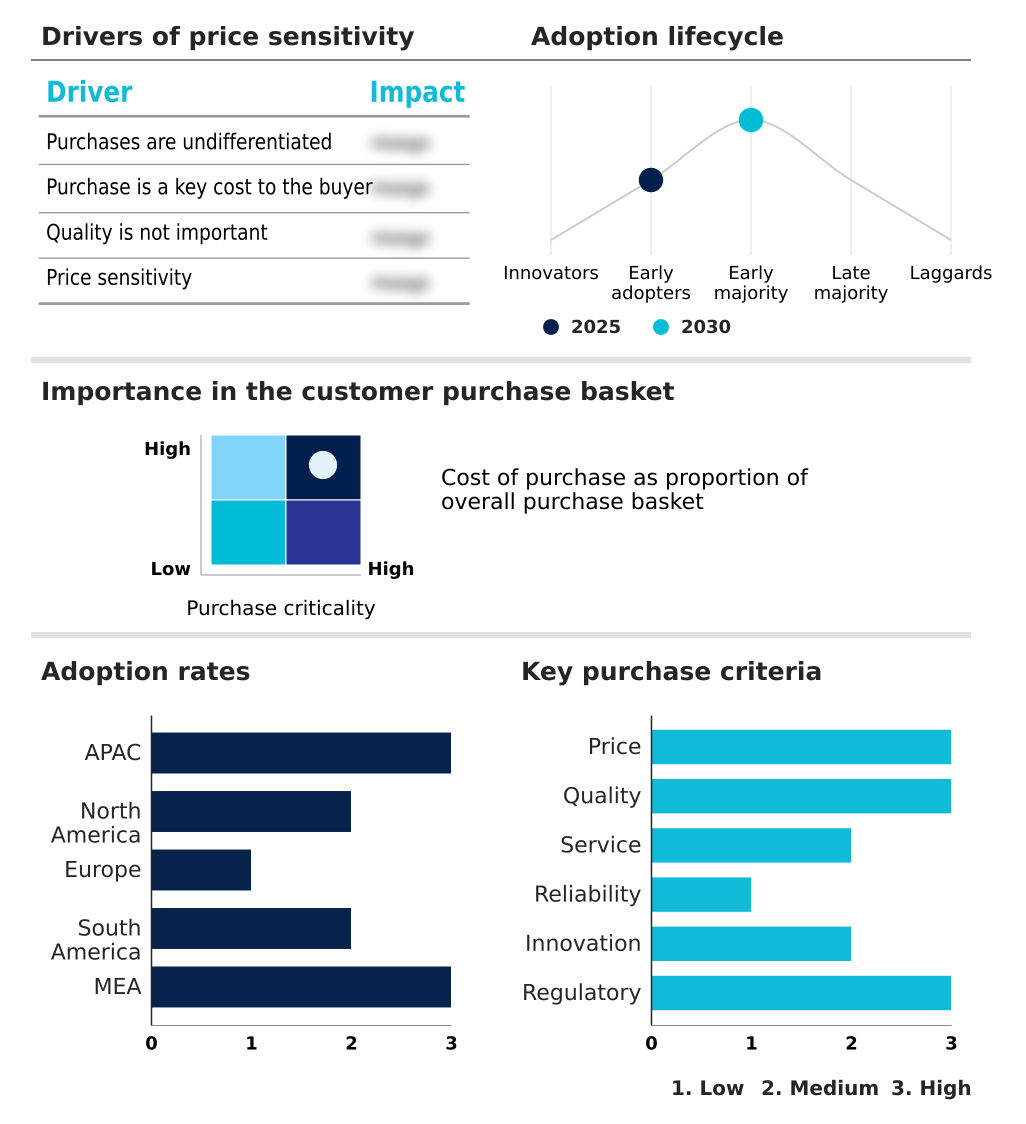
Customer Landscape of Melt Blown Polypropylene Filters Industry

Competitive Landscape

Companies are implementing various strategies, such as strategic alliances, melt blown polypropylene filters market forecast, partnerships, mergers and acquisitions, geographical expansion, and product/service launches, to enhance their presence in the industry.

3M Co. - The organization delivers advanced micro-klean RT and betafine DP series cartridges providing highly efficient depth filtration solutions designed to optimize industrial fluid processing and extend system longevity.

The industry research and growth report includes detailed analyses of the competitive landscape of the market and information about key companies, including:

  • 3M Co.
  • AJR Filtration Inc.
  • Amazon Filters Ltd.
  • Brother Filtration Equipment
  • Clack Corp.
  • Donaldson Co. Inc.
  • Eaton Corp. Plc
  • Entegris Inc.
  • Freudenberg Filter
  • Global Filter LLC
  • Graver Technologies LLC
  • Hengst SE
  • Hollingsworth and Vose
  • Johns Manville Corp.
  • Meissner Filtration Products
  • Pall Corp.
  • Parker Hannifin Corp.
  • Pentair Plc
  • Porvair Filtration Group
  • Veolia Water Technologies
  • Watts Water Technologies Inc.

Qualitative and quantitative analysis of companies has been conducted to help clients understand the wider business environment as well as the strengths and weaknesses of key industry players. Data is qualitatively analyzed to categorize companies as pure play, category-focused, industry-focused, and diversified; it is quantitatively analyzed to categorize companies as dominant, leading, strong, tentative, and weak.

Recent Development and News in Melt blown polypropylene filters market

  • In the Commodity Chemicals industry the widespread implementation of the European Union REACH regulation on synthetic polymer production has accelerated the transition toward high-purity virgin resins directly impacting Melt Blown Polypropylene Filters demand by establishing stricter chemical safety standards for food and beverage processing facilities.
  • The transition toward zero liquid discharge mandates in heavy industrial manufacturing has forced chemical processing plants to implement advanced multi-stage effluent treatment systems directly impacting Melt Blown Polypropylene Filters demand by increasing the requirement for robust pre-filtration to protect downstream ultrafiltration modules.
  • Stricter municipal potable water standards imposed by the US Environmental Protection Agency regarding per- and polyfluoroalkyl substances reduction have driven large-scale utility infrastructure upgrades directly impacting Melt Blown Polypropylene Filters demand as water authorities install extensive cartridge filtration skids ahead of reverse osmosis units.
  • The rapid expansion of global semiconductor fabrication capacity has escalated the consumption of ultra-pure water and electronic-grade process chemicals directly impacting Melt Blown Polypropylene Filters demand by requiring highly calibrated gradient density media to achieve critical particulate reduction benchmarks in microelectronics manufacturing.

Dive into Technavio’s robust research methodology, blending expert interviews, extensive data synthesis, and validated models for unparalleled Melt Blown Polypropylene Filters Market insights. See full methodology.

Market Scope
Page number 296
Base year 2025
Historic period 2020-2024
Forecast period 2026-2030
Growth momentum & CAGR Accelerate at a CAGR of 7.2%
Market growth 2026-2030 USD 1218440.0 thousand
Market structure Fragmented
YoY growth 2025-2026(%) 6.7%
Key countries China, Japan, India, South Korea, Australia, Indonesia, US, Canada, Mexico, Germany, UK, France, Italy, Spain, The Netherlands, Brazil, Argentina, Chile, Saudi Arabia, UAE, South Africa, Turkey and Israel
Competitive landscape Leading Companies, Market Positioning of Companies, Competitive Strategies, and Industry Risks

Request Free Sample

Research Analyst Overview

  • The Melt Blown Polypropylene Filters landscape is undergoing a critical transformation as industrial operators prioritize absolute fluid purity and sustainable processing methodologies. Manufacturers continuously refine fiber extrusion technologies to produce highly specialized depth filter cartridges capable of withstanding aggressive operational environments.
  • A dominant trend shaping boardroom strategies involves the integration of high-performance media to ensure stringent effluent discharge compliance directly influencing corporate capital expenditure decisions. By transitioning to advanced multi-layered filtration structures chemical processing facilities have achieved a 30% reduction in unplanned maintenance downtime caused by particulate fouling.
  • This structural evolution addresses the escalating demand for reliable pre-filtration across large-scale desalination and complex microelectronics manufacturing. Furthermore tightening international environmental mandates compel procurement teams to specify certified chemical-resistant polymer filters to safeguard downstream reverse osmosis membranes.
  • The unwavering industry focus on maximizing dirt-holding capacity and extending service life underscores the vital role these components play in optimizing continuous fluid separation maintaining process integrity and securing long-term operational resilience.

What are the Key Data Covered in this Melt Blown Polypropylene Filters Market Research and Growth Report?

  • What is the expected growth of the Melt Blown Polypropylene Filters Market between 2026 and 2030?

    • USD 1.22 billion, at a CAGR of 7.2%

  • What segmentation does the market report cover?

    • The report is segmented by Type (Liquid, and Air), End-user (Waste water treatment, Food and beverages, Chemical, Pharmaceuticals, and Others), Distribution Channel (Distributors, Direct sales, and Online retail) and Geography (APAC, North America, Europe, South America, Middle East and Africa)

  • Which regions are analyzed in the report?

    • APAC, North America, Europe, South America and Middle East and Africa

  • What are the key growth drivers and market challenges?

    • Expansion in water treatment, Volatility in polypropylene resin prices

  • Who are the major players in the Melt Blown Polypropylene Filters Market?

    • 3M Co., AJR Filtration Inc., Amazon Filters Ltd., Brother Filtration Equipment, Clack Corp., Donaldson Co. Inc., Eaton Corp. Plc, Entegris Inc., Freudenberg Filter, Global Filter LLC, Graver Technologies LLC, Hengst SE, Hollingsworth and Vose, Johns Manville Corp., Meissner Filtration Products, Pall Corp., Parker Hannifin Corp., Pentair Plc, Porvair Filtration Group, Veolia Water Technologies and Watts Water Technologies Inc.

Market Research Insights

  • The Melt Blown Polypropylene Filters Market is rapidly evolving as global industries prioritize stringent contamination control and efficient fluid processing. Manufacturers are increasingly integrating advanced automated filtration skids to ensure continuous operation and regulatory compliance. By optimizing the variable fiber diameter within depth filter cartridges facilities have achieved a 30% improvement in particulate retention efficiency.
  • Furthermore the adoption of closed loop recycling practices for polymer waste has lowered material costs by nearly 15% enhancing overall production sustainability. These measurable operational enhancements highlight how strategic investments in high-performance filtration media directly improve system reliability reduce secondary membrane fouling and generate substantial long-term savings across municipal water reclamation and complex chemical manufacturing sectors.

We can help! Our analysts can customize this melt blown polypropylene filters market research report to meet your requirements.

Get in touch

1. Executive Summary

1.1 Market overview

Executive Summary - Chart on Market Overview
Executive Summary - Data Table on Market Overview
Executive Summary - Chart on Global Market Characteristics
Executive Summary - Chart on Market by Geography
Executive Summary - Chart on Market Segmentation by Type
Executive Summary - Chart on Market Segmentation by End-user
Executive Summary - Chart on Market Segmentation by Distribution Channel
Executive Summary - Chart on Incremental Growth
Executive Summary - Data Table on Incremental Growth
Executive Summary - Chart on Company Market Positioning

2. Technavio Analysis

2.1 Analysis of price sensitivity, lifecycle, customer purchase basket, adoption rates, and purchase criteria

2.2 Criticality of inputs and Factors of differentiation

Chart on Overview on criticality of inputs and factors of differentiation

2.3 Factors of disruption

Chart on Overview on factors of disruption

2.4 Impact of drivers and challenges

Chart on Impact of drivers and challenges in 2025 and 2030

3. Market Landscape

3.1 Market ecosystem

Chart on Parent Market
Data Table on - Parent Market

3.2 Market characteristics

Chart on Market characteristics analysis

3.3 Value chain analysis

Chart on Value chain analysis

4. Market Sizing

4.1 Market definition

Data Table on Offerings of companies included in the market definition

4.2 Market segment analysis

Market segments

4.3 Market size 2025

4.4 Market outlook: Forecast for 2025-2030

Chart on Global - Market size and forecast 2025-2030 ($ thousand)
Data Table on Global - Market size and forecast 2025-2030 ($ thousand)
Chart on Global Market: Year-over-year growth 2025-2030 (%)
Data Table on Global Market: Year-over-year growth 2025-2030 (%)

5. Historic Market Size

5.1 Global Melt Blown Polypropylene Filters Market 2020 - 2024

Historic Market Size - Data Table on Global Melt Blown Polypropylene Filters Market 2020 - 2024 ($ thousand)

5.2 Type segment analysis 2020 - 2024

Historic Market Size - Type Segment 2020 - 2024 ($ thousand)

5.3 End-user segment analysis 2020 - 2024

Historic Market Size - End-user Segment 2020 - 2024 ($ thousand)

5.4 Distribution Channel segment analysis 2020 - 2024

Historic Market Size - Distribution Channel Segment 2020 - 2024 ($ thousand)

5.5 Geography segment analysis 2020 - 2024

Historic Market Size - Geography Segment 2020 - 2024 ($ thousand)

5.6 Country segment analysis 2020 - 2024

Historic Market Size - Country Segment 2020 - 2024 ($ thousand)

6. Qualitative Analysis

6.1 Impact of AI on Global Melt Blown Polypropylene Filters Market

6.2 Impact of geopolitical conflicts on Global Melt Blown Polypropylene Filters Market

7. Five Forces Analysis

7.1 Five forces summary

Five forces analysis - Comparison between 2025 and 2030

7.2 Bargaining power of buyers

Bargaining power of buyers - Impact of key factors 2025 and 2030

7.3 Bargaining power of suppliers

Bargaining power of suppliers - Impact of key factors in 2025 and 2030

7.4 Threat of new entrants

Threat of new entrants - Impact of key factors in 2025 and 2030

7.5 Threat of substitutes

Threat of substitutes - Impact of key factors in 2025 and 2030

7.6 Threat of rivalry

Threat of rivalry - Impact of key factors in 2025 and 2030

7.7 Market condition

Chart on Market condition - Five forces 2025 and 2030

8. Market Segmentation by Type

8.1 Market segments

Chart on Type - Market share 2025-2030 (%)
Data Table on Type - Market share 2025-2030 (%)

8.2 Comparison by Type

Chart on Comparison by Type
Data Table on Comparison by Type

8.3 Liquid - Market size and forecast 2025-2030

Chart on Liquid - Market size and forecast 2025-2030 ($ thousand)
Data Table on Liquid - Market size and forecast 2025-2030 ($ thousand)
Chart on Liquid - Year-over-year growth 2025-2030 (%)
Data Table on Liquid - Year-over-year growth 2025-2030 (%)

8.4 Air - Market size and forecast 2025-2030

Chart on Air - Market size and forecast 2025-2030 ($ thousand)
Data Table on Air - Market size and forecast 2025-2030 ($ thousand)
Chart on Air - Year-over-year growth 2025-2030 (%)
Data Table on Air - Year-over-year growth 2025-2030 (%)

8.5 Market opportunity by Type

Market opportunity by Type ($ thousand)
Data Table on Market opportunity by Type ($ thousand)

9. Market Segmentation by End-user

9.1 Market segments

Chart on End-user - Market share 2025-2030 (%)
Data Table on End-user - Market share 2025-2030 (%)

9.2 Comparison by End-user

Chart on Comparison by End-user
Data Table on Comparison by End-user

9.3 Waste water treatment - Market size and forecast 2025-2030

Chart on Waste water treatment - Market size and forecast 2025-2030 ($ thousand)
Data Table on Waste water treatment - Market size and forecast 2025-2030 ($ thousand)
Chart on Waste water treatment - Year-over-year growth 2025-2030 (%)
Data Table on Waste water treatment - Year-over-year growth 2025-2030 (%)

9.4 Food and beverages - Market size and forecast 2025-2030

Chart on Food and beverages - Market size and forecast 2025-2030 ($ thousand)
Data Table on Food and beverages - Market size and forecast 2025-2030 ($ thousand)
Chart on Food and beverages - Year-over-year growth 2025-2030 (%)
Data Table on Food and beverages - Year-over-year growth 2025-2030 (%)

9.5 Chemical - Market size and forecast 2025-2030

Chart on Chemical - Market size and forecast 2025-2030 ($ thousand)
Data Table on Chemical - Market size and forecast 2025-2030 ($ thousand)
Chart on Chemical - Year-over-year growth 2025-2030 (%)
Data Table on Chemical - Year-over-year growth 2025-2030 (%)

9.6 Pharmaceuticals - Market size and forecast 2025-2030

Chart on Pharmaceuticals - Market size and forecast 2025-2030 ($ thousand)
Data Table on Pharmaceuticals - Market size and forecast 2025-2030 ($ thousand)
Chart on Pharmaceuticals - Year-over-year growth 2025-2030 (%)
Data Table on Pharmaceuticals - Year-over-year growth 2025-2030 (%)

9.7 Others - Market size and forecast 2025-2030

Chart on Others - Market size and forecast 2025-2030 ($ thousand)
Data Table on Others - Market size and forecast 2025-2030 ($ thousand)
Chart on Others - Year-over-year growth 2025-2030 (%)
Data Table on Others - Year-over-year growth 2025-2030 (%)

9.8 Market opportunity by End-user

Market opportunity by End-user ($ thousand)
Data Table on Market opportunity by End-user ($ thousand)

10. Market Segmentation by Distribution Channel

10.1 Market segments

Chart on Distribution Channel - Market share 2025-2030 (%)
Data Table on Distribution Channel - Market share 2025-2030 (%)

10.2 Comparison by Distribution Channel

Chart on Comparison by Distribution Channel
Data Table on Comparison by Distribution Channel

10.3 Distributors - Market size and forecast 2025-2030

Chart on Distributors - Market size and forecast 2025-2030 ($ thousand)
Data Table on Distributors - Market size and forecast 2025-2030 ($ thousand)
Chart on Distributors - Year-over-year growth 2025-2030 (%)
Data Table on Distributors - Year-over-year growth 2025-2030 (%)

10.4 Direct sales - Market size and forecast 2025-2030

Chart on Direct sales - Market size and forecast 2025-2030 ($ thousand)
Data Table on Direct sales - Market size and forecast 2025-2030 ($ thousand)
Chart on Direct sales - Year-over-year growth 2025-2030 (%)
Data Table on Direct sales - Year-over-year growth 2025-2030 (%)

10.5 Online retail - Market size and forecast 2025-2030

Chart on Online retail - Market size and forecast 2025-2030 ($ thousand)
Data Table on Online retail - Market size and forecast 2025-2030 ($ thousand)
Chart on Online retail - Year-over-year growth 2025-2030 (%)
Data Table on Online retail - Year-over-year growth 2025-2030 (%)

10.6 Market opportunity by Distribution Channel

Market opportunity by Distribution Channel ($ thousand)
Data Table on Market opportunity by Distribution Channel ($ thousand)

11. Customer Landscape

11.1 Customer landscape overview

Analysis of price sensitivity, lifecycle, customer purchase basket, adoption rates, and purchase criteria

12. Geographic Landscape

12.1 Geographic segmentation

Chart on Market share by geography 2025-2030 (%)
Data Table on Market share by geography 2025-2030 (%)

12.2 Geographic comparison

Chart on Geographic comparison
Data Table on Geographic comparison

12.3 APAC - Market size and forecast 2025-2030

Chart on APAC - Market size and forecast 2025-2030 ($ thousand)
Data Table on APAC - Market size and forecast 2025-2030 ($ thousand)
Chart on APAC - Year-over-year growth 2025-2030 (%)
Data Table on APAC - Year-over-year growth 2025-2030 (%)
Chart on Regional Comparison - APAC
Data Table on Regional Comparison - APAC

12.3.1 China - Market size and forecast 2025-2030

Chart on China - Market size and forecast 2025-2030 ($ thousand)
Data Table on China - Market size and forecast 2025-2030 ($ thousand)
Chart on China - Year-over-year growth 2025-2030 (%)
Data Table on China - Year-over-year growth 2025-2030 (%)

12.3.2 Japan - Market size and forecast 2025-2030

Chart on Japan - Market size and forecast 2025-2030 ($ thousand)
Data Table on Japan - Market size and forecast 2025-2030 ($ thousand)
Chart on Japan - Year-over-year growth 2025-2030 (%)
Data Table on Japan - Year-over-year growth 2025-2030 (%)

12.3.3 India - Market size and forecast 2025-2030

Chart on India - Market size and forecast 2025-2030 ($ thousand)
Data Table on India - Market size and forecast 2025-2030 ($ thousand)
Chart on India - Year-over-year growth 2025-2030 (%)
Data Table on India - Year-over-year growth 2025-2030 (%)

12.3.4 South Korea - Market size and forecast 2025-2030

Chart on South Korea - Market size and forecast 2025-2030 ($ thousand)
Data Table on South Korea - Market size and forecast 2025-2030 ($ thousand)
Chart on South Korea - Year-over-year growth 2025-2030 (%)
Data Table on South Korea - Year-over-year growth 2025-2030 (%)

12.3.5 Australia - Market size and forecast 2025-2030

Chart on Australia - Market size and forecast 2025-2030 ($ thousand)
Data Table on Australia - Market size and forecast 2025-2030 ($ thousand)
Chart on Australia - Year-over-year growth 2025-2030 (%)
Data Table on Australia - Year-over-year growth 2025-2030 (%)

12.3.6 Indonesia - Market size and forecast 2025-2030

Chart on Indonesia - Market size and forecast 2025-2030 ($ thousand)
Data Table on Indonesia - Market size and forecast 2025-2030 ($ thousand)
Chart on Indonesia - Year-over-year growth 2025-2030 (%)
Data Table on Indonesia - Year-over-year growth 2025-2030 (%)

12.4 North America - Market size and forecast 2025-2030

Chart on North America - Market size and forecast 2025-2030 ($ thousand)
Data Table on North America - Market size and forecast 2025-2030 ($ thousand)
Chart on North America - Year-over-year growth 2025-2030 (%)
Data Table on North America - Year-over-year growth 2025-2030 (%)
Chart on Regional Comparison - North America
Data Table on Regional Comparison - North America

12.4.1 US - Market size and forecast 2025-2030

Chart on US - Market size and forecast 2025-2030 ($ thousand)
Data Table on US - Market size and forecast 2025-2030 ($ thousand)
Chart on US - Year-over-year growth 2025-2030 (%)
Data Table on US - Year-over-year growth 2025-2030 (%)

12.4.2 Canada - Market size and forecast 2025-2030

Chart on Canada - Market size and forecast 2025-2030 ($ thousand)
Data Table on Canada - Market size and forecast 2025-2030 ($ thousand)
Chart on Canada - Year-over-year growth 2025-2030 (%)
Data Table on Canada - Year-over-year growth 2025-2030 (%)

12.4.3 Mexico - Market size and forecast 2025-2030

Chart on Mexico - Market size and forecast 2025-2030 ($ thousand)
Data Table on Mexico - Market size and forecast 2025-2030 ($ thousand)
Chart on Mexico - Year-over-year growth 2025-2030 (%)
Data Table on Mexico - Year-over-year growth 2025-2030 (%)

12.5 Europe - Market size and forecast 2025-2030

Chart on Europe - Market size and forecast 2025-2030 ($ thousand)
Data Table on Europe - Market size and forecast 2025-2030 ($ thousand)
Chart on Europe - Year-over-year growth 2025-2030 (%)
Data Table on Europe - Year-over-year growth 2025-2030 (%)
Chart on Regional Comparison - Europe
Data Table on Regional Comparison - Europe

12.5.1 Germany - Market size and forecast 2025-2030

Chart on Germany - Market size and forecast 2025-2030 ($ thousand)
Data Table on Germany - Market size and forecast 2025-2030 ($ thousand)
Chart on Germany - Year-over-year growth 2025-2030 (%)
Data Table on Germany - Year-over-year growth 2025-2030 (%)

12.5.2 UK - Market size and forecast 2025-2030

Chart on UK - Market size and forecast 2025-2030 ($ thousand)
Data Table on UK - Market size and forecast 2025-2030 ($ thousand)
Chart on UK - Year-over-year growth 2025-2030 (%)
Data Table on UK - Year-over-year growth 2025-2030 (%)

12.5.3 France - Market size and forecast 2025-2030

Chart on France - Market size and forecast 2025-2030 ($ thousand)
Data Table on France - Market size and forecast 2025-2030 ($ thousand)
Chart on France - Year-over-year growth 2025-2030 (%)
Data Table on France - Year-over-year growth 2025-2030 (%)

12.5.4 Italy - Market size and forecast 2025-2030

Chart on Italy - Market size and forecast 2025-2030 ($ thousand)
Data Table on Italy - Market size and forecast 2025-2030 ($ thousand)
Chart on Italy - Year-over-year growth 2025-2030 (%)
Data Table on Italy - Year-over-year growth 2025-2030 (%)

12.5.5 Spain - Market size and forecast 2025-2030

Chart on Spain - Market size and forecast 2025-2030 ($ thousand)
Data Table on Spain - Market size and forecast 2025-2030 ($ thousand)
Chart on Spain - Year-over-year growth 2025-2030 (%)
Data Table on Spain - Year-over-year growth 2025-2030 (%)

12.5.6 The Netherlands - Market size and forecast 2025-2030

Chart on The Netherlands - Market size and forecast 2025-2030 ($ thousand)
Data Table on The Netherlands - Market size and forecast 2025-2030 ($ thousand)
Chart on The Netherlands - Year-over-year growth 2025-2030 (%)
Data Table on The Netherlands - Year-over-year growth 2025-2030 (%)

12.6 South America - Market size and forecast 2025-2030

Chart on South America - Market size and forecast 2025-2030 ($ thousand)
Data Table on South America - Market size and forecast 2025-2030 ($ thousand)
Chart on South America - Year-over-year growth 2025-2030 (%)
Data Table on South America - Year-over-year growth 2025-2030 (%)
Chart on Regional Comparison - South America
Data Table on Regional Comparison - South America

12.6.1 Brazil - Market size and forecast 2025-2030

Chart on Brazil - Market size and forecast 2025-2030 ($ thousand)
Data Table on Brazil - Market size and forecast 2025-2030 ($ thousand)
Chart on Brazil - Year-over-year growth 2025-2030 (%)
Data Table on Brazil - Year-over-year growth 2025-2030 (%)

12.6.2 Argentina - Market size and forecast 2025-2030

Chart on Argentina - Market size and forecast 2025-2030 ($ thousand)
Data Table on Argentina - Market size and forecast 2025-2030 ($ thousand)
Chart on Argentina - Year-over-year growth 2025-2030 (%)
Data Table on Argentina - Year-over-year growth 2025-2030 (%)

12.6.3 Chile - Market size and forecast 2025-2030

Chart on Chile - Market size and forecast 2025-2030 ($ thousand)
Data Table on Chile - Market size and forecast 2025-2030 ($ thousand)
Chart on Chile - Year-over-year growth 2025-2030 (%)
Data Table on Chile - Year-over-year growth 2025-2030 (%)

12.7 Middle East and Africa - Market size and forecast 2025-2030

Chart on Middle East and Africa - Market size and forecast 2025-2030 ($ thousand)
Data Table on Middle East and Africa - Market size and forecast 2025-2030 ($ thousand)
Chart on Middle East and Africa - Year-over-year growth 2025-2030 (%)
Data Table on Middle East and Africa - Year-over-year growth 2025-2030 (%)
Chart on Regional Comparison - Middle East and Africa
Data Table on Regional Comparison - Middle East and Africa

12.7.1 Saudi Arabia - Market size and forecast 2025-2030

Chart on Saudi Arabia - Market size and forecast 2025-2030 ($ thousand)
Data Table on Saudi Arabia - Market size and forecast 2025-2030 ($ thousand)
Chart on Saudi Arabia - Year-over-year growth 2025-2030 (%)
Data Table on Saudi Arabia - Year-over-year growth 2025-2030 (%)

12.7.2 UAE - Market size and forecast 2025-2030

Chart on UAE - Market size and forecast 2025-2030 ($ thousand)
Data Table on UAE - Market size and forecast 2025-2030 ($ thousand)
Chart on UAE - Year-over-year growth 2025-2030 (%)
Data Table on UAE - Year-over-year growth 2025-2030 (%)

12.7.3 South Africa - Market size and forecast 2025-2030

Chart on South Africa - Market size and forecast 2025-2030 ($ thousand)
Data Table on South Africa - Market size and forecast 2025-2030 ($ thousand)
Chart on South Africa - Year-over-year growth 2025-2030 (%)
Data Table on South Africa - Year-over-year growth 2025-2030 (%)

12.7.4 Turkey - Market size and forecast 2025-2030

Chart on Turkey - Market size and forecast 2025-2030 ($ thousand)
Data Table on Turkey - Market size and forecast 2025-2030 ($ thousand)
Chart on Turkey - Year-over-year growth 2025-2030 (%)
Data Table on Turkey - Year-over-year growth 2025-2030 (%)

12.7.5 Israel - Market size and forecast 2025-2030

Chart on Israel - Market size and forecast 2025-2030 ($ thousand)
Data Table on Israel - Market size and forecast 2025-2030 ($ thousand)
Chart on Israel - Year-over-year growth 2025-2030 (%)
Data Table on Israel - Year-over-year growth 2025-2030 (%)

12.8 Market opportunity by geography

Market opportunity by geography ($ thousand)
Data Tables on Market opportunity by geography ($ thousand)

13. Drivers, Challenges, and Opportunity

13.1 Market drivers

Expansion in water treatment
Stricter industrial filtration mandates
Integration of sustainable materials

13.2 Market challenges

Volatility in polypropylene resin prices
Competition from pleated high flow
Sustainability and end of life

13.3 Impact of drivers and challenges

Impact of drivers and challenges in 2025 and 2030

13.4 Market opportunities

Rapid desalination plant capacity growth
Proliferation of chemical processing plants
Rising automation in industrial filtration

14. Competitive Landscape

14.1 Overview

14.2

Overview on criticality of inputs and factors of differentiation

14.3 Landscape disruption

Overview on factors of disruption

14.4 Industry risks

Impact of key risks on business

15. Competitive Analysis

15.1 Companies profiled

Companies covered

15.2 Company ranking index

15.3 Market positioning of companies

Matrix on companies position and classification

15.4 3M Co.

3M Co. - Overview
3M Co. - Business segments
3M Co. - Key news
3M Co. - Key offerings
3M Co. - Segment focus
SWOT

15.5 AJR Filtration Inc.

AJR Filtration Inc. - Overview
AJR Filtration Inc. - Product / Service
AJR Filtration Inc. - Key offerings
SWOT

15.6 Amazon Filters Ltd.

Amazon Filters Ltd. - Overview
Amazon Filters Ltd. - Product / Service
Amazon Filters Ltd. - Key offerings
SWOT

15.7 Clack Corp.

Clack Corp. - Overview
Clack Corp. - Product / Service
Clack Corp. - Key offerings
SWOT

15.8 Donaldson Co. Inc.

Donaldson Co. Inc. - Overview
Donaldson Co. Inc. - Business segments
Donaldson Co. Inc. - Key news
Donaldson Co. Inc. - Key offerings
Donaldson Co. Inc. - Segment focus
SWOT

15.9 Eaton Corp. Plc

Eaton Corp. Plc - Overview
Eaton Corp. Plc - Business segments
Eaton Corp. Plc - Key news
Eaton Corp. Plc - Key offerings
Eaton Corp. Plc - Segment focus
SWOT

15.10 Entegris Inc.

Entegris Inc. - Overview
Entegris Inc. - Business segments
Entegris Inc. - Key offerings
Entegris Inc. - Segment focus
SWOT

15.11 Freudenberg Filter

Freudenberg Filter - Overview
Freudenberg Filter - Product / Service
Freudenberg Filter - Key offerings
SWOT

15.12 Hengst SE

Hengst SE - Overview
Hengst SE - Product / Service
Hengst SE - Key offerings
SWOT

15.13 Hollingsworth and Vose

Hollingsworth and Vose - Overview
Hollingsworth and Vose - Product / Service
Hollingsworth and Vose - Key offerings
SWOT

15.14 Johns Manville Corp.

Johns Manville Corp. - Overview
Johns Manville Corp. - Product / Service
Johns Manville Corp. - Key offerings
SWOT

15.15 Parker Hannifin Corp.

Parker Hannifin Corp. - Overview
Parker Hannifin Corp. - Business segments
Parker Hannifin Corp. - Key news
Parker Hannifin Corp. - Key offerings
Parker Hannifin Corp. - Segment focus
SWOT

15.16 Pentair Plc

Pentair Plc - Overview
Pentair Plc - Business segments
Pentair Plc - Key news
Pentair Plc - Key offerings
Pentair Plc - Segment focus
SWOT

15.17 Veolia Water Technologies

Veolia Water Technologies - Overview
Veolia Water Technologies - Product / Service
Veolia Water Technologies - Key offerings
SWOT

15.18 Watts Water Technologies Inc.

Watts Water Technologies Inc. - Overview
Watts Water Technologies Inc. - Product / Service
Watts Water Technologies Inc. - Key news
Watts Water Technologies Inc. - Key offerings
SWOT

16. Appendix

16.1 Scope of the report

Market definition
Objectives
Notes and caveats

16.2 Inclusions and exclusions checklist

Inclusions checklist
Exclusions checklist

16.3 Currency conversion rates for US$

16.4 Research methodology

16.5 Data procurement

Information sources

16.6 Data validation

16.7 Validation techniques employed for market sizing

16.8 Data synthesis

16.9 360 degree market analysis

16.10 List of abbreviations

Research Methodology

Technavio presents a detailed picture of the market by way of study, synthesis, and summation of data from multiple sources. The analysts have presented the various facets of the market with a particular focus on identifying the key industry influencers. The data thus presented is comprehensive, reliable, and the result of extensive research, both primary and secondary.

INFORMATION SOURCES

Primary sources

  • Manufacturers and suppliers
  • Channel partners
  • Industry experts
  • Strategic decision makers

Secondary sources

  • Industry journals and periodicals
  • Government data
  • Financial reports of key industry players
  • Historical data
  • Press releases

DATA ANALYSIS

Data Synthesis

  • Collation of data
  • Estimation of key figures
  • Analysis of derived insights

Data Validation

  • Triangulation with data models
  • Reference against proprietary databases
  • Corroboration with industry experts

REPORT WRITING

Qualitative

  • Market drivers
  • Market challenges
  • Market trends
  • Five forces analysis

Quantitative

  • Market size and forecast
  • Market segmentation
  • Geographical insights
  • Competitive landscape

Interested in this report?

Get your sample now to see our research methodology and insights!

Download Now

Frequently Asked Questions

Melt Blown Polypropylene Filters market growth will increase by USD 1218440.0 thousand thousand during 2026-2030.

The Melt Blown Polypropylene Filters market is expected to grow at a CAGR of 7.2% during 2026-2030.

Melt Blown Polypropylene Filters market is segmented by Type (Liquid, Air) End-user (Waste water treatment, Food and beverages, Chemical, Pharmaceuticals, Others) Distribution channel (Distributors, Direct sales, Online retail)

3M Co., AJR Filtration Inc., Amazon Filters Ltd., Brother Filtration Equipment, Clack Corp., Donaldson Co. Inc., Eaton Corp. Plc, Entegris Inc., Freudenberg Filter, Global Filter LLC, Graver Technologies LLC, Hengst SE, Hollingsworth and Vose, Johns Manville Corp., Meissner Filtration Products, Pall Corp., Parker Hannifin Corp., Pentair Plc, Porvair Filtration Group, Veolia Water Technologies, Watts Water Technologies Inc. are a few of the key vendors in the Melt Blown Polypropylene Filters market.

APAC will register the highest growth rate of 41.8% among the other regions. Therefore, the Melt Blown Polypropylene Filters market in APAC is expected to garner significant business opportunities for the vendors during the forecast period.

China, Japan, India, South Korea, Australia, Indonesia, US, Canada, Mexico, Germany, UK, France, Italy, Spain, The Netherlands, Brazil, Argentina, Chile, Saudi Arabia, UAE, South Africa, Turkey, Israel

  • Expansion in water treatment is the driving factor this market.

The Melt Blown Polypropylene Filters market vendors should focus on grabbing business opportunities from the Type segment as it accounted for the largest market share in the base year.
RIA - Research AI Assistant
Ask RIA
