Industrial Food And Beverage Filtration Systems Market Analysis, Size, and Forecast 2026-2030: Europe (Germany, France, and UK), APAC (China, Japan, and India), North America (US, Canada, and Mexico), South America (Brazil, Argentina, and Chile), Middle East and Africa (Saudi Arabia, UAE, and South Africa), and Rest of World (ROW)

Industrial Food And Beverage Filtration Systems Market Analysis, Size, and Forecast 2026-2030:
Europe (Germany, France, and UK), APAC (China, Japan, and India), North America (US, Canada, and Mexico), South America (Brazil, Argentina, and Chile), Middle East and Africa (Saudi Arabia, UAE, and South Africa), and Rest of World (ROW)

Published: Oct 2026 307 Pages SKU: IRTNTR40902

Market Overview at a Glance

$3.59 B
Market Opportunity
13.5%
CAGR 2025 - 2030
30.2%
Europe Growth
$2.13 B
Liquid filtration systems segment 2024

Industrial Food And Beverage Filtration Systems Market Size 2026-2030

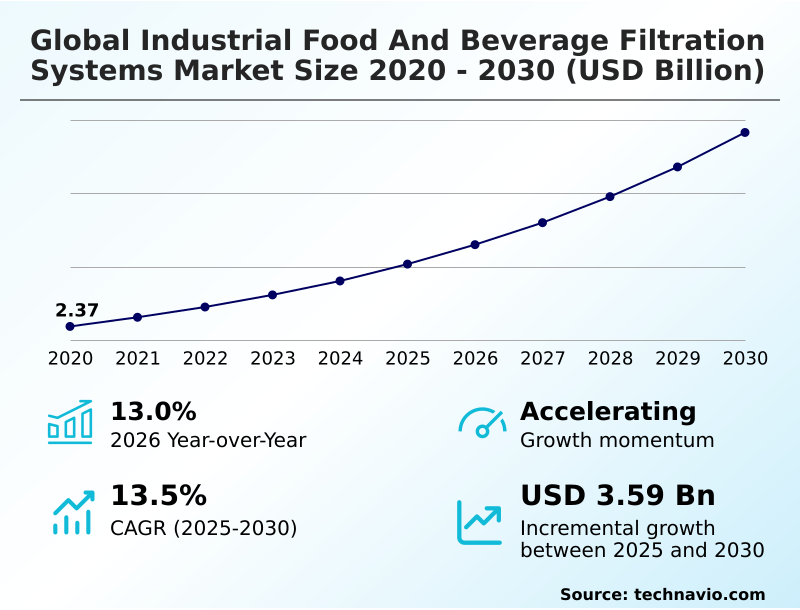
The industrial food and beverage filtration systems market size is valued to increase by USD 3.59 billion, at a CAGR of 13.5% from 2025 to 2030. Increasingly stringent food safety regulations and quality standards will drive the industrial food and beverage filtration systems market.

Major Market Trends & Insights

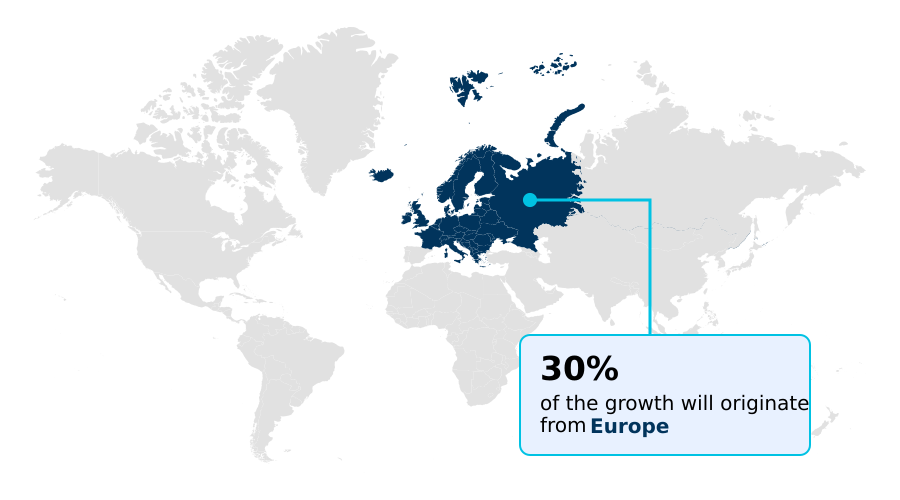
  • Europe dominated the market and accounted for a 30.2% growth during the forecast period.
  • By Product - Liquid filtration systems segment was valued at USD 2.13 billion in 2024
  • By Application - Beverages segment accounted for the largest market revenue share in 2024

Market Size & Forecast

  • Market Opportunities: USD 5.29 billion
  • Market Future Opportunities: USD 3.59 billion
  • CAGR from 2025 to 2030 : 13.5%

Market Summary

  • The Industrial Food And Beverage Filtration Systems exhibits robust expansion driven by the critical necessity to maintain absolute product purity and operational efficiency across complex manufacturing environments. Processors face intense pressure to consistently deliver safe, high-quality consumables, making advanced separation hardware an indispensable asset.
  • Increasingly stringent food safety regulations mandate the removal of microscopic pathogens, acting as a primary driver that forces facilities to abandon outdated purification methods in favor of high-performance membrane architectures. Conversely, the high initial capital investment required for these sophisticated installations remains a formidable challenge, often delaying modernization efforts for mid-tier producers.
  • In a real-world supply chain scenario, transitioning from traditional thermal pasteurization to advanced cold sterilization allows dairy cooperatives to extend product shelf life while preserving delicate nutritional profiles. Facilities implementing these upgraded setups report a 35% reduction in unplanned maintenance downtime compared to legacy configurations.
  • By integrating smart monitoring capabilities, manufacturers optimize their resource utilization and ensure unwavering compliance with international health directives.

What will be the Size of the Industrial Food And Beverage Filtration Systems Market during the forecast period?
Get Key Insights on Market Forecast (PDF) Get Free Sample

How is the Industrial Food And Beverage Filtration Systems Market Segmented?

The industrial food and beverage filtration systems industry research report provides comprehensive data (region-wise segment analysis), with forecasts and estimates in "USD million" for the period 2026-2030, as well as historical data from 2020-2024 for the following segments.

  • Product
    • Liquid filtration systems
    • Air filtration systems
  • Application
    • Beverages
    • Dairy
    • Food and ingredients
  • Type
    • Dust collector
    • Cartridge collector
    • Baghouse filter
    • Basket centrifuges
    • Others
  • Geography
    • Europe
      • Germany
      • France
      • UK
      • Italy
      • Spain
      • The Netherlands
    • APAC
      • China
      • Japan
      • India
      • Australia
      • South Korea
      • Singapore
    • North America
      • US
      • Canada
      • Mexico
    • South America
      • Brazil
      • Argentina
      • Chile
    • Middle East and Africa
      • Saudi Arabia
      • UAE
      • South Africa
      • Egypt
      • Turkey

By Product Insights

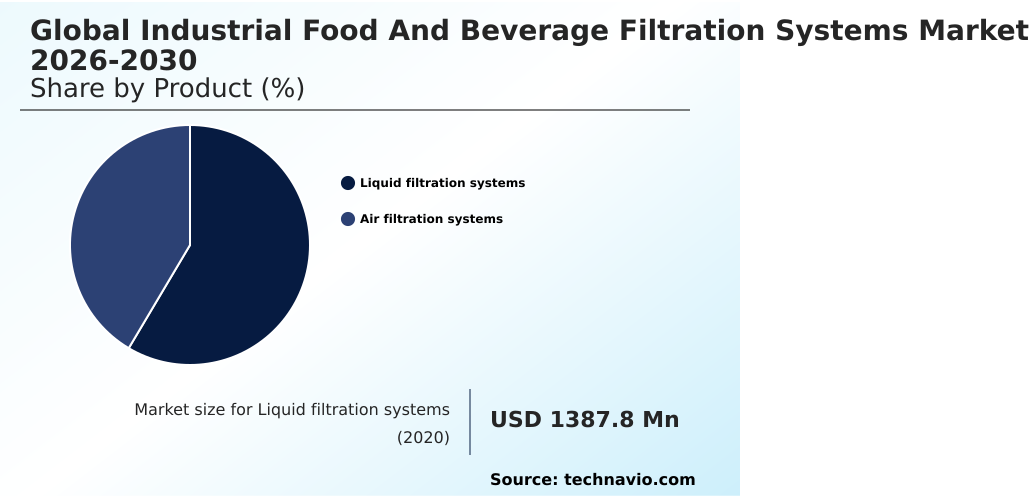
The liquid filtration systems segment is estimated to witness significant growth during the forecast period.

Liquid processing environments demand rigorous membrane fouling mitigation and reverse osmosis purification to maintain operational throughput. Advanced ultrafiltration protein concentration and microfiltration cold sterilization directly eliminate the need for thermal treatments, enabling non-thermal preservation while supporting clean-label ingredient processing.

By leveraging nanofiltration demineralization, facilities achieve continuous flux optimization and transform waste into valuable byproducts via process stream valorization. The integration of these advanced configurations allows processors to execute zero liquid discharge integration, dramatically lowering environmental footprints.

Strategically, upgrading separation modules yields measurable results, such as a 22% improvement in overall equipment effectiveness by minimizing unscheduled cleaning stops.

This structural shift ensures that complex liquid matrices are processed with unprecedented precision, directly impacting product consistency and resource efficiency across high-volume production lines.
Get Free Sample

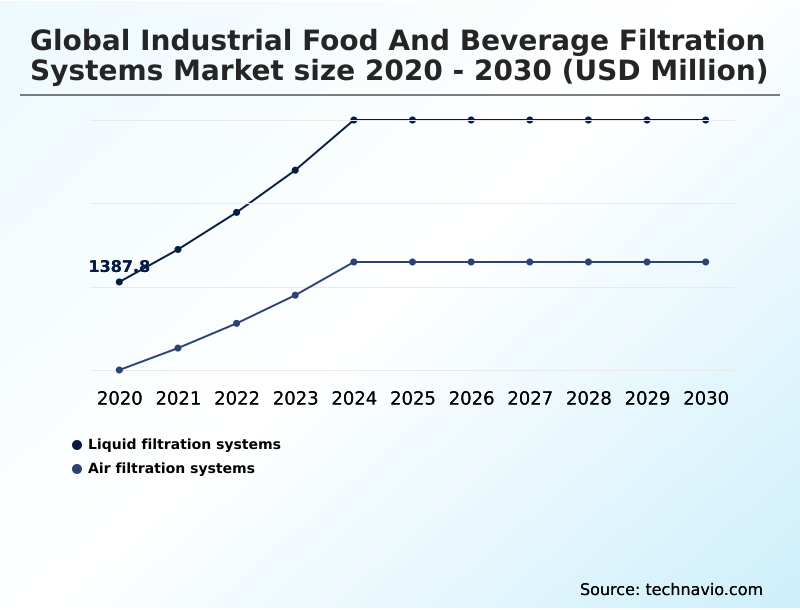
The Liquid filtration systems segment was valued at USD 2.13 billion in 2024 and showed a gradual increase during the forecast period.
Get Free Sample

Regional Analysis

Europe is estimated to contribute 30.2% to the growth of the global market during the forecast period.Technavio’s analysts have elaborately explained the regional trends and drivers that shape the market during the forecast period.
See How Industrial Food And Beverage Filtration Systems Market Demand is Rising in Europe Get Free Sample

Regional disparities in the Industrial Food And Beverage Filtration Systems heavily influence the adoption of advanced purification infrastructure.

Europe leads with stringent environmental mandates, where the implementation of crossflow clarification and clean-in-place automation achieves a 35% higher water recovery rate compared to standard facilities in South America.

In APAC, rapid industrialization drives the deployment of hygienic equipment design, resulting in a 20% acceleration in processing throughput for mid-sized beverage producers.

Facilities across North America heavily utilize transmembrane pressure monitoring alongside precise turbidity sensor integration to optimize fluid dynamics. By integrating automated sanitary valve configuration and establishing robust aseptic packaging environments, processors successfully lower batch rejection rates by 18%.

Utilizing differential pressure tracking and predictive maintenance alerts ensures that complex processing matrices operate flawlessly. Furthermore, hydrophilic surface modification on membranes extends operational lifespans, directly enhancing compliance and reducing overall maintenance expenditures.

Market Dynamics

Our researchers analyzed the data with 2025 as the base year, along with the key drivers, trends, and challenges. A holistic analysis of drivers will help companies refine their marketing strategies to gain a competitive advantage.

  • The strategic deployment of advanced separation architecture is fundamentally transforming operational paradigms within the Industrial Food And Beverage Filtration Systems. Ensuring absolute microbial stabilization in liquid processing has become non-negotiable for manufacturers aiming to produce premium, clean-label beverages without compromising delicate flavor profiles.
  • As processors handle increasingly complex and viscous ingredient streams, maintaining membrane longevity in aggressive environments is critical to sustaining high-volume production runs and avoiding costly, unplanned downtime. Facilities prioritizing targeted protein isolate yield optimization techniques consistently achieve a 25% higher raw material utilization efficiency compared to those relying on legacy separation methods, directly impacting the bottom line.
  • Concurrently, strict occupational safety standards dictate the necessity for comprehensive particulate emission control in milling operations, safeguarding both the workforce and the surrounding facility infrastructure from volatile combustible dust hazards. To address compounding utility costs and environmental regulatory pressures, operators are rapidly integrating energy efficient permeate recovery systems into their wastewater treatment protocols.
  • This holistic approach to resource management allows plants to recycle vast quantities of process water back into non-contact utility applications, drastically shrinking their ecological footprint.
  • By aligning these sophisticated technological interventions with core business functions such as supply chain planning and compliance management, manufacturers not only elevate their product quality but also secure a decisive competitive advantage in a heavily scrutinized sector.
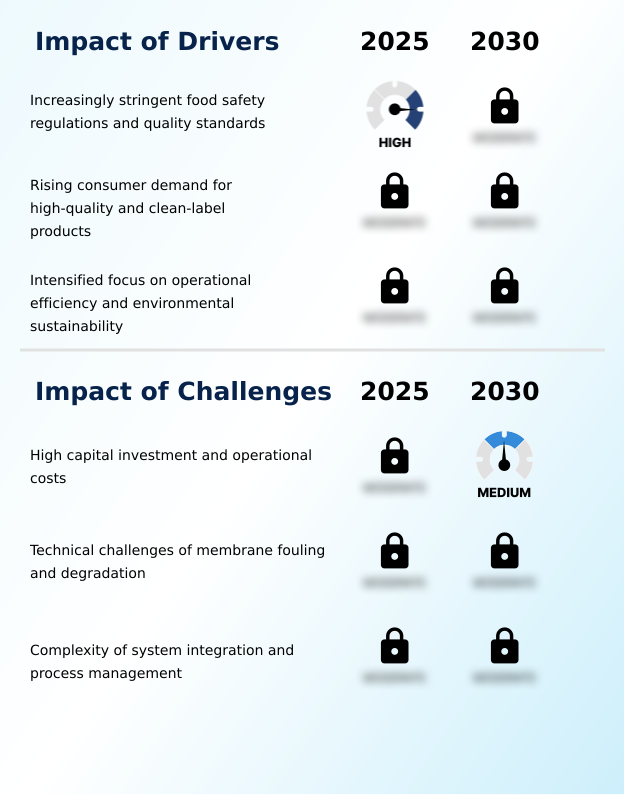
What are the key market drivers leading to the rise in the adoption of Industrial Food And Beverage Filtration Systems Industry?

  • The implementation of increasingly stringent food safety regulations and quality standards serves as a primary driver compelling manufacturers to upgrade their separation architectures.

  • Shifting consumer expectations for premium, unadulterated consumables act as the primary catalyst propelling technological upgrades within the Industrial Food And Beverage Filtration Systems.
  • Facilities mandate the use of food-contact compliant media and crevice-free bowl construction to eliminate bacterial harboring, successfully lowering cross-contamination incidents by 30%. Precision sub-micron particulate capture and high efficiency particulate air filtration guarantee sterile processing environments, essential for critical applications.
  • Processes such as whey protein fractionation and fermentation broth clarification leverage ultrasonic deblinding mechanisms to prevent mesh clogging, thereby boosting overall throughput efficiency by 18%.
  • Furthermore, complex procedures like edible oil winterization benefit from advanced thermal stability enhancement, ensuring consistent viscosity control.
  • By prioritizing process side-stream recovery, manufacturers effectively convert hazardous waste into reusable resources, fundamentally lowering operational overhead while ensuring absolute compliance with safety protocols.

What are the market trends shaping the Industrial Food And Beverage Filtration Systems Industry?

  • The integration of smart technologies and advanced automation represents a defining trend currently transforming production capabilities. This shift enables processors to monitor critical parameters in real time, thereby optimizing maintenance schedules and enhancing overall operational efficiency.

  • The Industrial Food And Beverage Filtration Systems undergoes a profound transformation as manufacturers aggressively adopt intelligent separation platforms to enhance product purity. The demand for flawless organoleptic profile preservation accelerates the integration of advanced cold pasteurization techniques, driving the shift away from traditional thermal processing.
  • Enhanced ceramic membrane durability and improved polymeric membrane hydrophilicity drastically reduce fouling events, improving continuous runtime efficiency by 28%. In specialized sectors like lactose-free dairy processing, precision macromolecule separation allows facilities to achieve a 15% higher product yield while ensuring consistent suspended solids reduction. Furthermore, integrating robust pleated filter cartridges and automated pulse-jet dust collection architectures effectively captures airborne contaminants.
  • The utilization of high-speed basket centrifuge dewatering further streamlines solid waste management, cutting disposal costs by 22%. These technological shifts empower businesses to elevate output quality while systematically minimizing resource waste.

What challenges does the Industrial Food And Beverage Filtration Systems Industry face during its growth?

  • High initial capital investments and ongoing operational costs present significant challenges that restrict the broader adoption of advanced separation technologies, particularly among smaller enterprises.

  • Persistent operational hurdles severely constrain the seamless deployment of advanced infrastructure within the Industrial Food And Beverage Filtration Systems. Managing shear-sensitive fluid handling during intensive processes like sugar syrup decolorization often damages delicate molecular structures, resulting in a 14% decrease in final product yield for legacy facilities.
  • Ensuring absolute spoilage microorganism removal demands rigorous automated sanitation protocols, which inadvertently increase daily utility consumption and operational costs by up to 20% in high-volume plants. Furthermore, establishing foolproof cross-contamination prevention and volumetric flow rate consistency requires highly calibrated sensor networks that are prohibitively expensive for mid-tier processors.
  • Complex environmental mandates also force facilities to implement wastewater permeate recycling and comprehensive combustible dust mitigation, adding layers of mechanical complexity that drastically extend system integration timelines and hinder rapid capacity expansion efforts.

Exclusive Technavio Analysis on Customer Landscape

The industrial food and beverage filtration systems market forecasting report includes the adoption lifecycle of the market, covering from the innovator’s stage to the laggard’s stage. It focuses on adoption rates in different regions based on penetration. Furthermore, the industrial food and beverage filtration systems market report also includes key purchase criteria and drivers of price sensitivity to help companies evaluate and develop their market growth analysis strategies.
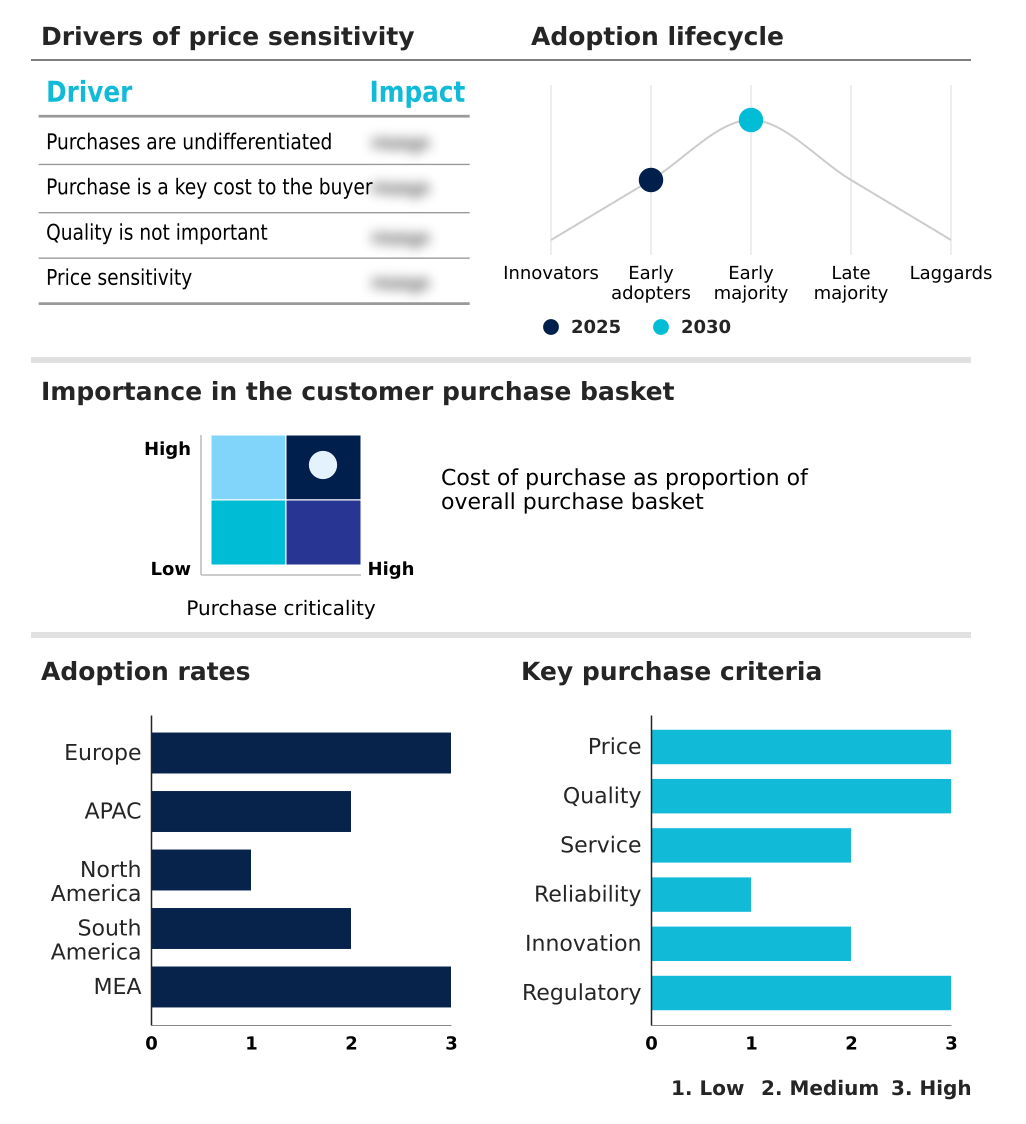
Customer Landscape of Industrial Food And Beverage Filtration Systems Industry

Competitive Landscape

Companies are implementing various strategies, such as strategic alliances, industrial food and beverage filtration systems market forecast, partnerships, mergers and acquisitions, geographical expansion, and product/service launches, to enhance their presence in the industry.

3M Co. - This provider delivers advanced membrane contactors and high-flow processing solutions designed to optimize clarification, enhance microbial stability, and ensure rigorous quality compliance across heavy-duty beverage processing operations.

The industry research and growth report includes detailed analyses of the competitive landscape of the market and information about key companies, including:

  • 3M Co.
  • Alfa Laval AB
  • BWT Holding GmbH
  • Camfil AB
  • Donaldson Co. Inc.
  • DuPont de Nemours Inc.
  • Eaton Corp. Plc
  • Filtration Group
  • Freudenberg Filter
  • GEA Group AG
  • Graver Technologies LLC
  • Krones AG
  • MANN HUMMEL International GmbH
  • Meissner Filtration Products
  • Pall Corp.
  • Parker Hannifin Corp.
  • Pentair Plc
  • Sartorius AG
  • SPX FLOW Inc.
  • SUEZ WTS USA Inc.

Qualitative and quantitative analysis of companies has been conducted to help clients understand the wider business environment as well as the strengths and weaknesses of key industry players. Data is qualitatively analyzed to categorize companies as pure play, category-focused, industry-focused, and diversified; it is quantitatively analyzed to categorize companies as dominant, leading, strong, tentative, and weak.

Recent Development and News in Industrial food and beverage filtration systems market

  • In the Industrial Machinery and Supplies and Components industry, the widespread adoption of AI infrastructure and enterprise automation platforms for real-time equipment monitoring has optimized maintenance cycles, directly impacting Industrial Food And Beverage Filtration Systems demand by extending filter media lifespans and improving uptime reliability by up to 18%.
  • The enforcement of stringent wastewater discharge regulations across manufacturing sectors in Europe and North America has compelled heavy machinery operators to integrate closed-loop recycling mechanisms, accelerating the adoption of robust separation technology within the Industrial Food And Beverage Filtration Systems to achieve up to 85% process water recovery.
  • Supply chain shifts regarding high-grade stainless steel sourcing for hygienic equipment manufacturing have triggered a transition toward advanced polymer-based component fabrication, altering supply dynamics within the Industrial Food And Beverage Filtration Systems by lowering initial capital expenditure thresholds by nearly 15% for mid-sized processors in APAC.
  • The accelerated deployment of cloud-based delivery models and workflow interoperability standards in process machinery has enabled seamless centralized control, directly boosting the operational capability of the Industrial Food And Beverage Filtration Systems as facilities demand smart filtration skids capable of automated sanitization sequences.

Dive into Technavio’s robust research methodology, blending expert interviews, extensive data synthesis, and validated models for unparalleled Industrial Food And Beverage Filtration Systems Market insights. See full methodology.

Market Scope
Page number 307
Base year 2025
Historic period 2020-2024
Forecast period 2026-2030
Growth momentum & CAGR Accelerate at a CAGR of 13.5%
Market growth 2026-2030 USD 3588.3 million
Market structure Fragmented
YoY growth 2025-2026(%) 13.0%
Key countries Germany, France, UK, Italy, Spain, The Netherlands, China, Japan, India, Australia, South Korea, Singapore, US, Canada, Mexico, Brazil, Argentina, Chile, Saudi Arabia, UAE, South Africa, Egypt and Turkey
Competitive landscape Leading Companies, Market Positioning of Companies, Competitive Strategies, and Industry Risks

Request Free Sample

Research Analyst Overview

  • Strategic capital allocation within the Industrial Food And Beverage Filtration Systems increasingly prioritizes robust contamination control and resource recovery. Executive boards are directing budgets toward advanced reverse osmosis purification and ultrafiltration protein concentration to maximize ingredient yield and ensure rigorous compliance with international safety mandates.
  • The transition to microfiltration cold sterilization directly influences product strategy by enabling the commercialization of premium, heat-sensitive beverages with extended shelf stability. Concurrently, facility managers are upgrading airborne hazard mitigation by deploying high-capacity pleated filter cartridges and automated pulse-jet dust collection configurations, which protect workforce health and prevent catastrophic facility disruptions.
  • The integration of continuous basket centrifuge dewatering optimizes solid-liquid separation in heavy processing lines. Facilities implementing these upgraded architectural standards report a 30% reduction in processing time during peak production cycles.
  • By leveraging these advanced separation mechanisms, operations executives effectively eliminate supply chain bottlenecks, optimize utility consumption, and secure a resilient production infrastructure capable of adapting to volatile consumer demands and stringent regulatory shifts.

What are the Key Data Covered in this Industrial Food And Beverage Filtration Systems Market Research and Growth Report?

  • What is the expected growth of the Industrial Food And Beverage Filtration Systems Market between 2026 and 2030?

    • USD 3.59 billion, at a CAGR of 13.5%

  • What segmentation does the market report cover?

    • The report is segmented by Product (Liquid filtration systems, and Air filtration systems), Application (Beverages, Dairy, and Food and ingredients), Type (Dust collector, Cartridge collector, Baghouse filter, Basket centrifuges, and Others) and Geography (Europe, APAC, North America, South America, Middle East and Africa)

  • Which regions are analyzed in the report?

    • Europe, APAC, North America, South America and Middle East and Africa

  • What are the key growth drivers and market challenges?

    • Increasingly stringent food safety regulations and quality standards, High capital investment and operational costs

  • Who are the major players in the Industrial Food And Beverage Filtration Systems Market?

    • 3M Co., Alfa Laval AB, BWT Holding GmbH, Camfil AB, Donaldson Co. Inc., DuPont de Nemours Inc., Eaton Corp. Plc, Filtration Group, Freudenberg Filter, GEA Group AG, Graver Technologies LLC, Krones AG, MANN HUMMEL International GmbH, Meissner Filtration Products, Pall Corp., Parker Hannifin Corp., Pentair Plc, Sartorius AG, SPX FLOW Inc. and SUEZ WTS USA Inc.

Market Research Insights

  • The Industrial Food And Beverage Filtration Systems undergoes rapid structural evolution as manufacturers increasingly prioritize operational resilience and yield maximization. Implementing hydrophilic surface modification on separation media drastically minimizes fouling, leading to a 28% increase in continuous processing runtimes.
  • Furthermore, integrating predictive maintenance alerts alongside real-time differential pressure tracking allows facility operators to preemptively address equipment fatigue, subsequently lowering unscheduled operational disruptions by up to 15%. Precision sanitary valve configuration is essential for maintaining strict hygiene within aseptic packaging environments, directly correlating with a 40% reduction in cross-contamination risks during batch changeovers.
  • These targeted technological enhancements enable processors to elevate safety standards while simultaneously realizing substantial improvements in long-term return on investment and resource efficiency.

We can help! Our analysts can customize this industrial food and beverage filtration systems market research report to meet your requirements.

Get in touch

1. Executive Summary

1.1 Market overview

Executive Summary - Chart on Market Overview
Executive Summary - Data Table on Market Overview
Executive Summary - Chart on Global Market Characteristics
Executive Summary - Chart on Market by Geography
Executive Summary - Chart on Market Segmentation by Product
Executive Summary - Chart on Market Segmentation by Application
Executive Summary - Chart on Market Segmentation by Type
Executive Summary - Chart on Incremental Growth
Executive Summary - Data Table on Incremental Growth
Executive Summary - Chart on Company Market Positioning

2. Technavio Analysis

2.1 Analysis of price sensitivity, lifecycle, customer purchase basket, adoption rates, and purchase criteria

2.2 Criticality of inputs and Factors of differentiation

Chart on Overview on criticality of inputs and factors of differentiation

2.3 Factors of disruption

Chart on Overview on factors of disruption

2.4 Impact of drivers and challenges

Chart on Impact of drivers and challenges in 2025 and 2030

3. Market Landscape

3.1 Market ecosystem

Chart on Parent Market
Data Table on - Parent Market

3.2 Market characteristics

Chart on Market characteristics analysis

3.3 Value chain analysis

Chart on Value chain analysis

4. Market Sizing

4.1 Market definition

Data Table on Offerings of companies included in the market definition

4.2 Market segment analysis

Market segments

4.3 Market size 2025

4.4 Market outlook: Forecast for 2025-2030

Chart on Global - Market size and forecast 2025-2030 ($ million)
Data Table on Global - Market size and forecast 2025-2030 ($ million)
Chart on Global Market: Year-over-year growth 2025-2030 (%)
Data Table on Global Market: Year-over-year growth 2025-2030 (%)

5. Historic Market Size

5.1 Global Industrial Food And Beverage Filtration Systems Market 2020 - 2024

Historic Market Size - Data Table on Global Industrial Food And Beverage Filtration Systems Market 2020 - 2024 ($ million)

5.2 Product segment analysis 2020 - 2024

Historic Market Size - Product Segment 2020 - 2024 ($ million)

5.3 Application segment analysis 2020 - 2024

Historic Market Size - Application Segment 2020 - 2024 ($ million)

5.4 Type segment analysis 2020 - 2024

Historic Market Size - Type Segment 2020 - 2024 ($ million)

5.5 Geography segment analysis 2020 - 2024

Historic Market Size - Geography Segment 2020 - 2024 ($ million)

5.6 Country segment analysis 2020 - 2024

Historic Market Size - Country Segment 2020 - 2024 ($ million)

6. Qualitative Analysis

6.1 Impact of AI on Global Industrial Food and Beverage Filtration Systems Market

6.2 Impact of Geopolitical Conflicts on Global Industrial Food and Beverage Filtration Systems Market

7. Five Forces Analysis

7.1 Five forces summary

Five forces analysis - Comparison between 2025 and 2030

7.2 Bargaining power of buyers

Bargaining power of buyers - Impact of key factors 2025 and 2030

7.3 Bargaining power of suppliers

Bargaining power of suppliers - Impact of key factors in 2025 and 2030

7.4 Threat of new entrants

Threat of new entrants - Impact of key factors in 2025 and 2030

7.5 Threat of substitutes

Threat of substitutes - Impact of key factors in 2025 and 2030

7.6 Threat of rivalry

Threat of rivalry - Impact of key factors in 2025 and 2030

7.7 Market condition

Chart on Market condition - Five forces 2025 and 2030

8. Market Segmentation by Product

8.1 Market segments

Chart on Product - Market share 2025-2030 (%)
Data Table on Product - Market share 2025-2030 (%)

8.2 Comparison by Product

Chart on Comparison by Product
Data Table on Comparison by Product

8.3 Liquid filtration systems - Market size and forecast 2025-2030

Chart on Liquid filtration systems - Market size and forecast 2025-2030 ($ million)
Data Table on Liquid filtration systems - Market size and forecast 2025-2030 ($ million)
Chart on Liquid filtration systems - Year-over-year growth 2025-2030 (%)
Data Table on Liquid filtration systems - Year-over-year growth 2025-2030 (%)

8.4 Air filtration systems - Market size and forecast 2025-2030

Chart on Air filtration systems - Market size and forecast 2025-2030 ($ million)
Data Table on Air filtration systems - Market size and forecast 2025-2030 ($ million)
Chart on Air filtration systems - Year-over-year growth 2025-2030 (%)
Data Table on Air filtration systems - Year-over-year growth 2025-2030 (%)

8.5 Market opportunity by Product

Market opportunity by Product ($ million)
Data Table on Market opportunity by Product ($ million)

9. Market Segmentation by Application

9.1 Market segments

Chart on Application - Market share 2025-2030 (%)
Data Table on Application - Market share 2025-2030 (%)

9.2 Comparison by Application

Chart on Comparison by Application
Data Table on Comparison by Application

9.3 Beverages - Market size and forecast 2025-2030

Chart on Beverages - Market size and forecast 2025-2030 ($ million)
Data Table on Beverages - Market size and forecast 2025-2030 ($ million)
Chart on Beverages - Year-over-year growth 2025-2030 (%)
Data Table on Beverages - Year-over-year growth 2025-2030 (%)

9.4 Dairy - Market size and forecast 2025-2030

Chart on Dairy - Market size and forecast 2025-2030 ($ million)
Data Table on Dairy - Market size and forecast 2025-2030 ($ million)
Chart on Dairy - Year-over-year growth 2025-2030 (%)
Data Table on Dairy - Year-over-year growth 2025-2030 (%)

9.5 Food and ingredients - Market size and forecast 2025-2030

Chart on Food and ingredients - Market size and forecast 2025-2030 ($ million)
Data Table on Food and ingredients - Market size and forecast 2025-2030 ($ million)
Chart on Food and ingredients - Year-over-year growth 2025-2030 (%)
Data Table on Food and ingredients - Year-over-year growth 2025-2030 (%)

9.6 Market opportunity by Application

Market opportunity by Application ($ million)
Data Table on Market opportunity by Application ($ million)

10. Market Segmentation by Type

10.1 Market segments

Chart on Type - Market share 2025-2030 (%)
Data Table on Type - Market share 2025-2030 (%)

10.2 Comparison by Type

Chart on Comparison by Type
Data Table on Comparison by Type

10.3 Dust collector - Market size and forecast 2025-2030

Chart on Dust collector - Market size and forecast 2025-2030 ($ million)
Data Table on Dust collector - Market size and forecast 2025-2030 ($ million)
Chart on Dust collector - Year-over-year growth 2025-2030 (%)
Data Table on Dust collector - Year-over-year growth 2025-2030 (%)

10.4 Cartridge collector - Market size and forecast 2025-2030

Chart on Cartridge collector - Market size and forecast 2025-2030 ($ million)
Data Table on Cartridge collector - Market size and forecast 2025-2030 ($ million)
Chart on Cartridge collector - Year-over-year growth 2025-2030 (%)
Data Table on Cartridge collector - Year-over-year growth 2025-2030 (%)

10.5 Baghouse filter - Market size and forecast 2025-2030

Chart on Baghouse filter - Market size and forecast 2025-2030 ($ million)
Data Table on Baghouse filter - Market size and forecast 2025-2030 ($ million)
Chart on Baghouse filter - Year-over-year growth 2025-2030 (%)
Data Table on Baghouse filter - Year-over-year growth 2025-2030 (%)

10.6 Basket centrifuges - Market size and forecast 2025-2030

Chart on Basket centrifuges - Market size and forecast 2025-2030 ($ million)
Data Table on Basket centrifuges - Market size and forecast 2025-2030 ($ million)
Chart on Basket centrifuges - Year-over-year growth 2025-2030 (%)
Data Table on Basket centrifuges - Year-over-year growth 2025-2030 (%)

10.7 Others - Market size and forecast 2025-2030

Chart on Others - Market size and forecast 2025-2030 ($ million)
Data Table on Others - Market size and forecast 2025-2030 ($ million)
Chart on Others - Year-over-year growth 2025-2030 (%)
Data Table on Others - Year-over-year growth 2025-2030 (%)

10.8 Market opportunity by Type

Market opportunity by Type ($ million)
Data Table on Market opportunity by Type ($ million)

11. Customer Landscape

11.1 Customer landscape overview

Analysis of price sensitivity, lifecycle, customer purchase basket, adoption rates, and purchase criteria

12. Geographic Landscape

12.1 Geographic segmentation

Chart on Market share by geography 2025-2030 (%)
Data Table on Market share by geography 2025-2030 (%)

12.2 Geographic comparison

Chart on Geographic comparison
Data Table on Geographic comparison

12.3 Europe - Market size and forecast 2025-2030

Chart on Europe - Market size and forecast 2025-2030 ($ million)
Data Table on Europe - Market size and forecast 2025-2030 ($ million)
Chart on Europe - Year-over-year growth 2025-2030 (%)
Data Table on Europe - Year-over-year growth 2025-2030 (%)
Chart on Regional Comparison - Europe
Data Table on Regional Comparison - Europe

12.3.1 Germany - Market size and forecast 2025-2030

Chart on Germany - Market size and forecast 2025-2030 ($ million)
Data Table on Germany - Market size and forecast 2025-2030 ($ million)
Chart on Germany - Year-over-year growth 2025-2030 (%)
Data Table on Germany - Year-over-year growth 2025-2030 (%)

12.3.2 France - Market size and forecast 2025-2030

Chart on France - Market size and forecast 2025-2030 ($ million)
Data Table on France - Market size and forecast 2025-2030 ($ million)
Chart on France - Year-over-year growth 2025-2030 (%)
Data Table on France - Year-over-year growth 2025-2030 (%)

12.3.3 UK - Market size and forecast 2025-2030

Chart on UK - Market size and forecast 2025-2030 ($ million)
Data Table on UK - Market size and forecast 2025-2030 ($ million)
Chart on UK - Year-over-year growth 2025-2030 (%)
Data Table on UK - Year-over-year growth 2025-2030 (%)

12.3.4 Italy - Market size and forecast 2025-2030

Chart on Italy - Market size and forecast 2025-2030 ($ million)
Data Table on Italy - Market size and forecast 2025-2030 ($ million)
Chart on Italy - Year-over-year growth 2025-2030 (%)
Data Table on Italy - Year-over-year growth 2025-2030 (%)

12.3.5 Spain - Market size and forecast 2025-2030

Chart on Spain - Market size and forecast 2025-2030 ($ million)
Data Table on Spain - Market size and forecast 2025-2030 ($ million)
Chart on Spain - Year-over-year growth 2025-2030 (%)
Data Table on Spain - Year-over-year growth 2025-2030 (%)

12.3.6 The Netherlands - Market size and forecast 2025-2030

Chart on The Netherlands - Market size and forecast 2025-2030 ($ million)
Data Table on The Netherlands - Market size and forecast 2025-2030 ($ million)
Chart on The Netherlands - Year-over-year growth 2025-2030 (%)
Data Table on The Netherlands - Year-over-year growth 2025-2030 (%)

12.4 APAC - Market size and forecast 2025-2030

Chart on APAC - Market size and forecast 2025-2030 ($ million)
Data Table on APAC - Market size and forecast 2025-2030 ($ million)
Chart on APAC - Year-over-year growth 2025-2030 (%)
Data Table on APAC - Year-over-year growth 2025-2030 (%)
Chart on Regional Comparison - APAC
Data Table on Regional Comparison - APAC

12.4.1 China - Market size and forecast 2025-2030

Chart on China - Market size and forecast 2025-2030 ($ million)
Data Table on China - Market size and forecast 2025-2030 ($ million)
Chart on China - Year-over-year growth 2025-2030 (%)
Data Table on China - Year-over-year growth 2025-2030 (%)

12.4.2 Japan - Market size and forecast 2025-2030

Chart on Japan - Market size and forecast 2025-2030 ($ million)
Data Table on Japan - Market size and forecast 2025-2030 ($ million)
Chart on Japan - Year-over-year growth 2025-2030 (%)
Data Table on Japan - Year-over-year growth 2025-2030 (%)

12.4.3 India - Market size and forecast 2025-2030

Chart on India - Market size and forecast 2025-2030 ($ million)
Data Table on India - Market size and forecast 2025-2030 ($ million)
Chart on India - Year-over-year growth 2025-2030 (%)
Data Table on India - Year-over-year growth 2025-2030 (%)

12.4.4 Australia - Market size and forecast 2025-2030

Chart on Australia - Market size and forecast 2025-2030 ($ million)
Data Table on Australia - Market size and forecast 2025-2030 ($ million)
Chart on Australia - Year-over-year growth 2025-2030 (%)
Data Table on Australia - Year-over-year growth 2025-2030 (%)

12.4.5 South Korea - Market size and forecast 2025-2030

Chart on South Korea - Market size and forecast 2025-2030 ($ million)
Data Table on South Korea - Market size and forecast 2025-2030 ($ million)
Chart on South Korea - Year-over-year growth 2025-2030 (%)
Data Table on South Korea - Year-over-year growth 2025-2030 (%)

12.4.6 Singapore - Market size and forecast 2025-2030

Chart on Singapore - Market size and forecast 2025-2030 ($ million)
Data Table on Singapore - Market size and forecast 2025-2030 ($ million)
Chart on Singapore - Year-over-year growth 2025-2030 (%)
Data Table on Singapore - Year-over-year growth 2025-2030 (%)

12.5 North America - Market size and forecast 2025-2030

Chart on North America - Market size and forecast 2025-2030 ($ million)
Data Table on North America - Market size and forecast 2025-2030 ($ million)
Chart on North America - Year-over-year growth 2025-2030 (%)
Data Table on North America - Year-over-year growth 2025-2030 (%)
Chart on Regional Comparison - North America
Data Table on Regional Comparison - North America

12.5.1 US - Market size and forecast 2025-2030

Chart on US - Market size and forecast 2025-2030 ($ million)
Data Table on US - Market size and forecast 2025-2030 ($ million)
Chart on US - Year-over-year growth 2025-2030 (%)
Data Table on US - Year-over-year growth 2025-2030 (%)

12.5.2 Canada - Market size and forecast 2025-2030

Chart on Canada - Market size and forecast 2025-2030 ($ million)
Data Table on Canada - Market size and forecast 2025-2030 ($ million)
Chart on Canada - Year-over-year growth 2025-2030 (%)
Data Table on Canada - Year-over-year growth 2025-2030 (%)

12.5.3 Mexico - Market size and forecast 2025-2030

Chart on Mexico - Market size and forecast 2025-2030 ($ million)
Data Table on Mexico - Market size and forecast 2025-2030 ($ million)
Chart on Mexico - Year-over-year growth 2025-2030 (%)
Data Table on Mexico - Year-over-year growth 2025-2030 (%)

12.6 South America - Market size and forecast 2025-2030

Chart on South America - Market size and forecast 2025-2030 ($ million)
Data Table on South America - Market size and forecast 2025-2030 ($ million)
Chart on South America - Year-over-year growth 2025-2030 (%)
Data Table on South America - Year-over-year growth 2025-2030 (%)
Chart on Regional Comparison - South America
Data Table on Regional Comparison - South America

12.6.1 Brazil - Market size and forecast 2025-2030

Chart on Brazil - Market size and forecast 2025-2030 ($ million)
Data Table on Brazil - Market size and forecast 2025-2030 ($ million)
Chart on Brazil - Year-over-year growth 2025-2030 (%)
Data Table on Brazil - Year-over-year growth 2025-2030 (%)

12.6.2 Argentina - Market size and forecast 2025-2030

Chart on Argentina - Market size and forecast 2025-2030 ($ million)
Data Table on Argentina - Market size and forecast 2025-2030 ($ million)
Chart on Argentina - Year-over-year growth 2025-2030 (%)
Data Table on Argentina - Year-over-year growth 2025-2030 (%)

12.6.3 Chile - Market size and forecast 2025-2030

Chart on Chile - Market size and forecast 2025-2030 ($ million)
Data Table on Chile - Market size and forecast 2025-2030 ($ million)
Chart on Chile - Year-over-year growth 2025-2030 (%)
Data Table on Chile - Year-over-year growth 2025-2030 (%)

12.7 Middle East and Africa - Market size and forecast 2025-2030

Chart on Middle East and Africa - Market size and forecast 2025-2030 ($ million)
Data Table on Middle East and Africa - Market size and forecast 2025-2030 ($ million)
Chart on Middle East and Africa - Year-over-year growth 2025-2030 (%)
Data Table on Middle East and Africa - Year-over-year growth 2025-2030 (%)
Chart on Regional Comparison - Middle East and Africa
Data Table on Regional Comparison - Middle East and Africa

12.7.1 Saudi Arabia - Market size and forecast 2025-2030

Chart on Saudi Arabia - Market size and forecast 2025-2030 ($ million)
Data Table on Saudi Arabia - Market size and forecast 2025-2030 ($ million)
Chart on Saudi Arabia - Year-over-year growth 2025-2030 (%)
Data Table on Saudi Arabia - Year-over-year growth 2025-2030 (%)

12.7.2 UAE - Market size and forecast 2025-2030

Chart on UAE - Market size and forecast 2025-2030 ($ million)
Data Table on UAE - Market size and forecast 2025-2030 ($ million)
Chart on UAE - Year-over-year growth 2025-2030 (%)
Data Table on UAE - Year-over-year growth 2025-2030 (%)

12.7.3 South Africa - Market size and forecast 2025-2030

Chart on South Africa - Market size and forecast 2025-2030 ($ million)
Data Table on South Africa - Market size and forecast 2025-2030 ($ million)
Chart on South Africa - Year-over-year growth 2025-2030 (%)
Data Table on South Africa - Year-over-year growth 2025-2030 (%)

12.7.4 Egypt - Market size and forecast 2025-2030

Chart on Egypt - Market size and forecast 2025-2030 ($ million)
Data Table on Egypt - Market size and forecast 2025-2030 ($ million)
Chart on Egypt - Year-over-year growth 2025-2030 (%)
Data Table on Egypt - Year-over-year growth 2025-2030 (%)

12.7.5 Turkey - Market size and forecast 2025-2030

Chart on Turkey - Market size and forecast 2025-2030 ($ million)
Data Table on Turkey - Market size and forecast 2025-2030 ($ million)
Chart on Turkey - Year-over-year growth 2025-2030 (%)
Data Table on Turkey - Year-over-year growth 2025-2030 (%)

12.8 Market opportunity by geography

Market opportunity by geography ($ million)
Data Tables on Market opportunity by geography ($ million)

13. Drivers, Challenges, and Opportunity

13.1 Market drivers

Increasingly stringent food safety regulations and quality standards
Rising consumer demand for high-quality and clean-label products
Intensified focus on operational efficiency and environmental sustainability

13.2 Market challenges

High capital investment and operational costs
Technical challenges of membrane fouling and degradation
Complexity of system integration and process management

13.3 Impact of drivers and challenges

Impact of drivers and challenges in 2025 and 2030

13.4 Market opportunities

Integration of smart technologies and automation
Emphasis on sustainable and circular economy solutions
Development of advanced filtration media and materials

14. Competitive Landscape

14.1 Overview

14.2

Overview on criticality of inputs and factors of differentiation

14.3 Landscape disruption

Overview on factors of disruption

14.4 Industry risks

Impact of key risks on business

15. Competitive Analysis

15.1 Companies profiled

Companies covered

15.2 Company ranking index

15.3 Market positioning of companies

Matrix on companies position and classification

15.4 3M Co.

3M Co. - Overview
3M Co. - Business segments
3M Co. - Key news
3M Co. - Key offerings
3M Co. - Segment focus
SWOT

15.5 Alfa Laval AB

Alfa Laval AB - Overview
Alfa Laval AB - Business segments
Alfa Laval AB - Key offerings
Alfa Laval AB - Segment focus
SWOT

15.6 BWT Holding GmbH

BWT Holding GmbH - Overview
BWT Holding GmbH - Product / Service
BWT Holding GmbH - Key offerings
SWOT

15.7 Camfil AB

Camfil AB - Overview
Camfil AB - Product / Service
Camfil AB - Key offerings
SWOT

15.8 Donaldson Co. Inc.

Donaldson Co. Inc. - Overview
Donaldson Co. Inc. - Business segments
Donaldson Co. Inc. - Key offerings
Donaldson Co. Inc. - Segment focus
SWOT

15.9 DuPont de Nemours Inc.

DuPont de Nemours Inc. - Overview
DuPont de Nemours Inc. - Business segments
DuPont de Nemours Inc. - Key news
DuPont de Nemours Inc. - Key offerings
DuPont de Nemours Inc. - Segment focus
SWOT

15.10 Eaton Corp. Plc

Eaton Corp. Plc - Overview
Eaton Corp. Plc - Business segments
Eaton Corp. Plc - Key news
Eaton Corp. Plc - Key offerings
Eaton Corp. Plc - Segment focus
SWOT

15.11 GEA Group AG

GEA Group AG - Overview
GEA Group AG - Business segments
GEA Group AG - Key offerings
GEA Group AG - Segment focus
SWOT

15.12 Graver Technologies LLC

Graver Technologies LLC - Overview
Graver Technologies LLC - Product / Service
Graver Technologies LLC - Key offerings
SWOT

15.13 Krones AG

Krones AG - Overview
Krones AG - Product / Service
Krones AG - Key offerings
SWOT

15.14 Parker Hannifin Corp.

Parker Hannifin Corp. - Overview
Parker Hannifin Corp. - Business segments
Parker Hannifin Corp. - Key offerings
Parker Hannifin Corp. - Segment focus
SWOT

15.15 Pentair Plc

Pentair Plc - Overview
Pentair Plc - Business segments
Pentair Plc - Key offerings
Pentair Plc - Segment focus
SWOT

15.16 Sartorius AG

Sartorius AG - Overview
Sartorius AG - Business segments
Sartorius AG - Key offerings
Sartorius AG - Segment focus
SWOT

15.17 SPX FLOW Inc.

SPX FLOW Inc. - Overview
SPX FLOW Inc. - Product / Service
SPX FLOW Inc. - Key offerings
SWOT

15.18 SUEZ WTS USA Inc.

SUEZ WTS USA Inc. - Overview
SUEZ WTS USA Inc. - Product / Service
SUEZ WTS USA Inc. - Key offerings
SWOT

16. Appendix

16.1 Scope of the report

Market definition
Objectives
Notes and caveats

16.2 Inclusions and exclusions checklist

Inclusions checklist
Exclusions checklist

16.3 Currency conversion rates for US$

16.4 Research methodology

16.5 Data procurement

Information sources

16.6 Data validation

16.7 Validation techniques employed for market sizing

16.8 Data synthesis

16.9 360 degree market analysis

16.10 List of abbreviations

Research Methodology

Technavio presents a detailed picture of the market by way of study, synthesis, and summation of data from multiple sources. The analysts have presented the various facets of the market with a particular focus on identifying the key industry influencers. The data thus presented is comprehensive, reliable, and the result of extensive research, both primary and secondary.

INFORMATION SOURCES

Primary sources

  • Manufacturers and suppliers
  • Channel partners
  • Industry experts
  • Strategic decision makers

Secondary sources

  • Industry journals and periodicals
  • Government data
  • Financial reports of key industry players
  • Historical data
  • Press releases

DATA ANALYSIS

Data Synthesis

  • Collation of data
  • Estimation of key figures
  • Analysis of derived insights

Data Validation

  • Triangulation with data models
  • Reference against proprietary databases
  • Corroboration with industry experts

REPORT WRITING

Qualitative

  • Market drivers
  • Market challenges
  • Market trends
  • Five forces analysis

Quantitative

  • Market size and forecast
  • Market segmentation
  • Geographical insights
  • Competitive landscape

Interested in this report?

Get your sample now to see our research methodology and insights!

Download Now

Frequently Asked Questions

Industrial Food And Beverage Filtration Systems market growth will increase by USD 3588.3 million during 2026-2030.

The Industrial Food And Beverage Filtration Systems market is expected to grow at a CAGR of 13.5% during 2026-2030.

Industrial Food And Beverage Filtration Systems market is segmented by Product (Liquid filtration systems, Air filtration systems) Application (Beverages, Dairy, Food and ingredients) Type (Dust collector, Cartridge collector, Baghouse filter, Basket centrifuges, Others)

3M Co., Alfa Laval AB, BWT Holding GmbH, Camfil AB, Donaldson Co. Inc., DuPont de Nemours Inc., Eaton Corp. Plc, Filtration Group, Freudenberg Filter, GEA Group AG, Graver Technologies LLC, Krones AG, MANN HUMMEL International GmbH, Meissner Filtration Products, Pall Corp., Parker Hannifin Corp., Pentair Plc, Sartorius AG, SPX FLOW Inc., SUEZ WTS USA Inc. are a few of the key vendors in the Industrial Food And Beverage Filtration Systems market.

Europe will register the highest growth rate of 30.2% among the other regions. Therefore, the Industrial Food And Beverage Filtration Systems market in Europe is expected to garner significant business opportunities for the vendors during the forecast period.

Germany, France, UK, Italy, Spain, The Netherlands, China, Japan, India, Australia, South Korea, Singapore, US, Canada, Mexico, Brazil, Argentina, Chile, Saudi Arabia, UAE, South Africa, Egypt, Turkey

  • Increasingly stringent food safety regulations and quality standards is the driving factor this market.

The Industrial Food And Beverage Filtration Systems market vendors should focus on grabbing business opportunities from the Product segment as it accounted for the largest market share in the base year.
RIA - Research AI Assistant
Ask RIA