MENA Industrial Valve Market Size 2024-2028
The MENA Industrial Valve Market size is estimated to grow by USD 524.2 million at a CAGR of 3.58% between 2023 and 2028. The market is experiencing a significant surge due to the increasing demand for more efficient valve solutions. This trend is driven by several factors, including the expanding oil and gas sector and the rising infrastructure development in the Middle East and North Africa (MENA) region. The oil and gas industry relies heavily on valves for process control, safety, and efficiency. With the ongoing exploration and production activities in the MENA region, the demand for valves is expected to increase further. Infrastructure projects, such as power plants and desalination facilities, also require a large number of valves for various applications. As a result, the valve market is poised for robust growth in the coming years.
What will be the Size of the Market During the Forecast Period?

MENA Industrial Valve Market Forecast 2024-2028
To learn more about this report, Request Free Sample
Market Dynamic
The market is integral to various sectors including smart cities, power plants, and process industries where connected networks and remote condition monitoring play crucial roles. Valves like control valves and diaphragm valves regulate the flow of gases, slurries, liquids, and vapors in industrial operations. Materials such as cast iron, stainless steel, and metal alloys ensure durability and reliability in diverse environments. Advancements in material technology and process automation optimize industrial equipment performance, supported by machine learning and remote conditional monitoring for predictive maintenance. Industrial valves also contribute to enhancing efficiency and safety in nuclear plants and other critical installations, reflecting ongoing innovations to meet evolving industrial needs and regulatory standards. Our researchers studied the data for years, with 2023 as the base year and 2024 as the estimated year, and presented the key drivers, trends, and challenges for the market.
Key Market Driver - Rise in demand for more efficient valves
The oil and gas E and P landscape is changing with the increase in exploration activities in remote locations. With depleting fossil fuel sources, oil and gas companies are compelled to travel to complex terrains for oil and gas exploration, where drilling operations are difficult to sustain owing to harsh operating environments. In such conditions, for a project to be commercially viable, it must undergo a greater level of analysis and testing, as even a small mistake can cause huge damage to the workforce and environment, besides incurring huge financial losses. The growth of unconventional hydrocarbon resources, such as shale oil and gas as well as oil tar sands, has also provided new opportunities for the implementation of industrial valves in the oil and gas industry.
These valves are used for enhanced oil recovery and also for artificial lifts in such unconventional oil and gas fields. The high investments in shale fields will also contribute to the demand for more efficient valves in the oil and gas industry. These factors will drive the growth of the market during the forecast period.
Major Market Trends - Advancements in valve technology
Although the basic design of industrial valves has remained the same, some valve components have been upgraded to withstand hostile working applications of industries with the help of technological modifications. The actuator is one such component of a valve, as it controls mass and energy flow by regulating the valve. With the increasing adoption of automation in industries, manufacturers are now increasingly focusing on data analytics to identify the impact of different process variables that affect the production process. Advances in sensor technology and a decrease in the cost of sensors are enabling valve positioners to deliver data regarding valve stroke and thrust, output pressure to the actuator, temperature, valve seat/plug wear, and valve performance. These smart positioners make use of a microprocessor to control a valve and facilitate accurate functioning.
In addition, smart positioners can monitor and record data for online diagnostics. This can help in the early detection of any wear and tear in the valves. Smart positioners also provide high accuracy and stability. These advances have improved the capabilities of valves with better control and preventive maintenance features. Such advancements in valve technology will positively impact the growth of the market during the forecast period.
Significant Market Challenge - Issue of counterfeit and fraudulent industrial valves
The high prevalence of counterfeit and fraudulent products, particularly in fluid handling products, has become a grave issue in the market in focus. Counterfeit products are those products in which an illegal replica of a genuine product is made and sold as a genuine product. The counterfeit product may also involve the use of a manufacturer's logo or brand name for a product without the consent or permission of the manufacturer. Counterfeit valves are often of poor quality, which implies that these products can break down under high stress, consequently compromising the safety and quality of the facility where they are deployed. For original equipment manufacturers (OEMs), counterfeit products not only result in potential revenue loss but can also damage brand equity. Manufacturers are now trying to curb the sales of counterfeit and fraudulent valves by forming alliances and creating awareness among end-users and distributors regarding these counterfeit and fraudulent actuators.
However, some vendors are laser marking their valves, indicating the size, material, and pressure-class data regarding the valve. However, the growth of the online marketplace for such counterfeit and fraudulent valves has provided manufacturers in the counterfeit market a wider geographic reach and anonymity, which is reducing potential revenue streams for genuine vendors. These factors will hinder the growth of the market during the forecast period.
Market Segmentation
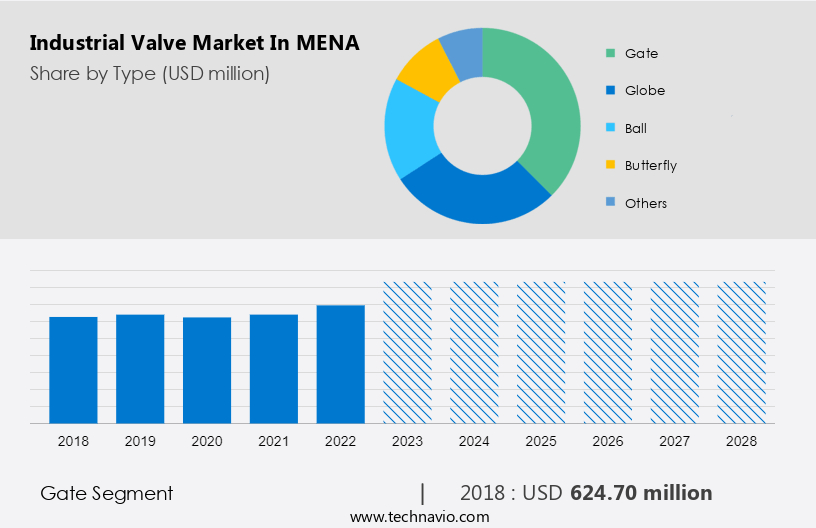
By Type
The market share growth by the gate segment will be significant during the forecast period. Gate valves are linear motion valves used for on-off applications. These contain a plate (circular or rectangular) that acts as a gateway and regulates the flow in case of straight-line fluid flow. Parallel-shaped gate valves and wedge-shaped gate valves are the two types of gate valves.
Get a Customised Report as per your requirements for FREE!
The gate segment was the largest and was valued at USD 624.70 million in 2018. The rapid development of infrastructure projects, such as power plants and industrial facilities, also drives the demand for gate valves in MENA. These valves are crucial in controlling the flow of water, steam, and other fluids in these infrastructure projects. MENA region is also experiencing a substantial influx of foreign investments, further fueling the demand for gate valves. As international companies establish their operations in the region, there is a growing need for reliable and high-quality industrial valves such as gate valves. Thus, the thriving oil and gas sector, infrastructure development projects, and increasing foreign investments will drive the growth of the industrial valve market in MENA through the gate valves segment during the forecast period.
By End-user
Based on end-user, the market has been segmented into oil and gas, chemicals and petrochemicals, water and wastewater industry, power and energy, and others. The oil and gas segment will account for the largest share of this segment.? MENA is home to key member countries of the Organization of the Petroleum Exporting Countries (OPEC) (such as Saudi Arabia, Qatar, and Iraq), which hold a significant share of global oil and gas production. OPEC generated approximately 40% of the world's total crude oil production and approximately 16% of the world's natural gas production in 2022. Many North African countries, such as Algeria, Libya, and Egypt, are witnessing strong growth in oil and gas exploration and production (E&P) activities in 2022. Therefore, such E&P activities will drive the demand for industrial valves and, in turn, will boost the growth of the industrial valve market in MENA through the oil and gas segment during the forecast period.
Who are the Major Market Companies?
Companies are implementing various strategies, such as strategic alliances, partnerships, mergers and acquisitions, geographical expansion, and product/service launches, to enhance their presence in the market.
AL Najim Saudi International CO Ltd. - The company offers industrial valves such as actuated IMC CCI choke valve and Multi trim drag choke valve.
We also have detailed analyses of the market’s competitive landscape and offer information on 20 market companies, including:
AL Najim Saudi International CO Ltd., AVK Saudi Valves Manufacturing Co. Ltd., Emerson Electric Co., Flowserve Corp., IMI Critical Engineering, IVM Saudi, Johnson Controls International Plc, KITZ Corp., Larsen and Toubro Ltd., Neway valve, Roper Technologies Inc., Schlumberger Ltd., Strong Valves, TECNICAS TRANFORMACIONES Y VENTAS S.A., Valvetech Inc., VALVULAS FEVISA S.A.U, VBG Intech, Velan Inc., VME Valves Factory LLC, and Winning Fluid Equipment
Technavio report provides an in-depth analysis of the market and its players through combined qualitative and quantitative data. The analysis classifies companies into categories based on their business approaches, including pure-play, category-focused, industry-focused, and diversified. Companies are specially categorized into dominant, leading, strong, tentative, and weak, based on their quantitative data analysis.
Segment Overview
The market research report provides comprehensive data (region-wise segment analysis), with forecasts and estimates in "USD million " for the period 2024-2028, as well as historical data from 2018-2022 for the following segments.
- Type Outlook
- Gate
- Globe
- Ball
- Butterfly
- Others
- End-user Outlook
- Oil and gas
- Chemicals and petrochemicals
- Water and wasterwater industry
- Power and energy
- Others
You may also interested in the below market reports
-
Industrial Valves in Oil and Gas Market Analysis APAC, North America, Europe, Middle East and Africa, South America - China, US, UK, France, Japan - Size and Forecast
-
Industrial Valves and Actuators Market Analysis APAC, Europe, North America, Middle East and Africa, South America - China, US, UK, France, Japan - Size and Forecast
-
Industrial Vacuum Valves Market Analysis APAC, North America, Europe, South America, Middle East and Africa - China, US, South Korea, UK, Japan - Size and Forecast
Market Analyst Overview
The industrial valves industry serves critical roles across diverse sectors such as power plants, water utilities, and pharmaceutical manufacturing, utilizing advanced technologies including AI integrated valves, IoT integrated industrial valves, and real time monitoring for enhanced efficiency. Valve manufacturers supply a range of products like globe valves and isolation valves, crucial for managing fluid flow in piping systems made from materials like carbon steel and aluminum. These valves play vital roles in optimizing processes and reducing energy consumption across the energy and power industry, including oil and gas operations in upstream, midstream, and downstream sectors. Additionally, valves are integral to wastewater treatment systems and the food and beverage processing industry, supporting operations with precise control and automation facilitated by industrial robots and I/P converters. Pharmaceutical manufacturers, semiconductor industry players, and the oil and power industry rely on advanced fittings for extraction processes, while the food and beverage processing sector leverages Internet of Things technology to optimize lubrication and liquid handling in the production of products aligned with renewable energy sources.
|
Market Scope |
|
|
Report Coverage |
Details |
|
Page number |
162 |
|
Base year |
2023 |
|
Historic period |
2018 - 2022 |
|
Forecast period |
2024-2028 |
|
Growth momentum & CAGR |
Accelerate at a CAGR of 3.58% |
|
Market growth 2024-2028 |
USD 524.2 million |
|
Market structure |
USD Fragmented |
|
YoY growth 2023-2024(%) |
3.41 |
|
Competitive landscape |
Leading Companies, Market Positioning of Companies, Competitive Strategies, and Industry Risks |
|
Key companies profiled |
AL Najim Saudi International CO Ltd., AVK Saudi Valves Manufacturing Co. Ltd., Emerson Electric Co., Flowserve Corp., IMI Critical Engineering, IVM Saudi, Johnson Controls International Plc., KITZ Corp., Larsen and Toubro Ltd., Neway valve, Roper Technologies Inc., Schlumberger Ltd., Strong Valves, TECNICAS TRANFORMACIONES Y VENTAS S.A., Valvetech Inc., VALVULAS FEVISA S.A.U, VBG Intech, Velan Inc., VME Valves Factory LLC, and Winning Fluid Equipment |
|
Market dynamics |
Parent market analysis, Market Forecasting, Market growth inducers and obstacles, Fast-growing and slow-growing segment analysis, Market growth and Forecasting, COVID 19 impact and recovery analysis and future consumer dynamics, Market condition analysis for market forecast period |
|
Customization purview |
If our report has not included the data that you are looking for, you can reach out to our analysts and get segments customized. |
What are the Key Data Covered in this Market Report?
- CAGR of the market during the forecast period
- Detailed information on factors that will drive the market growth and forecasting of the market between 2024 and 2028
- Precise estimation of the size of the market size and its contribution to the parent market
- Accurate predictions about upcoming market trends and analysis and changes in consumer behavior
- Growth of the market industry across Europe, North America, APAC, South America, and Middle East and Africa
- Thorough market growth analysis of the market’s competitive landscape and detailed information about companies
- Comprehensive market analysis and report on the factors that will challenge the market research and growth of market companies
We can help! Our analysts can customize this market research report to meet your requirements. Get in touch
 RIA -
RIA - 
