
Industrial Valves In Oil And Gas Market Size 2026-2030
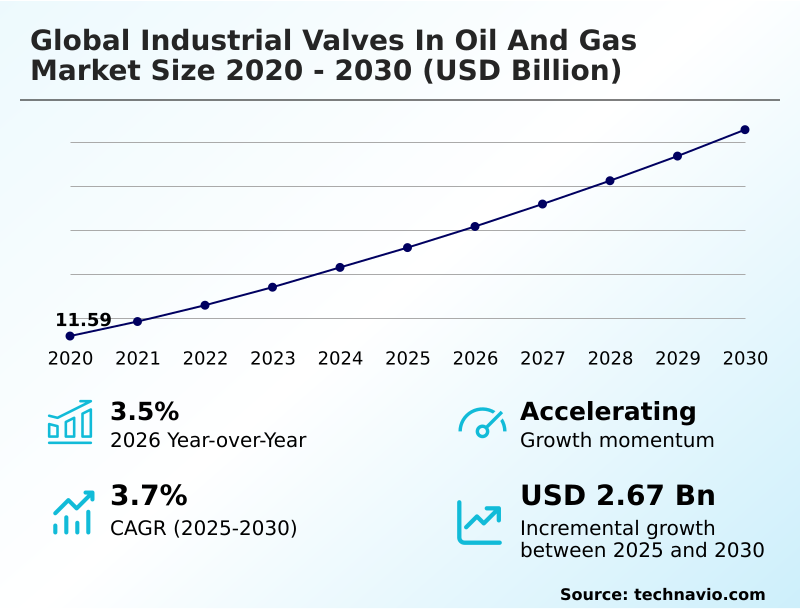
The Industrial Valves In Oil And Gas Market size was valued at USD 13.60 billion in 2025, growing at a CAGR of 3.7% during the forecast period 2026-2030.
Major Market Trends & Insights
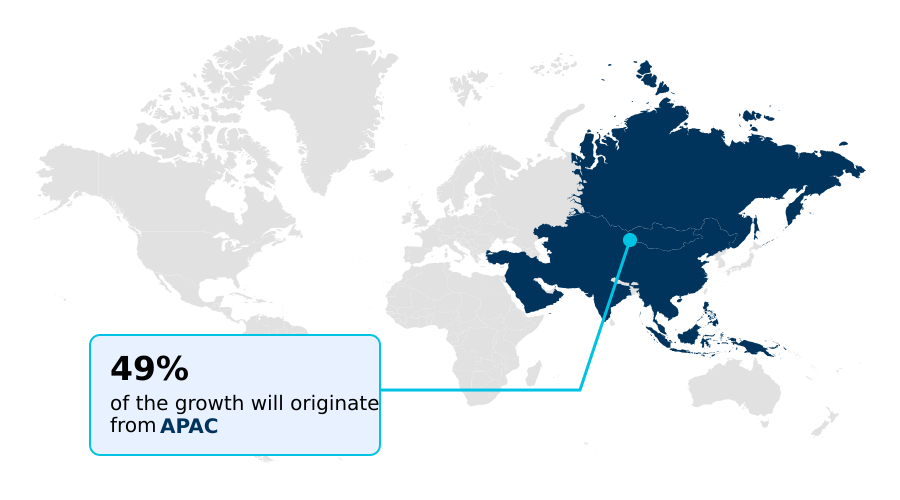
- APAC dominated the market and accounted for a 48.9% growth during the forecast period.
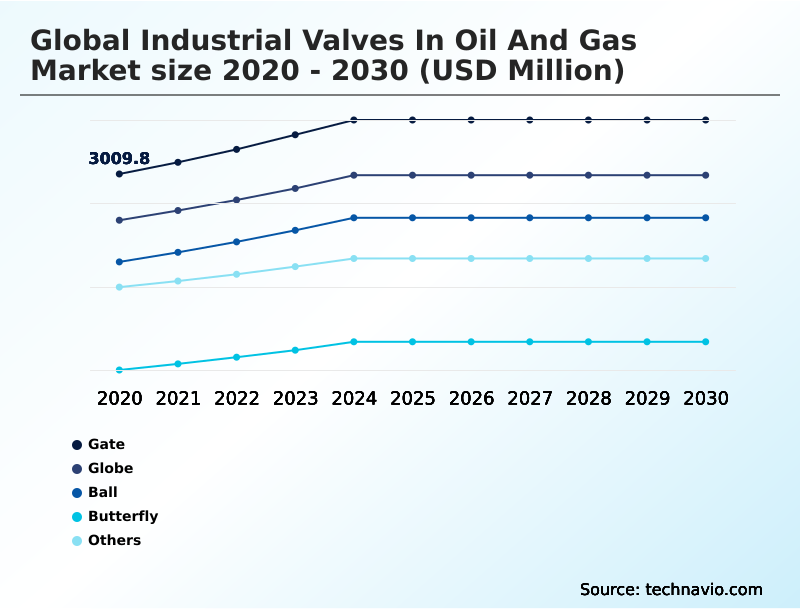
- By Product - Gate segment was valued at USD 3.43 billion in 2024
- By Type - Cast segment accounted for the largest market revenue share in 2024
Market Size & Forecast
- Historic Market Opportunities 2020-2024: USD 4.69 billion
- Market Future Opportunities 2025-2030: USD 2.67 billion
- CAGR from 2025 to 2030 : 3.7%
Market Summary
- The industrial valves in oil and gas market is characterized by a strategic shift towards high-performance, digitally integrated solutions, with adoption in new deepwater projects being 30% higher than in conventional onshore sites.
- For instance, operators are now mandating smart valve systems with embedded sensors in upstream applications, allowing for real-time performance monitoring that reduces unplanned downtime by up to 25% compared to traditional maintenance schedules. A key driver is the relentless global energy demand pushing exploration into harsher environments, which requires advanced valve technology capable of handling high-pressure and high-temperature conditions.
- Conversely, the market faces a significant challenge from crude oil price volatility, which creates unpredictable capital expenditure cycles, often leading to project deferrals and impacting long-term demand for new valve installations.
What will be the Size of the Industrial Valves In Oil And Gas Market during the forecast period?
Get Key Insights on Market Forecast (PDF) Request Free Sample
How is the Industrial Valves In Oil And Gas Market Segmented?
The industrial valves in oil and gas industry research report provides comprehensive data (region-wise segment analysis), with forecasts and analysis for the period 2026-2030, as well as historical data from 2020-2024 for the following segments.
- Product
- Gate
- Globe
- Ball
- Butterfly
- Others
- Type
- Cast
- Forged
- Application
- Upstream
- Midstream
- Downstream
- Geography
- APAC
- China
- India
- Japan
- North America
- US
- Canada
- Mexico
- Europe
- Germany
- UK
- France
- Middle East and Africa
- Saudi Arabia
- UAE
- South Africa
- South America
- Brazil
- Argentina
- Colombia
- Rest of World (ROW)
- APAC
How is the Industrial Valves In Oil And Gas Market Segmented by Product?
The gate segment is estimated to witness significant growth during the forecast period.
The gate segment, which accounts for over 25% of product-based market share, serves foundational isolation roles where minimal flow restriction is critical.
These multi-turn valves are indispensable for upstream exploration and midstream pipeline transport due to their ability to provide a tight seal, with modern cast valve designs improving sealing performance by 10% over previous generations.
Innovations in the segment focus on enhancing the durability of wedge and seat components with corrosion resistance materials to combat sour gas and crude oil.
Development of forged gate valves is a focal point for deepwater applications where structural integrity is non-negotiable.
Integration of non-rising stem designs and advanced packing materials also helps in reducing fugitive emissions, a key regulatory hurdle for modern oil and gas infrastructure.
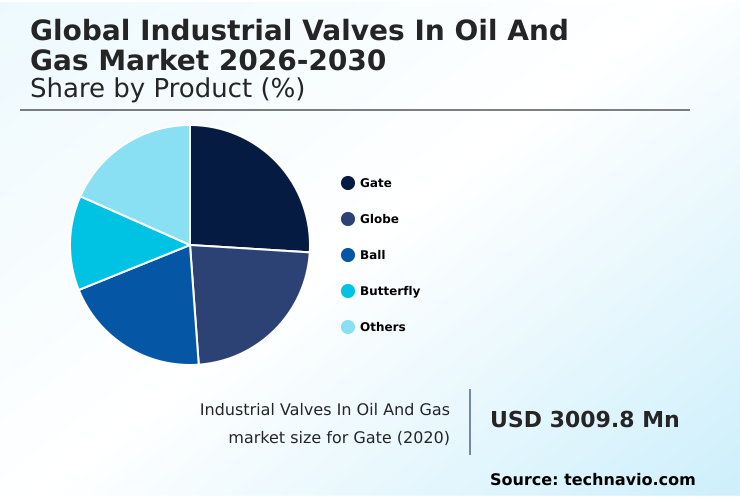
The Gate segment was valued at USD 3.43 billion in 2024 and showed a gradual increase during the forecast period.
How demand for the Industrial Valves In Oil And Gas market is rising in the leading region?
APAC is estimated to contribute 48.9% to the growth of the global market during the forecast period.Technavio’s analysts have elaborately explained the regional trends and drivers that shape the market during the forecast period.
See How Industrial Valves In Oil And Gas Market demand is rising in APAC Request Free Sample
The geographic distribution of the industrial valves in oil and gas market is led by APAC, which accounts for nearly 49% of the market's incremental growth, a rate approximately 2.6 times that of Europe.
This dominance is propelled by countries like China and India, where massive investments in midstream infrastructure and LNG transport are underway.
In contrast, the North America market, while mature, is driven by the modernization of existing infrastructure and the adoption of process automation strategies to optimize shale gas extraction, which has boosted efficiency by over 15%.
This regional divergence necessitates distinct business strategies; in APAC, the focus is on large-volume contracts for new builds, whereas in North America, it is on high-performance forged valve retrofits and advanced subsea control systems for offshore projects.
What are the key Drivers, Trends, and Challenges in the Industrial Valves In Oil And Gas Market?
Our researchers analyzed the data with 2025 as the base year, along with the key drivers, trends, and challenges. A holistic analysis of drivers will help companies refine their marketing strategies to gain a competitive advantage.
- Strategic decision-making in the industrial valves in oil and gas market increasingly hinges on a deep understanding of application-specific performance under extreme conditions. For instance, specifying high pressure industrial valves for oil and gas in deepwater upstream applications now demands materials that can withstand pressures 50% greater than those found in conventional onshore wells.
- The evaluation of forged vs cast valve performance offshore reveals that while forged bodies offer superior structural integrity, advanced casting techniques have closed the performance gap for certain midstream applications, reducing component costs by up to 15%. Concurrently, the deployment of smart valve technology in upstream applications is becoming standard, with integrated sensors providing data that can prevent catastrophic failures.
- In the midstream sector, the focus on cryogenic ball valves for LNG transport is intense, as reliability directly impacts cargo safety and delivery schedules. Operators are also navigating complex fugitive emission standards for control valves, which mandate advanced sealing technologies and regular monitoring to ensure compliance and avoid costly penalties.
- This complex interplay of technical requirements, regulatory pressures, and economic factors shapes procurement strategies across the entire value chain, from wellhead to refinery.
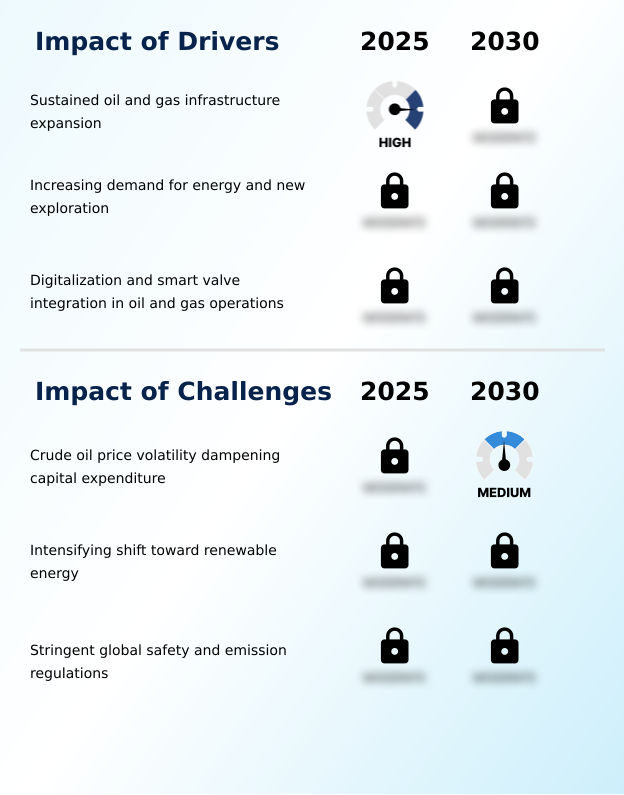
What are the key market drivers leading to the rise in the adoption of Industrial Valves In Oil And Gas Industry?
- Sustained expansion of oil and gas infrastructure, driven by global energy demand and the development of new exploration frontiers, is a primary driver for the market.
- Sustained expansion of energy infrastructure is a primary driver for the industrial valves in oil and gas market, with pipeline integrity management projects growing by 15% in key regions.
- The global build-out of liquefied natural gas transport facilities and the continued development of shale gas extraction are creating significant demand for specialized ball valves and butterfly valves across upstream, midstream, and downstream applications.
- This growth necessitates extensive networks for transporting hydrocarbons, directly increasing the need for reliable flow control components.
- As a result, investments in process automation strategies and remote monitoring capabilities have also surged, as operators seek to manage these sprawling networks with greater efficiency and safety, improving monitoring response times by up to 40%.
What are the market trends shaping the Industrial Valves In Oil And Gas Industry?
- The integration of smart technologies and the Industrial Internet of Things is an accelerating trend within the industry. This is driven by the pursuit of enhanced operational efficiency, predictive maintenance, and improved safety.
- The integration of smart valve systems is a dominant trend in the industrial valves in oil and gas market, enabling a 25% reduction in manual inspections through the use of the industrial internet of things. The adoption of predictive maintenance analytics allows operators to anticipate component failures in gate valves and globe valves, preventing costly unplanned downtime.
- This shift is driven by the need for enhanced operational efficiency and safety in remote and hazardous environments like FPSO topside processing facilities. Furthermore, the development of digital twin modeling provides a virtual replica of physical assets, allowing for simulation and optimization of flow control solutions.
- The transition towards all-electric actuation systems also contributes to this trend, eliminating the need for pneumatic infrastructure and reducing the carbon footprint of operations.
What challenges does the Industrial Valves In Oil And Gas Industry face during its growth?
- The volatility of crude oil prices, which directly dampens capital expenditure by exploration and production companies, poses a significant challenge to market growth.
- Adherence to stringent fugitive emissions regulations presents a significant challenge, with compliance costs increasing by up to 20% for operators who fail to implement effective leak detection and repair programs. The market is under pressure to develop solutions that meet near-zero leakage performance standards, particularly in high-pressure, high-temperature environments and for handling sour gas.
- This has spurred innovation in advanced sealing technology for components like check valves, but it also increases manufacturing costs. Material degradation prevention remains a critical focus, as the failure of a single valve can lead to significant financial losses and safety risks. Consequently, achieving asset reliability optimization without incurring prohibitive expenses is a central challenge for both manufacturers and end-users.
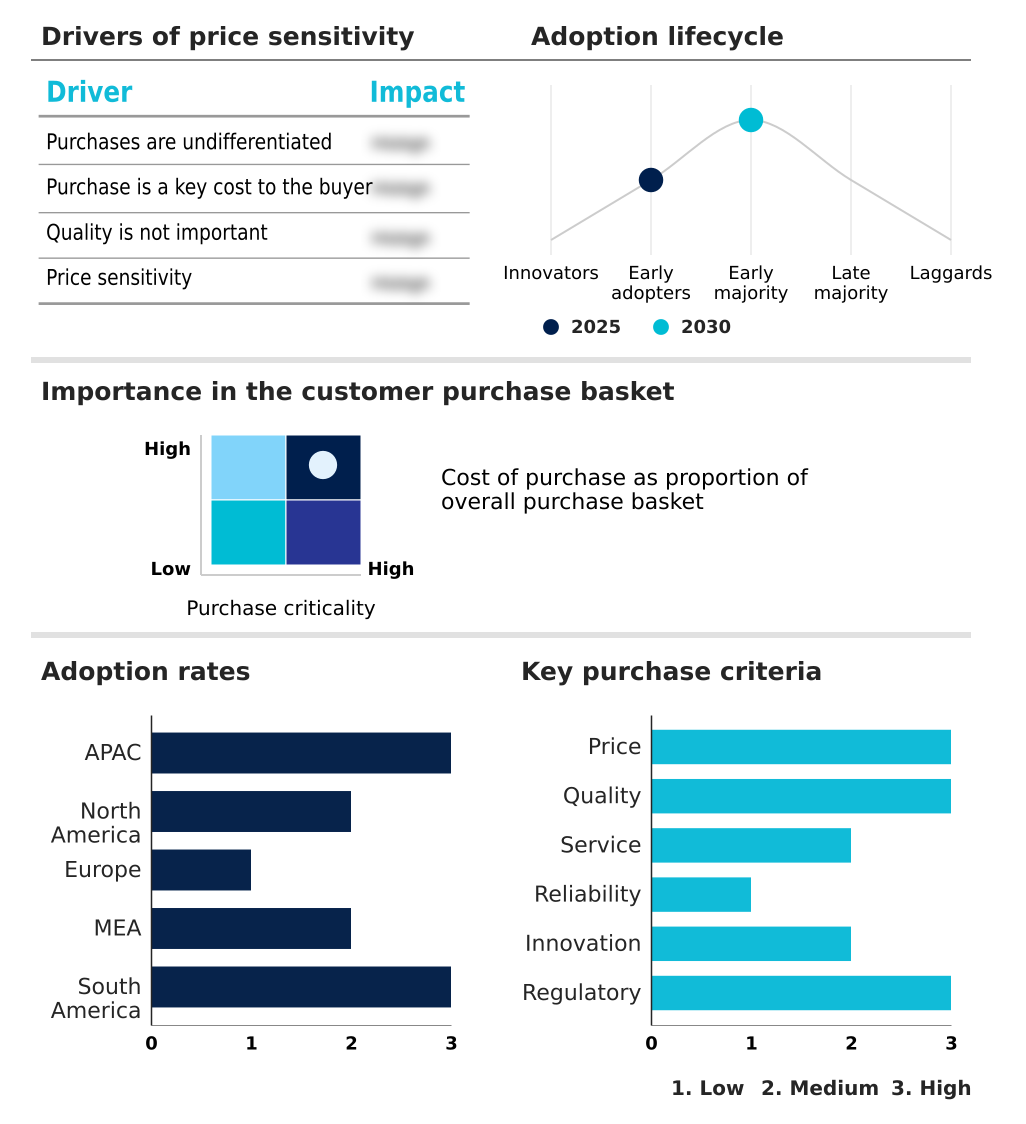
Exclusive Technavio Analysis on Customer Landscape
The industrial valves in oil and gas market forecasting report includes the adoption lifecycle of the market, covering from the innovator’s stage to the laggard’s stage. It focuses on adoption rates in different regions based on penetration. Furthermore, the industrial valves in oil and gas market report also includes key purchase criteria and drivers of price sensitivity to help companies evaluate and develop their market growth analysis strategies.
Customer Landscape of Industrial Valves In Oil And Gas Industry
Competitive Landscape
Companies are implementing various strategies, such as strategic alliances, industrial valves in oil and gas market forecast, partnerships, mergers and acquisitions, geographical expansion, and product/service launches, to enhance their presence in the industry.
AVK Group - Key offerings include a range of industrial valves, such as resilient seated gate valves, pipeline isolation valves, high-performance ball valves, and severe service control valves.
The industry research and growth report includes detailed analyses of the competitive landscape of the market and information about key companies, including:
- AVK Group
- Bray International Inc.
- Crane Co.
- Curtiss Wright Corp.
- Dembla Valves Ltd.
- Emerson Electric Co.
- Flowserve Corp.
- Hobbs Valve Ltd.
- IMI Plc
- ITT Inc.
- KITZ Corp.
- KSB SE and Co. KGaA
- Larsen and Toubro Ltd.
- Neway Valve Co. Ltd.
- Schlumberger Ltd.
- The Weir Group Plc
- Valvitalia SpA
- Velan Inc.
Qualitative and quantitative analysis of companies has been conducted to help clients understand the wider business environment as well as the strengths and weaknesses of key industry players. Data is qualitatively analyzed to categorize companies as pure play, category-focused, industry-focused, and diversified; it is quantitatively analyzed to categorize companies as dominant, leading, strong, tentative, and weak.
Market Intelligence Radar: High-Impact Developments & Growth Signals
- In the Oil and Gas Equipment and Services industry, the accelerated adoption of digital twin modeling for new infrastructure projects has directly increased demand for smart valve systems. This allows for predictive maintenance analytics and lifecycle management of flow control solutions, optimizing asset reliability by up to 20% in complex FPSO topside processing facilities.
- The implementation of stricter environmental regulations, such as the EPA's OOOOb and OOOOc rules in North America, has mandated the use of low-e valve technology across the sector. This has driven a market shift toward industrial valves in oil and gas that can demonstrate certified zero leakage performance, impacting both new capital expenditures and retrofit projects.
- A pronounced supply chain shift toward localized manufacturing of high-specification components is reshaping the market for industrial valves in oil and gas. This is a response to geopolitical disruptions and a need for greater resilience, leading to significant investments in regional production capabilities for forged and severe service control valves to reduce lead times by over 15%.
- Sustained investment in liquefied natural gas transport infrastructure globally is a primary commercial development within the sector. This expansion directly fuels demand for specialized cryogenic service valves designed for the industrial valves in oil and gas market, as every new terminal and carrier requires thousands of units capable of handling extreme temperatures and high pressures.
Dive into Technavio’s robust research methodology, blending expert interviews, extensive data synthesis, and validated models for unparalleled Industrial Valves In Oil And Gas Market insights. See full methodology.
| Market Scope | |
|---|---|
| Page number | 300 |
| Base year | 2025 |
| Historic period | 2020-2024 |
| Forecast period | 2026-2030 |
| Growth momentum & CAGR | Accelerate at a CAGR of 3.7% |
| Market growth 2026-2030 | USD 2673.8 million |
| Market structure | Fragmented |
| YoY growth 2025-2026(%) | 3.5% |
| Key countries | China, India, Japan, South Korea, Australia, Indonesia, US, Canada, Mexico, Germany, UK, France, Russia, Italy, Spain, Saudi Arabia, UAE, Egypt, South Africa, Qatar, Brazil, Argentina and Colombia |
| Competitive landscape | Leading Companies, Market Positioning of Companies, Competitive Strategies, and Industry Risks |
Research Analyst Overview
- The industrial valves in oil and gas market ecosystem is a complex network where raw material suppliers of specialty steel alloys and composites provide critical inputs for manufacturers, who produce a range of products from standard cast valves to highly engineered severe service control valves. This interaction results in products that can increase operational uptime by over 15%.
- Regulatory bodies like the American Petroleum Institute set stringent performance and safety standards, influencing design and production. Distribution channels involve direct sales to major E&P companies and a network of specialized distributors for smaller projects and MRO services, with an estimated 60% of sales occurring through direct channels.
- End-users in the upstream, midstream, and downstream sectors drive demand based on project requirements, from deepwater exploration to refinery upgrades. The value chain is supported by engineering firms and technology providers that offer advanced solutions for process automation and asset management.
What are the Key Data Covered in this Industrial Valves In Oil And Gas Market Research and Growth Report?
-
What is the expected growth of the Industrial Valves In Oil And Gas Market between 2026 and 2030?
-
The Industrial Valves In Oil And Gas Market is expected to grow by USD 2.67 billion during 2026-2030, registering a CAGR of 3.7%. Year-over-year growth in 2026 is estimated at 3.5%%. This acceleration is shaped by sustained oil and gas infrastructure expansion, which is intensifying demand across multiple end-use verticals covered in the report.
-
-
What segmentation does the market report cover?
-
The report is segmented by Product (Gate, Globe, Ball, Butterfly, and Others), Type (Cast, and Forged), Application (Upstream, Midstream, and Downstream) and Geography (APAC, North America, Europe, Middle East and Africa, South America). Among these, the Gate segment is estimated to witness significant growth during the forecast period, driven by rising adoption across key application areas. Each segment includes detailed qualitative and quantitative analysis, along with historical data from 2020-2024 and forecasts through 2030 with year-over-year growth rates.
-
-
Which regions are analyzed in the report?
-
The report covers APAC, North America, Europe, Middle East and Africa and South America. APAC is estimated to contribute 48.9% to market growth during the forecast period. Country-level analysis includes China, India, Japan, South Korea, Australia, Indonesia, US, Canada, Mexico, Germany, UK, France, Russia, Italy, Spain, Saudi Arabia, UAE, Egypt, South Africa, Qatar, Brazil, Argentina and Colombia, with dedicated market size tables and year-over-year growth for each.
-
-
What are the key growth drivers and market challenges?
-
The primary driver is sustained oil and gas infrastructure expansion, which is accelerating investment and industry demand. The main challenge is crude oil price volatility dampening capital expenditure, creating operational barriers for key market participants. The report quantifies the impact of each driver and challenge across 2026 and 2030 with comparative analysis.
-
-
Who are the major players in the Industrial Valves In Oil And Gas Market?
-
Key vendors include AVK Group, Bray International Inc., Crane Co., Curtiss Wright Corp., Dembla Valves Ltd., Emerson Electric Co., Flowserve Corp., Hobbs Valve Ltd., IMI Plc, ITT Inc., KITZ Corp., KSB SE and Co. KGaA, Larsen and Toubro Ltd., Neway Valve Co. Ltd., Schlumberger Ltd., The Weir Group Plc, Valvitalia SpA and Velan Inc.. The report provides qualitative and quantitative analysis categorizing companies as dominant, leading, strong, tentative, and weak based on their market positioning. Company profiles include business segment analysis, SWOT assessment, key offerings, and recent strategic developments.
-
Market Research Insights
- The competitive landscape for industrial valves in oil and gas is increasingly defined by technological innovation, with top-tier vendors securing over 60% of contracts for high-specification projects. Key players such as Emerson Electric Co. and Flowserve Corp. are driving this trend by launching advanced products tailored to severe service and cryogenic applications.
- For example, recent product launches focus on integrating predictive maintenance analytics, which can improve asset reliability by more than 20% over the valve's lifecycle. These developments are a direct response to the industry's need for enhanced efficiency and stricter fugitive emissions control.
- However, companies continue to navigate the challenge of volatile raw material costs, adapting by optimizing their supply chains and investing in alternative materials that offer comparable performance at a lower cost.
We can help! Our analysts can customize this industrial valves in oil and gas market research report to meet your requirements.
 RIA -
RIA - 
