Military Edge Computing Market Size and Growth Forecast 2026-2030
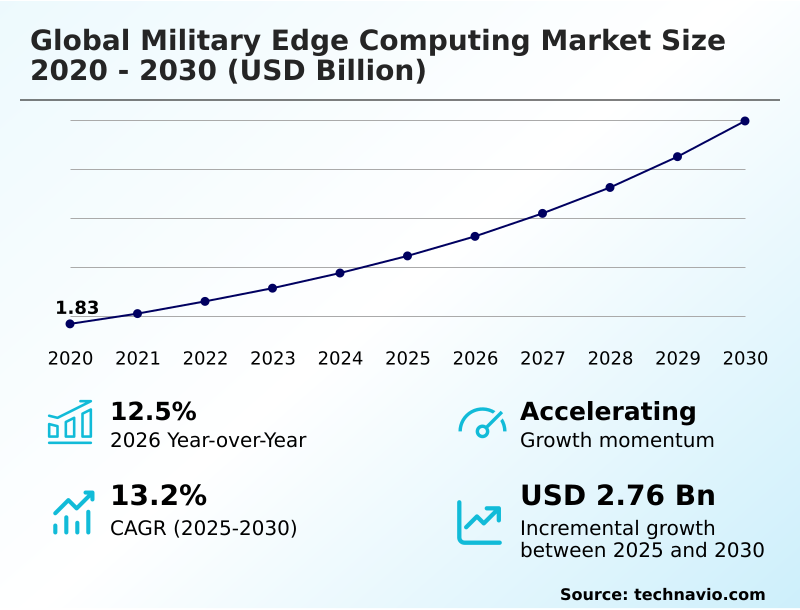
The Military Edge Computing Market size was valued at USD 3.22 billion in 2025 growing at a CAGR of 13.2% during the forecast period 2026-2030.
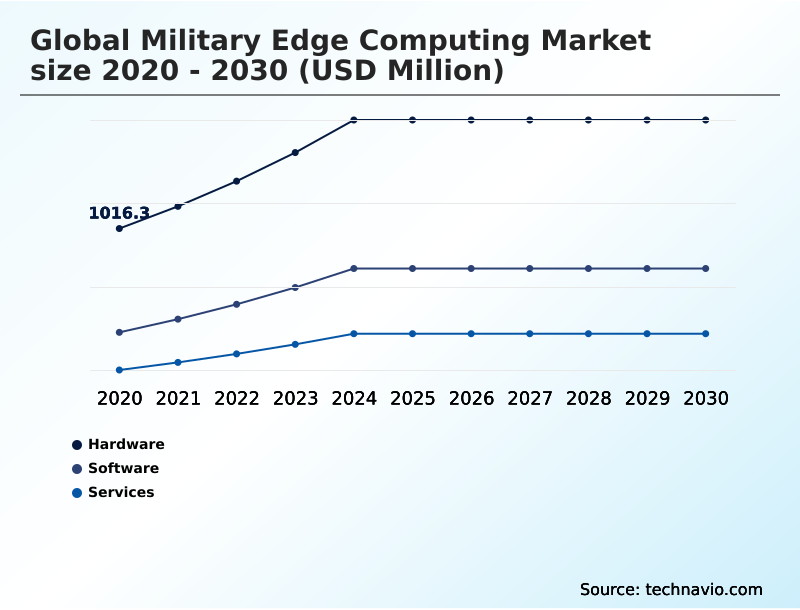
North America accounts for 41.3% of incremental growth during the forecast period. The Hardware segment by Component was valued at USD 1.56 billion in 2024, while the On premises segment holds the largest revenue share by Deployment.
The market is projected to grow by USD 4.15 billion from 2020 to 2030, with USD 2.76 billion of the growth expected during the forecast period of 2025 to 2030.
Get Key Insights on Market Forecast (PDF) Request Free Sample
Military Edge Computing Market Overview
The military edge computing market is expanding as defense agencies prioritize decentralized data processing to gain tactical advantages. This shift is driven by the need for real-time data processing in environments where low latency communications are critical for mission success. In North America, which accounts for over 41% of incremental growth, the adoption of tactical edge computing is accelerating. For instance, a forward-deployed ISR unit utilizing modular micro data centers for localized AI analysis can reduce its data transmission needs by over 90%, preserving bandwidth for critical command traffic. This is enabled by tactical machine learning models running on ruggedized hardware. However, this proliferation creates challenges, demanding robust zero trust security architectures to protect autonomous defense systems from cyber threats. The integration of software-defined radios and cognitive electronic warfare capabilities within these edge nodes is also becoming standard, enhancing network resilience in contested electromagnetic spectrums. Consequently, procurement decisions increasingly focus on open systems architectures that balance computational power with stringent security and interoperability requirements, reflecting a market that is maturing from theoretical concepts to indispensable battlefield assets.
Drivers, Trends, and Challenges in the Military Edge Computing Market
The strategic shift toward decentralized military operations is creating significant demand for specialized edge solutions. The practical implementation of on-device language model inference for defense is enabling forward-deployed analysts to process intercepted communications locally, a critical capability in intelligence gathering.
This is part of a broader trend of integrating AI into mobile command units, which rely on a ruggedized edge intelligence platform for unmanned operations. A key challenge is ensuring the convergence of edge computing with LEO satellites to provide resilient connectivity. This architecture underpins the development of secure edge data centers for disconnected environments.
To counter sophisticated cyber threats, procurement mandates zero trust security for tactical edge devices and FIPS 140-2 validated encryption, with some programs already exploring post-quantum security for military edge nodes. In practice, an autonomous drone swarm with edge AI can coordinate target acquisition without human intervention, processing sensor data using GPU-accelerated platforms for battlefield AI.
This reliance on localized intelligence is also seen in predictive maintenance using edge AI sensors, which can reduce unplanned groundings of aircraft by over 20% compared to traditional maintenance schedules.
However, achieving this vision is hampered by the need for resilient tactical networks in contested environments and significant interoperability with legacy defense communication systems, a hurdle that the modular open systems approach for field upgrades aims to address.
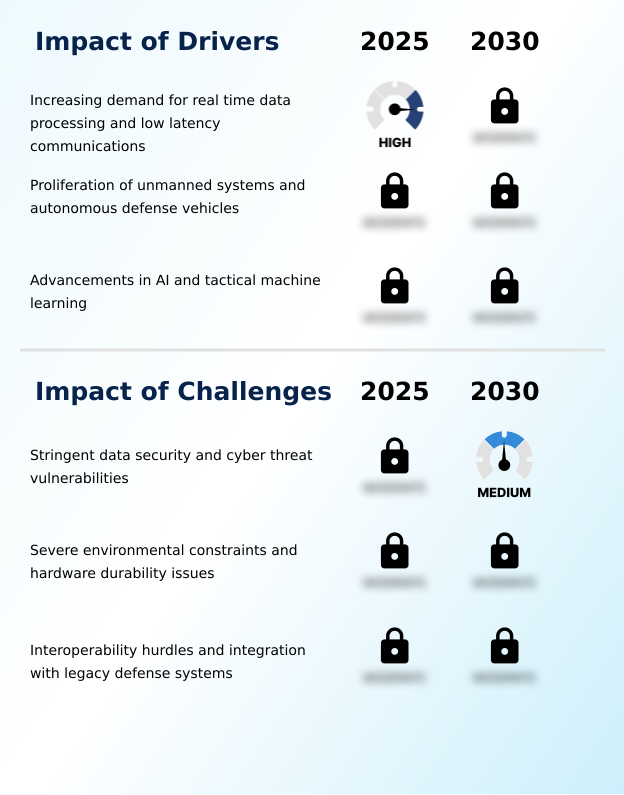
Primary Growth Driver: The increasing demand for real-time data processing and low-latency communications is a key driver for market growth.
The primary driver is the operational imperative for real-time data processing and low latency communications on the modern battlefield.
The proliferation of autonomous defense systems, which require onboard tactical machine learning for navigation and threat identification, necessitates powerful local compute capabilities. This is enabled by edge inference running on specialized hardware like neural processing units.
The demand is particularly acute in North America, which is projected to contribute over 41% of the market's total growth, largely due to major modernization programs.
Furthermore, the adoption of AI for applications such as predictive maintenance on naval vessels and aircraft is creating new demand vectors, as on-platform sensors and processors analyze equipment health to reduce downtime and improve fleet readiness without relying on continuous cloud connectivity.
Emerging Market Trend: The integration of zero trust security architectures at the tactical edge is an emerging trend. This approach mandates continuous verification for all users and devices, enhancing data protection in decentralized military networks.
Key market trends reflect a strategic pivot towards operational resilience and multi-domain connectivity. The integration of zero trust security architectures is becoming standard, using microsegmentation and continuous authentication to secure decentralized networks.
This is complemented by a physical shift toward modular micro data centers, which are engineered with electromagnetic pulse shielding and advanced thermal management to ensure functionality in austere environments. These hardened nodes serve as the backbone for processing data from space-based sensor networks.
The convergence with low earth orbit satellite constellations is creating resilient mesh networks that maintain connectivity during jamming attempts. This synergy between terrestrial and orbital assets is fundamental to achieving information superiority, supporting the market's strong year-over-year growth of over 12% and enabling seamless, secure operations across all military branches.
Key Industry Challenge: Stringent data security requirements and vulnerabilities to cyber threats represent a key challenge affecting industry growth.
Significant market expansion is constrained by three core structural issues: security, ruggedization, and integration. The decentralized nature of edge deployments heightens cyber threat vulnerabilities, demanding tamper-evident hardware and advanced defenses against signal spoofing.
Concurrently, strict hardware durability requirements and SWaP-C constraints for mobile and soldier-worn systems present immense engineering challenges, often increasing unit costs and limiting widespread adoption in budget-conscious regions. The most formidable challenge remains the interoperability hurdles associated with integrating modern edge nodes with legacy defense systems.
Many armed forces operate equipment procured over decades, creating data-sharing bottlenecks that directly contradict the goals of a unified network. Overcoming this requires substantial investment in open systems architectures, a slow and costly process that continues to temper the market's full growth potential.
Explore Full Market Dynamics Analysis Request Free Sample
Military Edge Computing Market Segmentation
The military edge computing industry research report provides comprehensive data including region-wise segment analysis, with forecasts and analysis for the period 2026-2030, as well as historical data from 2020-2024 for the following segments.
Component Segment Analysis
The hardware segment is estimated to witness significant growth during the forecast period.
Hardware forms the physical backbone of the military edge computing market, accounting for over half of all deployments. Procurement decisions are driven by the need for ruggedized edge servers and other components that offer extreme hardware durability in austere environments.
These devices, from tactical radios to wearable technology, must comply with stringent MIL-STD-810G standards for shock and vibration. A critical consideration for dismounted soldiers and unmanned aerial systems is the severe size, weight, and power constraints (SWaP-C).
Innovations in specialized microprocessors, including neural processing units and GPU-accelerated edge platforms, are enabling advanced AI/ML processing directly on these devices. To protect against physical compromise, tamper-evident hardware designs are mandated, ensuring data integrity if a device is captured.
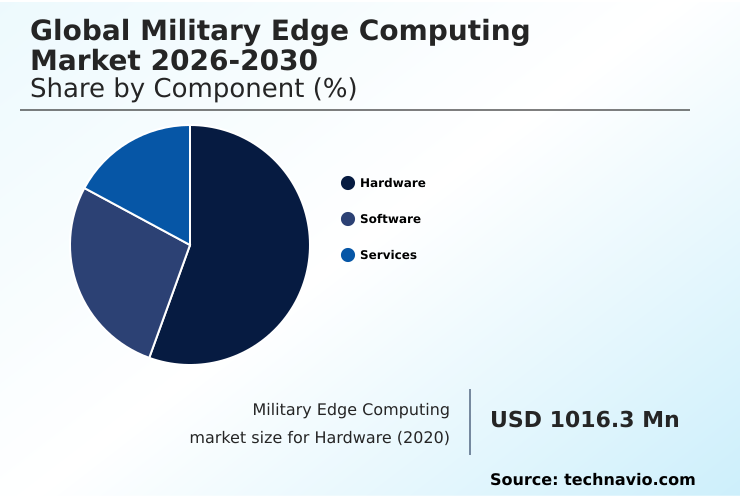
The Hardware segment was valued at USD 1.56 billion in 2024 and showed a gradual increase during the forecast period.
Military Edge Computing Market by Region: North America Leads with 41.3% Growth Share
North America is estimated to contribute 41.3% to the growth of the global market during the forecast period.
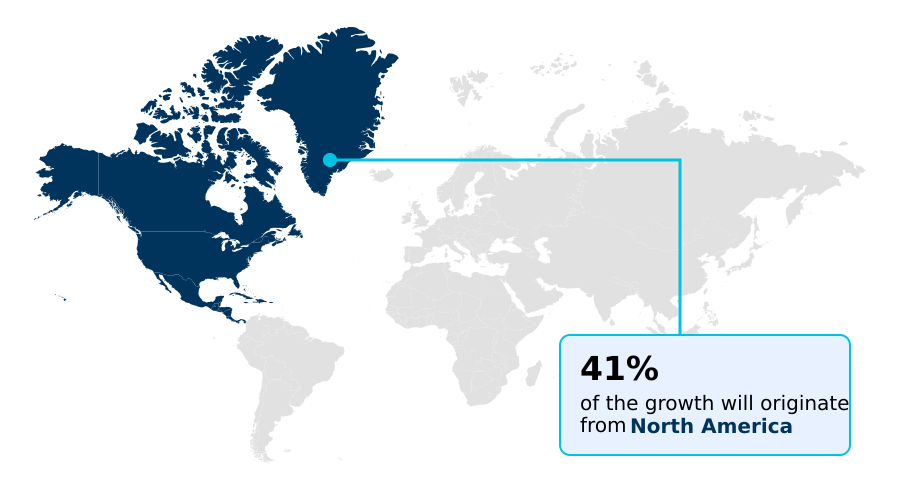
North America dominates the military edge computing landscape, accounting for over 41% of the market's incremental growth, driven by the US Department of Defense's pursuit of joint all-domain command and control (JADC2).
This initiative mandates multi-domain integration, connecting assets from the ground to low earth orbit satellite constellations.
In contrast, the APAC market is set for the fastest expansion, with a regional CAGR of 14.0%, as nations like China and India accelerate their military modernization programs.
European forces are focusing on interoperability and deploying systems with automated threat recognition capabilities.
Across all regions, development is constrained by strict SWaP constraints, especially for airborne platforms and soldier-worn systems, pushing innovation in power-efficient, miniaturized processing hardware to support mission-critical operations.
Customer Landscape Analysis for the Military Edge Computing Market
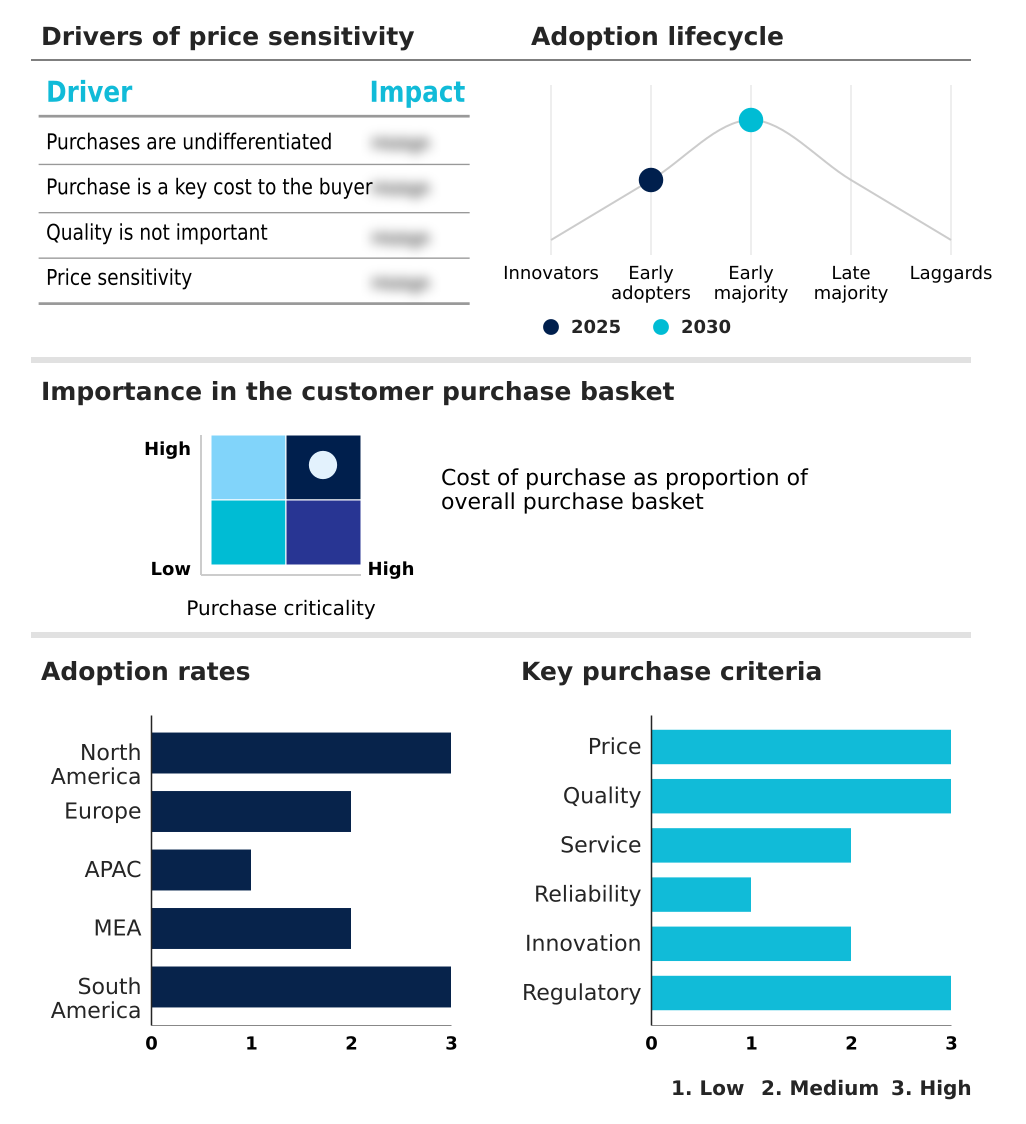
The military edge computing market forecasting report includes the adoption lifecycle of the market, covering from the innovator’s stage to the laggard’s stage. It focuses on adoption rates in different regions based on penetration. Furthermore, the military edge computing market report also includes key purchase criteria and drivers of price sensitivity to help companies evaluate and develop their market growth analysis strategies.
Competitive Landscape of the Military Edge Computing Market
Companies are implementing various strategies, such as strategic alliances, partnerships, mergers and acquisitions, geographical expansion, and product/service launches, to enhance their presence in the military edge computing market industry.
Amazon.com Inc. - Delivers ruggedized modular cloud infrastructure and AI data processing capabilities, enabling secure, disconnected operations in austere tactical environments through advanced edge computing platforms.
The industry research and growth report includes detailed analyses of the competitive landscape of the market and information about key companies, including:
- Amazon.com Inc.
- BAE Systems Plc
- Cisco Systems Inc.
- Dell Technologies Inc.
- Elbit Systems Ltd.
- General Dynamics Corp.
- Hewlett Packard Enterprise Co.
- Intel Corp.
- Kontron AG
- L3Harris Technologies Inc.
- Leonardo S.p.A.
- Lockheed Martin Corp.
- Microsoft Corp.
- Northrop Grumman Corp.
- NVIDIA Corp.
- Palantir Technologies Inc.
- Rheinmetall AG
- RTX Corp.
- Saab AB
- Thales Group
Qualitative and quantitative analysis of companies has been conducted to help clients understand the wider business environment as well as the strengths and weaknesses of key industry players. Data is qualitatively analyzed to categorize companies as pure play, category-focused, industry-focused, and diversified; it is quantitatively analyzed to categorize companies as dominant, leading, strong, tentative, and weak.
Recent Developments in the Military Edge Computing Market
- In May 2025, Anduril announced it signed a definitive agreement to acquire Ireland-based Klas, a specialist in ruggedized edge computing and tactical communications hardware for military and autonomous operations.
- In April 2025, Cerebras Systems and Canadian semiconductor startup Ranovus jointly secured a USD 45 million contract from the U.S. Department of Defense's DARPA to accelerate inter-chip communications performance for high-performance military computing systems.
- In January 2025, Redwire Corp. announced its acquisition of Edge Autonomy, a move designed to create a scaled, multi-domain company with expanded capabilities in autonomous systems and advanced defense technology.
- In September 2024, Palantir Technologies Inc. was awarded a multi-year contract expansion by the U.S. Army to deploy its AI-powered Gotham platform on tactical edge nodes, enhancing real-time data fusion for the JADC2 initiative.
Research Analyst Overview: Military Edge Computing Market
The tactical edge computing market is rapidly maturing from bespoke projects to standardized deployments, driven by the operational necessity for decentralized data processing. Hardware investments, constituting over half the market, are focused on ruggedized edge servers and modular micro data centers designed for forward-deployed ISR and autonomous defense systems.
A primary boardroom consideration for defense contractors is CAPEX allocation, balancing the development of new platforms against the challenge of overcoming interoperability hurdles with existing assets. The US Department of Defense's Modular Open Systems Approach (MOSA) mandate is influencing this strategic calculus, pushing vendors toward open architectures that mitigate vendor lock-in.
This pressures engineering teams to prioritize hardware durability and sophisticated cooling for high-power processors running tactical machine learning models. As cyber threat vulnerabilities remain a top concern, integrating software-defined radios and advanced encryption into these open systems is no longer optional but a baseline requirement for vendor qualification in this highly competitive landscape.
Dive into Technavio’s robust research methodology, blending expert interviews, extensive data synthesis, and validated models for unparalleled Military Edge Computing Market insights. See full methodology.
| Market Scope | |
|---|---|
| Page number | 310 |
| Base year | 2025 |
| Historic period | 2020-2024 |
| Forecast period | 2026-2030 |
| Growth momentum & CAGR | Accelerate at a CAGR of 13.2% |
| Market growth 2026-2030 | USD 2761.0 million |
| Market structure | Fragmented |
| YoY growth 2025-2026(%) | 12.5% |
| Key countries | US, Canada, Mexico, Germany, UK, France, Italy, Russia, Spain, China, India, Japan, South Korea, Australia, Indonesia, Saudi Arabia, UAE, South Africa, Israel, Turkey, Brazil, Argentina and Colombia |
| Competitive landscape | Leading Companies, Market Positioning of Companies, Competitive Strategies, and Industry Risks |
Military Edge Computing Market: Key Questions Answered in This Report
-
What is the expected growth of the Military Edge Computing Market between 2026 and 2030?
-
The Military Edge Computing Market is expected to grow by USD 2.76 billion during 2026-2030, registering a CAGR of 13.2%. Year-over-year growth in 2026 is estimated at 12.5%%. This acceleration is shaped by increasing demand for real time data processing and low latency communications, which is intensifying demand across multiple end-use verticals covered in the report.
-
-
What segmentation does the market report cover?
-
The report is segmented by Component (Hardware, Software, and Services), Deployment (On premises, and Cloud based), Application (ISR, Command and control, Cybersecurity, and Others) and Geography (North America, Europe, APAC, Middle East and Africa, South America). Among these, the Hardware segment is estimated to witness significant growth during the forecast period, driven by rising adoption across key application areas. Each segment includes detailed qualitative and quantitative analysis, along with historical data from 2020-2024 and forecasts through 2030 with year-over-year growth rates.
-
-
Which regions are analyzed in the report?
-
The report covers North America, Europe, APAC, Middle East and Africa and South America. North America is estimated to contribute 41.3% to market growth during the forecast period. Country-level analysis includes US, Canada, Mexico, Germany, UK, France, Italy, Russia, Spain, China, India, Japan, South Korea, Australia, Indonesia, Saudi Arabia, UAE, South Africa, Israel, Turkey, Brazil, Argentina and Colombia, with dedicated market size tables and year-over-year growth for each.
-
-
What are the key growth drivers and market challenges?
-
The primary driver is increasing demand for real time data processing and low latency communications, which is accelerating investment and industry demand. The main challenge is stringent data security and cyber threat vulnerabilities, creating operational barriers for key market participants. The report quantifies the impact of each driver and challenge across 2026 and 2030 with comparative analysis.
-
-
Who are the major players in the Military Edge Computing Market?
-
Key vendors include Amazon.com Inc., BAE Systems Plc, Cisco Systems Inc., Dell Technologies Inc., Elbit Systems Ltd., General Dynamics Corp., Hewlett Packard Enterprise Co., Intel Corp., Kontron AG, L3Harris Technologies Inc., Leonardo S.p.A., Lockheed Martin Corp., Microsoft Corp., Northrop Grumman Corp., NVIDIA Corp., Palantir Technologies Inc., Rheinmetall AG, RTX Corp., Saab AB and Thales Group. The report provides qualitative and quantitative analysis categorizing companies as dominant, leading, strong, tentative, and weak based on their market positioning. Company profiles include business segment analysis, SWOT assessment, key offerings, and recent strategic developments.
-
Military Edge Computing Market Research Insights
Market dynamics are shaped by the operational necessity for decentralized command and control, moving computational power to the tactical edge. The hardware segment, representing more than half of the market, underscores the focus on deploying ruggedized embedded computers and converged edge systems that meet MIL-STD-810G standards for durability.
In practice, a dismounted infantry unit utilizes wearable tactical computing devices to maintain secure tactical edge networking, processing local sensor data without relying on a central command post. This distributed model, supported by advanced networking gateways, enhances situational awareness.
However, procurement teams face challenges in integrating these modern hyperconverged infrastructure solutions with legacy systems, a critical hurdle for achieving seamless joint operations.
We can help! Our analysts can customize this military edge computing market research report to meet your requirements.
 RIA -
RIA - 
