Model Serving Platforms Market Analysis, Size, and Forecast 2026-2030: North America (US, Canada, and Mexico), APAC (China, Japan, and India), Europe (Germany, UK, and France), Middle East and Africa (Saudi Arabia, UAE, and South Africa), South America (Brazil, Argentina, and Chile), and Rest of World (ROW)

Model Serving Platforms Market Analysis, Size, and Forecast 2026-2030:
North America (US, Canada, and Mexico), APAC (China, Japan, and India), Europe (Germany, UK, and France), Middle East and Africa (Saudi Arabia, UAE, and South Africa), South America (Brazil, Argentina, and Chile), and Rest of World (ROW)

Published: May 2026 302 Pages SKU: IRTNTR80694

Market Overview at a Glance

$15.43 B
Market Opportunity
43.3%
CAGR 2025 - 2030
41.6%
North America Growth
$1.05 B
Machine learning models segment 2024

Model Serving Platforms Market Size and Growth Forecast 2026-2030

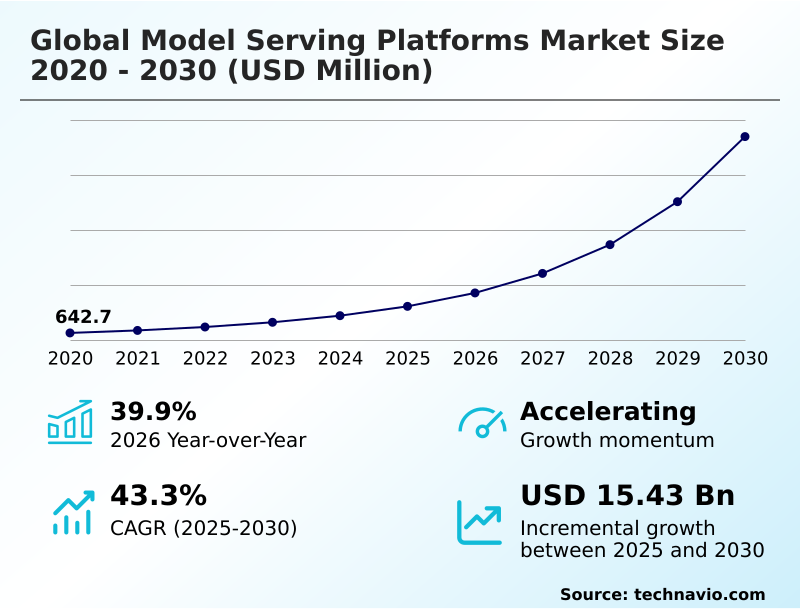
The Model Serving Platforms Market size was valued at USD 3.06 billion in 2025 growing at a CAGR of 43.3% during the forecast period 2026-2030.

North America accounts for 41.6% of incremental growth during the forecast period. The Machine learning models segment by Type was valued at USD 1.05 billion in 2024, while the Cloud segment holds the largest revenue share by Deployment.

The market is projected to grow by USD 17.85 billion from 2020 to 2030, with USD 15.43 billion of the growth expected during the forecast period of 2025 to 2030.

Get Key Insights on Market Forecast (PDF) Request Free Sample

Model Serving Platforms Market Overview

The model serving platforms market is defined by the industrialization of AI, as organizations move from experimental pilots to production systems requiring large-scale inference. This transition demands specialized cloud-native frameworks and a model-as-a-service paradigm to manage operational complexity. With year-over-year growth approaching 40%, driven largely by North America's 41.6% contribution to incremental growth, the focus is on achieving low-latency serving. For instance, a financial institution deploying real-time inference for fraud detection leverages multi-model endpoints to process millions of transactions, reducing false positives by over 30%. The increasing scrutiny on algorithmic auditability, guided by frameworks from bodies like the Federal Trade Commission, necessitates platforms with immutable audit logs and support for explainable AI modules. As the industry advances, the ability to support emerging agentic AI platforms and orchestrate compound AI systems will become a critical differentiator for vendors.

Drivers, Trends, and Challenges in the Model Serving Platforms Market

Procurement decision-makers are now focused on deploying large language models at scale, a task complicated by the need for managing inference costs for generative AI. This forces a critical comparison of cloud vs on-premises model serving, where the latter is gaining favor for building secure and sovereign AI infrastructure to protect intellectual property.

For specialized verticals, such as real-time model serving for financial services, ensuring AI model governance and compliance with mandates like the EU AI Act is non-negotiable. The operational solution often involves automating model deployment with enterprise MLOps, which integrates versioning and monitoring into CI/CD workflows.

For industrial use cases, optimizing model serving on edge devices is essential for applications like predictive maintenance and quality control. However, the rise of agentic frameworks creates challenges in orchestrating compound AI systems, where multiple models and data sources must interact seamlessly. To lower the technical barrier, low-code platforms for enterprise AI deployment are emerging.

The strategic importance of these decisions is amplified by the fact that inference can consume up to 80% of AI budgets, a figure that dwarfs typical IT infrastructure costs and elevates the role of FinOps in operational planning.

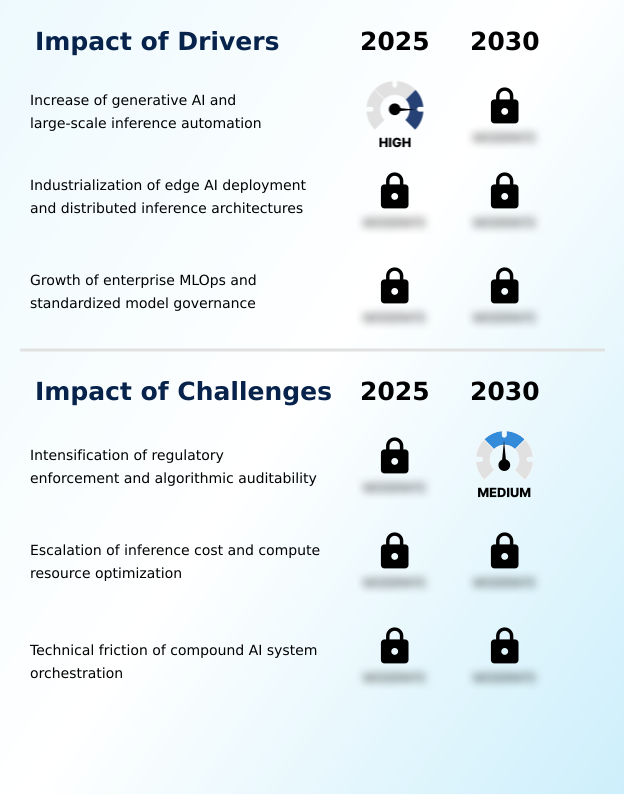
Primary Growth Driver: The rapid adoption of generative AI and the industrialization of large-scale inference automation are key drivers for the market.

Growth is primarily driven by generative AI automation and the strategic expansion of edge AI deployment.

The industrialization of large-scale inference for applications ranging from deep learning model serving to large language model deployment necessitates platforms offering high throughput and low latency.

This market is in an accelerating phase, with a projected CAGR of 43.3%, as enterprises require scalable distributed inference architectures.

The adoption of standardized technologies like API-first inference containers and Kubernetes for orchestration underpins this expansion, enabling organizations to manage complex AI workloads efficiently across hybrid and multi-cloud environments, thereby maximizing the utility of their AI investments.

Emerging Market Trend: The institutionalization of low-code frameworks is a primary market trend. This shift enables the deployment of no-code model architectures, democratizing access to AI.

Key market trends include the institutionalization of low-code model deployment and the expansion of sovereign model serving. The simplification of deployment through no-code MLOps and serverless inference functions allows business units to operationalize AI without deep engineering expertise, a trend particularly prominent in APAC, which is forecast to grow at a CAGR of 44.3%.

Concurrently, data residency compliance mandates, such as the framework established by the Indian AI Safety Institute, are driving demand for localized AI governance. This requires platforms that can guarantee data remains within national borders, a critical factor for government and regulated industries in Europe and Asia.

Key Industry Challenge: The intensification of regulatory enforcement and the growing requirement for algorithmic auditability present a primary challenge to industry growth.

Primary market challenges stem from escalating inference cost optimization pressures and the intensification of algorithmic auditability requirements. With inference now accounting for up to 80% of total AI budgets in many enterprises, the demand for sophisticated inference FinOps tools to manage expenses is acute.

Simultaneously, regulatory frameworks like the EU AI Act are compelling organizations to adopt standardized model governance, with nearly 70% of large firms now using formal checklists. This creates technical debt, as legacy systems must be retrofitted with explainable AI modules and immutable audit logs.

The increasing complexity of orchestrating compound AI systems further strains engineering resources, making robust model performance telemetry essential for operational stability.

Explore Full Market Dynamics Analysis Request Free Sample

Model Serving Platforms Market Segmentation

The model serving platforms industry research report provides comprehensive data including region-wise segment analysis, with forecasts and analysis for the period 2026-2030, as well as historical data from 2020-2024 for the following segments.

Market Segment by Type
  • Machine learning models
  • Deep learning models
  • Large language models
Market Segment by Deployment
  • Cloud
  • On premises
Market Segment by End-user
  • BFSI
  • IT and telecom
  • Healthcare
  • Manufacturing
  • Others
Market Segment by Geography
North America
US, Canada, Mexico
APAC
China, Japan, India, South Korea, Australia, Indonesia
Europe
Germany, UK, France, Italy, Spain, The Netherlands
Middle East and Africa
Saudi Arabia, UAE, South Africa, Israel, Turkey
South America
Brazil, Argentina, Chile

Type Segment Analysis

The machine learning models segment is estimated to witness significant growth during the forecast period.

The machine learning models segment remains foundational for enterprise operations, handling high-frequency tasks like fraud detection and churn prediction using established predictive models.

Procurement decisions prioritize platforms offering robust automated a-b testing and comprehensive automated model monitoring to manage performance and mitigate drift.

While not as compute-intensive as deep learning model serving, this segment demands platforms that provide low-latency real-time inference and integrate seamlessly into enterprise mlops pipelines for continuous deployment.

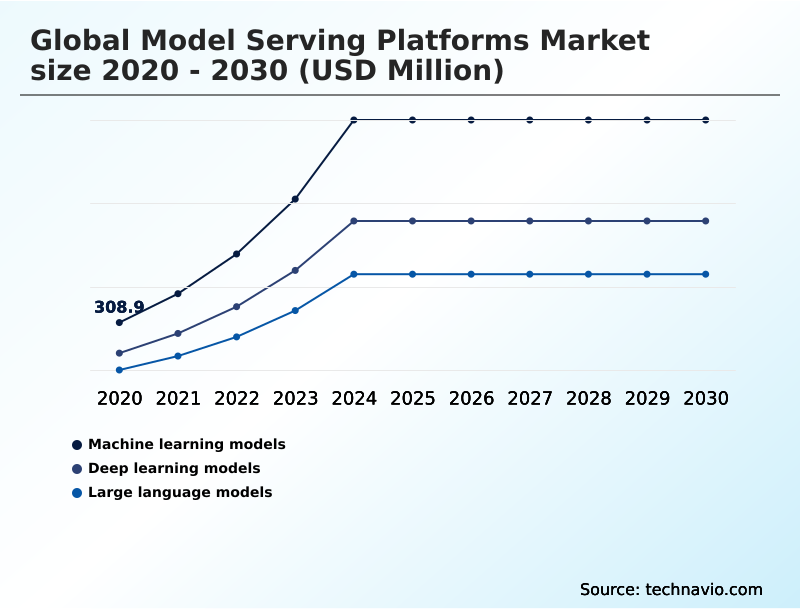
The segment's scale, growing from a base of over 1,420 to nearly 2,000 between consecutive years, highlights its sustained importance. These platforms excel at model lifecycle management, ensuring the reliability required for business-critical functions and supporting complex predictive maintenance models.

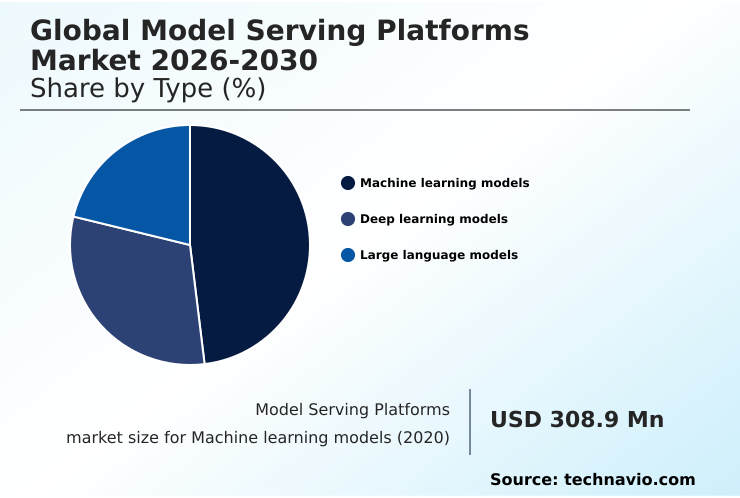
The Machine learning models segment was valued at USD 1.05 billion in 2024 and showed a gradual increase during the forecast period.

Model Serving Platforms Market by Region: North America Leads with 41.6% Growth Share

North America is estimated to contribute 41.6% to the growth of the global market during the forecast period.

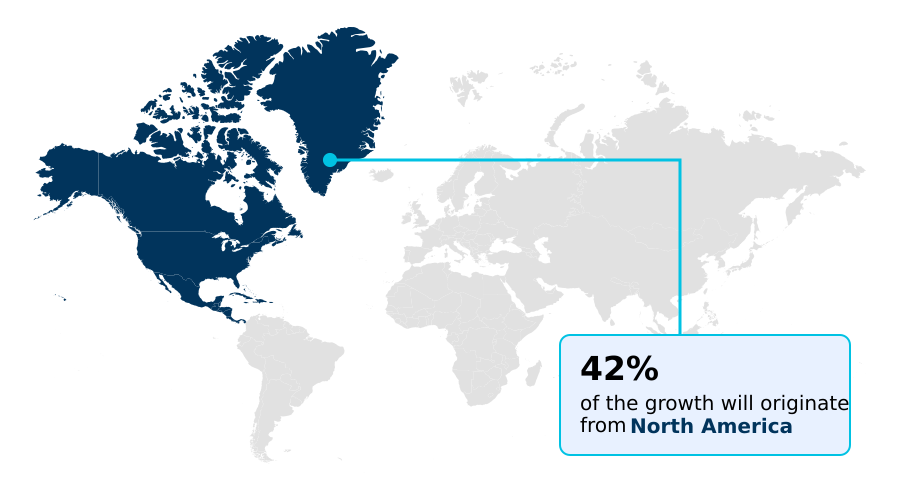
The geographic landscape is led by North America, which accounts for 41.6% of incremental growth, driven by hyperscale providers optimizing for low-latency serving and high-performance computing.

In contrast, APAC is the fastest-growing region, with a 44.3% CAGR, prioritizing edge AI deployment to support its mobile-first economies and smart city initiatives.

The European market is heavily influenced by regulations like GDPR and the EU AI Act, which fuels demand for sovereign model serving and platforms that ensure data residency compliance.

This regulatory pressure is fostering innovation in confidential serving nodes and localized AI governance frameworks across all developed regions.

This divergence creates a market where US-based firms focus on raw performance, while European and some APAC players prioritize auditable, secure, and compliant deployment architectures.

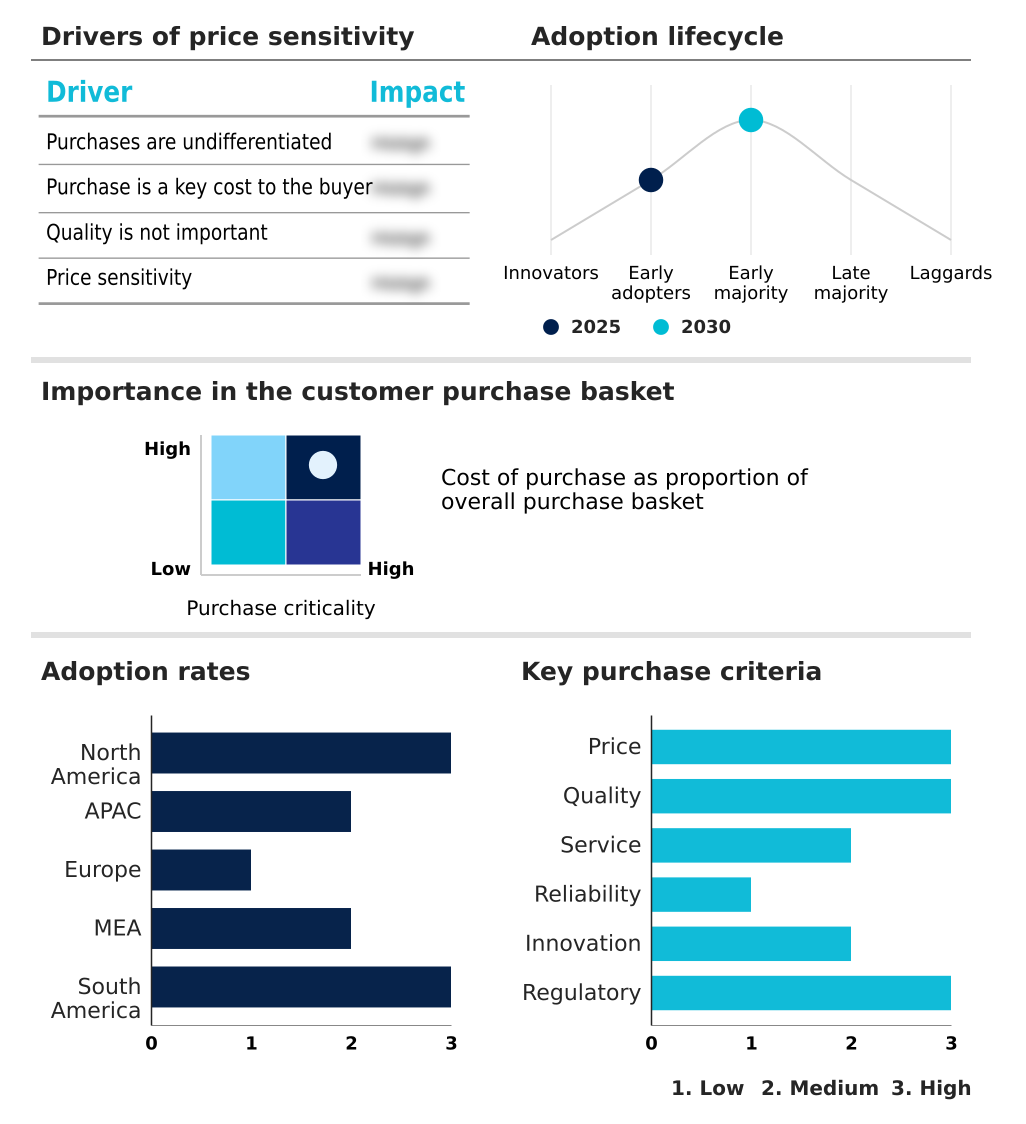
Customer Landscape Analysis for the Model Serving Platforms Market

The model serving platforms market forecasting report includes the adoption lifecycle of the market, covering from the innovator’s stage to the laggard’s stage. It focuses on adoption rates in different regions based on penetration. Furthermore, the model serving platforms market report also includes key purchase criteria and drivers of price sensitivity to help companies evaluate and develop their market growth analysis strategies.

Competitive Landscape of the Model Serving Platforms Market

Companies are implementing various strategies, such as strategic alliances, partnerships, mergers and acquisitions, geographical expansion, and product/service launches, to enhance their presence in the model serving platforms market industry.

Alibaba Cloud - Platforms enable scalable ML model deployment, featuring real-time inference, elastic compute resources, and seamless integration with cloud-native AI and big data services.

The industry research and growth report includes detailed analyses of the competitive landscape of the market and information about key companies, including:

  • Alibaba Cloud
  • Amazon.com Inc.
  • Anyscale Inc.
  • Baidu Inc.
  • Cloudera Inc.
  • Databricks Inc.
  • Dataiku Inc.
  • DataRobot Inc.
  • Domino Data Lab Inc.
  • Google LLC
  • H2O.ai Inc.
  • Hugging Face Inc.
  • IBM Corp.
  • Microsoft Corp.
  • NVIDIA Corp.
  • Oracle Corp.
  • SAS Institute Inc.
  • Seldon Technologies
  • Snowflake Inc.
  • TIBCO Software Inc.
  • Valohai Oy

Qualitative and quantitative analysis of companies has been conducted to help clients understand the wider business environment as well as the strengths and weaknesses of key industry players. Data is qualitatively analyzed to categorize companies as pure play, category-focused, industry-focused, and diversified; it is quantitatively analyzed to categorize companies as dominant, leading, strong, tentative, and weak.

Recent Developments in the Model Serving Platforms Market

  • In May 2025, Latent Agent launched the industry's first agentic edge AI platform, designed to simplify and automate the deployment of intelligent agents across diverse hardware ecosystems without requiring manual model-to-hardware optimization.
  • In April 2025, the Indian Ministry of Electronics and Information Technology inaugurated the AI Safety Institute with an initial funding of over USD 20 million to oversee the research and validation of models served within its national digital ecosystem.
  • In March 2025, Databricks Inc. expanded its serverless model serving ecosystem by hosting the Google Gemini 3.1 Flash Lite model, enabling enterprise users to deploy high-efficiency, low-latency reasoning agents directly within their existing security perimeters.
  • In January 2025, the Electronics and Telecommunications Research Institute released the TANGO framework, a no-code MLOps solution designed to automate neural network generation and deployment across cloud, Kubernetes, and on-premises environments.

Research Analyst Overview: Model Serving Platforms Market

The market is shifting toward autonomous, production-grade AI pipelines, where robust enterprise MLOps and standardized model governance are baseline requirements, not premium features. Deployment is consolidating around Kubernetes-native serving for container orchestration, essential for managing both deep learning model serving and large language model deployment.

A primary boardroom consideration is the total cost of ownership, as inference cost optimization becomes critical when compute can consume up to 80% of an AI project's budget.

Compliance with regulations like the EU AI Act is driving investment in explainable AI modules and platforms capable of automated model monitoring and automated drift detection to manage the full model lifecycle management. This scrutiny means generative AI automation cannot scale without verifiable and transparent operational guardrails.

Therefore, vendors that integrate seamless, auditable workflows for retrieval-augmented generation and other compound AI systems are best positioned for growth.

Dive into Technavio’s robust research methodology, blending expert interviews, extensive data synthesis, and validated models for unparalleled Model Serving Platforms Market insights. See full methodology.

Request Free Sample

Market Scope
Page number 302
Base year 2025
Historic period 2020-2024
Forecast period 2026-2030
Growth momentum & CAGR Accelerate at a CAGR of 43.3%
Market growth 2026-2030 USD 15433.4 million
Market structure Fragmented
YoY growth 2025-2026(%) 39.9%
Key countries US, Canada, Mexico, China, Japan, India, South Korea, Australia, Indonesia, Germany, UK, France, Italy, Spain, The Netherlands, Saudi Arabia, UAE, South Africa, Israel, Turkey, Brazil, Argentina and Chile
Competitive landscape Leading Companies, Market Positioning of Companies, Competitive Strategies, and Industry Risks

Model Serving Platforms Market: Key Questions Answered in This Report

  • What is the expected growth of the Model Serving Platforms Market between 2026 and 2030?

    • The Model Serving Platforms Market is expected to grow by USD 15.43 billion during 2026-2030, registering a CAGR of 43.3%. Year-over-year growth in 2026 is estimated at 39.9%%. This acceleration is shaped by increase of generative ai and large-scale inference automation, which is intensifying demand across multiple end-use verticals covered in the report.

  • What segmentation does the market report cover?

    • The report is segmented by Type (Machine learning models, Deep learning models, and Large language models), Deployment (Cloud, and On premises), End-user (BFSI, IT and telecom, Healthcare, Manufacturing, and Others) and Geography (North America, APAC, Europe, Middle East and Africa, South America). Among these, the Machine learning models segment is estimated to witness significant growth during the forecast period, driven by rising adoption across key application areas. Each segment includes detailed qualitative and quantitative analysis, along with historical data from 2020-2024 and forecasts through 2030 with year-over-year growth rates.

  • Which regions are analyzed in the report?

    • The report covers North America, APAC, Europe, Middle East and Africa and South America. North America is estimated to contribute 41.6% to market growth during the forecast period. Country-level analysis includes US, Canada, Mexico, China, Japan, India, South Korea, Australia, Indonesia, Germany, UK, France, Italy, Spain, The Netherlands, Saudi Arabia, UAE, South Africa, Israel, Turkey, Brazil, Argentina and Chile, with dedicated market size tables and year-over-year growth for each.

  • What are the key growth drivers and market challenges?

    • The primary driver is increase of generative ai and large-scale inference automation, which is accelerating investment and industry demand. The main challenge is intensification of regulatory enforcement and algorithmic auditability, creating operational barriers for key market participants. The report quantifies the impact of each driver and challenge across 2026 and 2030 with comparative analysis.

  • Who are the major players in the Model Serving Platforms Market?

    • Key vendors include Alibaba Cloud, Amazon.com Inc., Anyscale Inc., Baidu Inc., Cloudera Inc., Databricks Inc., Dataiku Inc., DataRobot Inc., Domino Data Lab Inc., Google LLC, H2O.ai Inc., Hugging Face Inc., IBM Corp., Microsoft Corp., NVIDIA Corp., Oracle Corp., SAS Institute Inc., Seldon Technologies, Snowflake Inc., TIBCO Software Inc. and Valohai Oy. The report provides qualitative and quantitative analysis categorizing companies as dominant, leading, strong, tentative, and weak based on their market positioning. Company profiles include business segment analysis, SWOT assessment, key offerings, and recent strategic developments.

Model Serving Platforms Market Research Insights

Market dynamics are shaped by the tension between performance demands and financial realities. The need for high-speed interconnects and terabit serving architectures to support high-frequency applications is balanced against the strategic imperative for GPU resource optimization. A key vendor qualification criterion is now multi-cloud compatibility, allowing enterprises to avoid lock-in and leverage hybrid cloud orchestration for cost and latency benefits.

In manufacturing, the deployment of predictive maintenance models on edge devices illustrates this balance, where localized processing must comply with data residency standards like GDPR. Furthermore, the push for sovereign model serving is reshaping procurement, demanding platforms that can guarantee data locality.

North America's market contribution, which is over 1.4 times that of APAC, highlights the advanced adoption in regions with mature cloud infrastructure, though APAC's rapid growth indicates a closing gap.

We can help! Our analysts can customize this model serving platforms market research report to meet your requirements.

Get in touch

1. Executive Summary

1.1 Market overview

Executive Summary - Chart on Market Overview
Executive Summary - Data Table on Market Overview
Executive Summary - Chart on Global Market Characteristics
Executive Summary - Chart on Market by Geography
Executive Summary - Chart on Market Segmentation by Type
Executive Summary - Chart on Market Segmentation by Deployment
Executive Summary - Chart on Market Segmentation by End-user
Executive Summary - Chart on Incremental Growth
Executive Summary - Data Table on Incremental Growth
Executive Summary - Chart on Company Market Positioning

2. Technavio Analysis

2.1 Analysis of price sensitivity, lifecycle, customer purchase basket, adoption rates, and purchase criteria

2.2 Criticality of inputs and Factors of differentiation

Chart on Overview on criticality of inputs and factors of differentiation

2.3 Factors of disruption

Chart on Overview on factors of disruption

2.4 Impact of drivers and challenges

Chart on Impact of drivers and challenges in 2025 and 2030

3. Market Landscape

3.1 Market ecosystem

Chart on Parent Market
Data Table on - Parent Market

3.2 Market characteristics

Chart on Market characteristics analysis

3.3 Value chain analysis

Chart on Value chain analysis

4. Market Sizing

4.1 Market definition

Data Table on Offerings of companies included in the market definition

4.2 Market segment analysis

Market segments

4.3 Market size 2025

4.4 Market outlook: Forecast for 2025-2030

Chart on Global - Market size and forecast 2025-2030 ($ million)
Data Table on Global - Market size and forecast 2025-2030 ($ million)
Chart on Global Market: Year-over-year growth 2025-2030 (%)
Data Table on Global Market: Year-over-year growth 2025-2030 (%)

5. Historic Market Size

5.1 Global Model Serving Platforms Market 2020 - 2024

Historic Market Size - Data Table on Global Model Serving Platforms Market 2020 - 2024 ($ million)

5.2 Type segment analysis 2020 - 2024

Historic Market Size - Type Segment 2020 - 2024 ($ million)

5.3 Deployment segment analysis 2020 - 2024

Historic Market Size - Deployment Segment 2020 - 2024 ($ million)

5.4 End-user segment analysis 2020 - 2024

Historic Market Size - End-user Segment 2020 - 2024 ($ million)

5.5 Geography segment analysis 2020 - 2024

Historic Market Size - Geography Segment 2020 - 2024 ($ million)

5.6 Country segment analysis 2020 - 2024

Historic Market Size - Country Segment 2020 - 2024 ($ million)

6. Qualitative Analysis

6.1 Impact of AI in global model serving platforms market

6.2 Impact of geopolitical conflict for global model serving platforms market

7. Five Forces Analysis

7.1 Five forces summary

Five forces analysis - Comparison between 2025 and 2030

7.2 Bargaining power of buyers

Bargaining power of buyers - Impact of key factors 2025 and 2030

7.3 Bargaining power of suppliers

Bargaining power of suppliers - Impact of key factors in 2025 and 2030

7.4 Threat of new entrants

Threat of new entrants - Impact of key factors in 2025 and 2030

7.5 Threat of substitutes

Threat of substitutes - Impact of key factors in 2025 and 2030

7.6 Threat of rivalry

Threat of rivalry - Impact of key factors in 2025 and 2030

7.7 Market condition

Chart on Market condition - Five forces 2025 and 2030

8. Market Segmentation by Type

8.1 Market segments

Chart on Type - Market share 2025-2030 (%)
Data Table on Type - Market share 2025-2030 (%)

8.2 Comparison by Type

Chart on Comparison by Type
Data Table on Comparison by Type

8.3 Machine learning models - Market size and forecast 2025-2030

Chart on Machine learning models - Market size and forecast 2025-2030 ($ million)
Data Table on Machine learning models - Market size and forecast 2025-2030 ($ million)
Chart on Machine learning models - Year-over-year growth 2025-2030 (%)
Data Table on Machine learning models - Year-over-year growth 2025-2030 (%)

8.4 Deep learning models - Market size and forecast 2025-2030

Chart on Deep learning models - Market size and forecast 2025-2030 ($ million)
Data Table on Deep learning models - Market size and forecast 2025-2030 ($ million)
Chart on Deep learning models - Year-over-year growth 2025-2030 (%)
Data Table on Deep learning models - Year-over-year growth 2025-2030 (%)

8.5 Large language models - Market size and forecast 2025-2030

Chart on Large language models - Market size and forecast 2025-2030 ($ million)
Data Table on Large language models - Market size and forecast 2025-2030 ($ million)
Chart on Large language models - Year-over-year growth 2025-2030 (%)
Data Table on Large language models - Year-over-year growth 2025-2030 (%)

8.6 Market opportunity by Type

Market opportunity by Type ($ million)
Data Table on Market opportunity by Type ($ million)

9. Market Segmentation by Deployment

9.1 Market segments

Chart on Deployment - Market share 2025-2030 (%)
Data Table on Deployment - Market share 2025-2030 (%)

9.2 Comparison by Deployment

Chart on Comparison by Deployment
Data Table on Comparison by Deployment

9.3 Cloud - Market size and forecast 2025-2030

Chart on Cloud - Market size and forecast 2025-2030 ($ million)
Data Table on Cloud - Market size and forecast 2025-2030 ($ million)
Chart on Cloud - Year-over-year growth 2025-2030 (%)
Data Table on Cloud - Year-over-year growth 2025-2030 (%)

9.4 On premises - Market size and forecast 2025-2030

Chart on On premises - Market size and forecast 2025-2030 ($ million)
Data Table on On premises - Market size and forecast 2025-2030 ($ million)
Chart on On premises - Year-over-year growth 2025-2030 (%)
Data Table on On premises - Year-over-year growth 2025-2030 (%)

9.5 Market opportunity by Deployment

Market opportunity by Deployment ($ million)
Data Table on Market opportunity by Deployment ($ million)

10. Market Segmentation by End-user

10.1 Market segments

Chart on End-user - Market share 2025-2030 (%)
Data Table on End-user - Market share 2025-2030 (%)

10.2 Comparison by End-user

Chart on Comparison by End-user
Data Table on Comparison by End-user

10.3 BFSI - Market size and forecast 2025-2030

Chart on BFSI - Market size and forecast 2025-2030 ($ million)
Data Table on BFSI - Market size and forecast 2025-2030 ($ million)
Chart on BFSI - Year-over-year growth 2025-2030 (%)
Data Table on BFSI - Year-over-year growth 2025-2030 (%)

10.4 IT and telecom - Market size and forecast 2025-2030

Chart on IT and telecom - Market size and forecast 2025-2030 ($ million)
Data Table on IT and telecom - Market size and forecast 2025-2030 ($ million)
Chart on IT and telecom - Year-over-year growth 2025-2030 (%)
Data Table on IT and telecom - Year-over-year growth 2025-2030 (%)

10.5 Healthcare - Market size and forecast 2025-2030

Chart on Healthcare - Market size and forecast 2025-2030 ($ million)
Data Table on Healthcare - Market size and forecast 2025-2030 ($ million)
Chart on Healthcare - Year-over-year growth 2025-2030 (%)
Data Table on Healthcare - Year-over-year growth 2025-2030 (%)

10.6 Manufacturing - Market size and forecast 2025-2030

Chart on Manufacturing - Market size and forecast 2025-2030 ($ million)
Data Table on Manufacturing - Market size and forecast 2025-2030 ($ million)
Chart on Manufacturing - Year-over-year growth 2025-2030 (%)
Data Table on Manufacturing - Year-over-year growth 2025-2030 (%)

10.7 Others - Market size and forecast 2025-2030

Chart on Others - Market size and forecast 2025-2030 ($ million)
Data Table on Others - Market size and forecast 2025-2030 ($ million)
Chart on Others - Year-over-year growth 2025-2030 (%)
Data Table on Others - Year-over-year growth 2025-2030 (%)

10.8 Market opportunity by End-user

Market opportunity by End-user ($ million)
Data Table on Market opportunity by End-user ($ million)

11. Customer Landscape

11.1 Customer landscape overview

Analysis of price sensitivity, lifecycle, customer purchase basket, adoption rates, and purchase criteria

12. Geographic Landscape

12.1 Geographic segmentation

Chart on Market share by geography 2025-2030 (%)
Data Table on Market share by geography 2025-2030 (%)

12.2 Geographic comparison

Chart on Geographic comparison
Data Table on Geographic comparison

12.3 North America - Market size and forecast 2025-2030

Chart on North America - Market size and forecast 2025-2030 ($ million)
Data Table on North America - Market size and forecast 2025-2030 ($ million)
Chart on North America - Year-over-year growth 2025-2030 (%)
Data Table on North America - Year-over-year growth 2025-2030 (%)
Chart on Regional Comparison - North America
Data Table on Regional Comparison - North America

12.3.1 US - Market size and forecast 2025-2030

Chart on US - Market size and forecast 2025-2030 ($ million)
Data Table on US - Market size and forecast 2025-2030 ($ million)
Chart on US - Year-over-year growth 2025-2030 (%)
Data Table on US - Year-over-year growth 2025-2030 (%)

12.3.2 Canada - Market size and forecast 2025-2030

Chart on Canada - Market size and forecast 2025-2030 ($ million)
Data Table on Canada - Market size and forecast 2025-2030 ($ million)
Chart on Canada - Year-over-year growth 2025-2030 (%)
Data Table on Canada - Year-over-year growth 2025-2030 (%)

12.3.3 Mexico - Market size and forecast 2025-2030

Chart on Mexico - Market size and forecast 2025-2030 ($ million)
Data Table on Mexico - Market size and forecast 2025-2030 ($ million)
Chart on Mexico - Year-over-year growth 2025-2030 (%)
Data Table on Mexico - Year-over-year growth 2025-2030 (%)

12.4 APAC - Market size and forecast 2025-2030

Chart on APAC - Market size and forecast 2025-2030 ($ million)
Data Table on APAC - Market size and forecast 2025-2030 ($ million)
Chart on APAC - Year-over-year growth 2025-2030 (%)
Data Table on APAC - Year-over-year growth 2025-2030 (%)
Chart on Regional Comparison - APAC
Data Table on Regional Comparison - APAC

12.4.1 China - Market size and forecast 2025-2030

Chart on China - Market size and forecast 2025-2030 ($ million)
Data Table on China - Market size and forecast 2025-2030 ($ million)
Chart on China - Year-over-year growth 2025-2030 (%)
Data Table on China - Year-over-year growth 2025-2030 (%)

12.4.2 Japan - Market size and forecast 2025-2030

Chart on Japan - Market size and forecast 2025-2030 ($ million)
Data Table on Japan - Market size and forecast 2025-2030 ($ million)
Chart on Japan - Year-over-year growth 2025-2030 (%)
Data Table on Japan - Year-over-year growth 2025-2030 (%)

12.4.3 India - Market size and forecast 2025-2030

Chart on India - Market size and forecast 2025-2030 ($ million)
Data Table on India - Market size and forecast 2025-2030 ($ million)
Chart on India - Year-over-year growth 2025-2030 (%)
Data Table on India - Year-over-year growth 2025-2030 (%)

12.4.4 South Korea - Market size and forecast 2025-2030

Chart on South Korea - Market size and forecast 2025-2030 ($ million)
Data Table on South Korea - Market size and forecast 2025-2030 ($ million)
Chart on South Korea - Year-over-year growth 2025-2030 (%)
Data Table on South Korea - Year-over-year growth 2025-2030 (%)

12.4.5 Australia - Market size and forecast 2025-2030

Chart on Australia - Market size and forecast 2025-2030 ($ million)
Data Table on Australia - Market size and forecast 2025-2030 ($ million)
Chart on Australia - Year-over-year growth 2025-2030 (%)
Data Table on Australia - Year-over-year growth 2025-2030 (%)

12.4.6 Indonesia - Market size and forecast 2025-2030

Chart on Indonesia - Market size and forecast 2025-2030 ($ million)
Data Table on Indonesia - Market size and forecast 2025-2030 ($ million)
Chart on Indonesia - Year-over-year growth 2025-2030 (%)
Data Table on Indonesia - Year-over-year growth 2025-2030 (%)

12.5 Europe - Market size and forecast 2025-2030

Chart on Europe - Market size and forecast 2025-2030 ($ million)
Data Table on Europe - Market size and forecast 2025-2030 ($ million)
Chart on Europe - Year-over-year growth 2025-2030 (%)
Data Table on Europe - Year-over-year growth 2025-2030 (%)
Chart on Regional Comparison - Europe
Data Table on Regional Comparison - Europe

12.5.1 Germany - Market size and forecast 2025-2030

Chart on Germany - Market size and forecast 2025-2030 ($ million)
Data Table on Germany - Market size and forecast 2025-2030 ($ million)
Chart on Germany - Year-over-year growth 2025-2030 (%)
Data Table on Germany - Year-over-year growth 2025-2030 (%)

12.5.2 UK - Market size and forecast 2025-2030

Chart on UK - Market size and forecast 2025-2030 ($ million)
Data Table on UK - Market size and forecast 2025-2030 ($ million)
Chart on UK - Year-over-year growth 2025-2030 (%)
Data Table on UK - Year-over-year growth 2025-2030 (%)

12.5.3 France - Market size and forecast 2025-2030

Chart on France - Market size and forecast 2025-2030 ($ million)
Data Table on France - Market size and forecast 2025-2030 ($ million)
Chart on France - Year-over-year growth 2025-2030 (%)
Data Table on France - Year-over-year growth 2025-2030 (%)

12.5.4 Italy - Market size and forecast 2025-2030

Chart on Italy - Market size and forecast 2025-2030 ($ million)
Data Table on Italy - Market size and forecast 2025-2030 ($ million)
Chart on Italy - Year-over-year growth 2025-2030 (%)
Data Table on Italy - Year-over-year growth 2025-2030 (%)

12.5.5 Spain - Market size and forecast 2025-2030

Chart on Spain - Market size and forecast 2025-2030 ($ million)
Data Table on Spain - Market size and forecast 2025-2030 ($ million)
Chart on Spain - Year-over-year growth 2025-2030 (%)
Data Table on Spain - Year-over-year growth 2025-2030 (%)

12.5.6 The Netherlands - Market size and forecast 2025-2030

Chart on The Netherlands - Market size and forecast 2025-2030 ($ million)
Data Table on The Netherlands - Market size and forecast 2025-2030 ($ million)
Chart on The Netherlands - Year-over-year growth 2025-2030 (%)
Data Table on The Netherlands - Year-over-year growth 2025-2030 (%)

12.6 Middle East and Africa - Market size and forecast 2025-2030

Chart on Middle East and Africa - Market size and forecast 2025-2030 ($ million)
Data Table on Middle East and Africa - Market size and forecast 2025-2030 ($ million)
Chart on Middle East and Africa - Year-over-year growth 2025-2030 (%)
Data Table on Middle East and Africa - Year-over-year growth 2025-2030 (%)
Chart on Regional Comparison - Middle East and Africa
Data Table on Regional Comparison - Middle East and Africa

12.6.1 Saudi Arabia - Market size and forecast 2025-2030

Chart on Saudi Arabia - Market size and forecast 2025-2030 ($ million)
Data Table on Saudi Arabia - Market size and forecast 2025-2030 ($ million)
Chart on Saudi Arabia - Year-over-year growth 2025-2030 (%)
Data Table on Saudi Arabia - Year-over-year growth 2025-2030 (%)

12.6.2 UAE - Market size and forecast 2025-2030

Chart on UAE - Market size and forecast 2025-2030 ($ million)
Data Table on UAE - Market size and forecast 2025-2030 ($ million)
Chart on UAE - Year-over-year growth 2025-2030 (%)
Data Table on UAE - Year-over-year growth 2025-2030 (%)

12.6.3 South Africa - Market size and forecast 2025-2030

Chart on South Africa - Market size and forecast 2025-2030 ($ million)
Data Table on South Africa - Market size and forecast 2025-2030 ($ million)
Chart on South Africa - Year-over-year growth 2025-2030 (%)
Data Table on South Africa - Year-over-year growth 2025-2030 (%)

12.6.4 Israel - Market size and forecast 2025-2030

Chart on Israel - Market size and forecast 2025-2030 ($ million)
Data Table on Israel - Market size and forecast 2025-2030 ($ million)
Chart on Israel - Year-over-year growth 2025-2030 (%)
Data Table on Israel - Year-over-year growth 2025-2030 (%)

12.6.5 Turkey - Market size and forecast 2025-2030

Chart on Turkey - Market size and forecast 2025-2030 ($ million)
Data Table on Turkey - Market size and forecast 2025-2030 ($ million)
Chart on Turkey - Year-over-year growth 2025-2030 (%)
Data Table on Turkey - Year-over-year growth 2025-2030 (%)

12.7 South America - Market size and forecast 2025-2030

Chart on South America - Market size and forecast 2025-2030 ($ million)
Data Table on South America - Market size and forecast 2025-2030 ($ million)
Chart on South America - Year-over-year growth 2025-2030 (%)
Data Table on South America - Year-over-year growth 2025-2030 (%)
Chart on Regional Comparison - South America
Data Table on Regional Comparison - South America

12.7.1 Brazil - Market size and forecast 2025-2030

Chart on Brazil - Market size and forecast 2025-2030 ($ million)
Data Table on Brazil - Market size and forecast 2025-2030 ($ million)
Chart on Brazil - Year-over-year growth 2025-2030 (%)
Data Table on Brazil - Year-over-year growth 2025-2030 (%)

12.7.2 Argentina - Market size and forecast 2025-2030

Chart on Argentina - Market size and forecast 2025-2030 ($ million)
Data Table on Argentina - Market size and forecast 2025-2030 ($ million)
Chart on Argentina - Year-over-year growth 2025-2030 (%)
Data Table on Argentina - Year-over-year growth 2025-2030 (%)

12.7.3 Chile - Market size and forecast 2025-2030

Chart on Chile - Market size and forecast 2025-2030 ($ million)
Data Table on Chile - Market size and forecast 2025-2030 ($ million)
Chart on Chile - Year-over-year growth 2025-2030 (%)
Data Table on Chile - Year-over-year growth 2025-2030 (%)

12.8 Market opportunity by geography

Market opportunity by geography ($ million)
Data Tables on Market opportunity by geography ($ million)

13. Drivers, Challenges, and Opportunity

13.1 Market drivers

Increase of generative AI and large-scale inference automation
Industrialization of edge AI deployment and distributed inference architectures
Growth of enterprise MLOps and standardized model governance

13.2 Market challenges

Intensification of regulatory enforcement and algorithmic auditability
Escalation of inference cost and compute resource optimization
Technical friction of compound AI system orchestration

13.3 Impact of drivers and challenges

Impact of drivers and challenges in 2025 and 2030

13.4 Market opportunities

Institutionalization of low-code frameworks and no-code model deployment
Proliferation of high-speed interconnects and 1.6-terabit serving architectures
Expansion of sovereign serving and localized AI governance

14. Competitive Landscape

14.1 Overview

14.2

Overview on criticality of inputs and factors of differentiation

14.3 Landscape disruption

Overview on factors of disruption

14.4 Industry risks

Impact of key risks on business

15. Competitive Analysis

15.1 Companies profiled

Companies covered

15.2 Company ranking index

15.3 Market positioning of companies

Matrix on companies position and classification

15.4 Alibaba Cloud

Alibaba Cloud - Overview
Alibaba Cloud - Product / Service
Alibaba Cloud - Key offerings
SWOT

15.5 Amazon.com Inc.

Amazon.com Inc. - Overview
Amazon.com Inc. - Business segments
Amazon.com Inc. - Key news
Amazon.com Inc. - Key offerings
Amazon.com Inc. - Segment focus
SWOT

15.6 Baidu Inc.

Baidu Inc. - Overview
Baidu Inc. - Business segments
Baidu Inc. - Key news
Baidu Inc. - Key offerings
Baidu Inc. - Segment focus
SWOT

15.7 Cloudera Inc.

Cloudera Inc. - Overview
Cloudera Inc. - Product / Service
Cloudera Inc. - Key offerings
SWOT

15.8 Databricks Inc.

Databricks Inc. - Overview
Databricks Inc. - Product / Service
Databricks Inc. - Key offerings
SWOT

15.9 Dataiku Inc.

Dataiku Inc. - Overview
Dataiku Inc. - Product / Service
Dataiku Inc. - Key offerings
SWOT

15.10 DataRobot Inc.

DataRobot Inc. - Overview
DataRobot Inc. - Product / Service
DataRobot Inc. - Key offerings
SWOT

15.11 Google LLC

Google LLC - Overview
Google LLC - Product / Service
Google LLC - Key offerings
SWOT

15.12 Hugging Face Inc.

Hugging Face Inc. - Overview
Hugging Face Inc. - Product / Service
Hugging Face Inc. - Key offerings
SWOT

15.13 IBM Corp.

IBM Corp. - Overview
IBM Corp. - Business segments
IBM Corp. - Key news
IBM Corp. - Key offerings
IBM Corp. - Segment focus
SWOT

15.14 Microsoft Corp.

Microsoft Corp. - Overview
Microsoft Corp. - Business segments
Microsoft Corp. - Key news
Microsoft Corp. - Key offerings
Microsoft Corp. - Segment focus
SWOT

15.15 NVIDIA Corp.

NVIDIA Corp. - Overview
NVIDIA Corp. - Business segments
NVIDIA Corp. - Key news
NVIDIA Corp. - Key offerings
NVIDIA Corp. - Segment focus
SWOT

15.16 Oracle Corp.

Oracle Corp. - Overview
Oracle Corp. - Business segments
Oracle Corp. - Key news
Oracle Corp. - Key offerings
Oracle Corp. - Segment focus
SWOT

15.17 SAS Institute Inc.

SAS Institute Inc. - Overview
SAS Institute Inc. - Product / Service
SAS Institute Inc. - Key offerings
SWOT

15.18 TIBCO Software Inc.

TIBCO Software Inc. - Overview
TIBCO Software Inc. - Product / Service
TIBCO Software Inc. - Key offerings
SWOT

16. Appendix

16.1 Scope of the report

Market definition
Objectives
Notes and caveats

16.2 Inclusions and exclusions checklist

Inclusions checklist
Exclusions checklist

16.3 Currency conversion rates for US$

16.4 Research methodology

16.5 Data procurement

Information sources

16.6 Data validation

16.7 Validation techniques employed for market sizing

16.8 Data synthesis

16.9 360 degree market analysis

16.10 List of abbreviations

Research Methodology

Technavio presents a detailed picture of the market by way of study, synthesis, and summation of data from multiple sources. The analysts have presented the various facets of the market with a particular focus on identifying the key industry influencers. The data thus presented is comprehensive, reliable, and the result of extensive research, both primary and secondary.

INFORMATION SOURCES

Primary sources

  • Manufacturers and suppliers
  • Channel partners
  • Industry experts
  • Strategic decision makers

Secondary sources

  • Industry journals and periodicals
  • Government data
  • Financial reports of key industry players
  • Historical data
  • Press releases

DATA ANALYSIS

Data Synthesis

  • Collation of data
  • Estimation of key figures
  • Analysis of derived insights

Data Validation

  • Triangulation with data models
  • Reference against proprietary databases
  • Corroboration with industry experts

REPORT WRITING

Qualitative

  • Market drivers
  • Market challenges
  • Market trends
  • Five forces analysis

Quantitative

  • Market size and forecast
  • Market segmentation
  • Geographical insights
  • Competitive landscape

Interested in this report?

Get your sample now to see our research methodology and insights!

Download Now

Frequently Asked Questions

Model Serving Platforms market growth will increase by USD 15433.4 million during 2026-2030.

The Model Serving Platforms market is expected to grow at a CAGR of 43.3% during 2026-2030.

Model Serving Platforms market is segmented by Type (Machine learning models, Deep learning models, Large language models) Deployment (Cloud, On premises) End-user (BFSI, IT and telecom, Healthcare, Manufacturing, Others)

Alibaba Cloud, Amazon.com Inc., Anyscale Inc., Baidu Inc., Cloudera Inc., Databricks Inc., Dataiku Inc., DataRobot Inc., Domino Data Lab Inc., Google LLC, H2O.ai Inc., Hugging Face Inc., IBM Corp., Microsoft Corp., NVIDIA Corp., Oracle Corp., SAS Institute Inc., Seldon Technologies, Snowflake Inc., TIBCO Software Inc., Valohai Oy are a few of the key vendors in the Model Serving Platforms market.

North America will register the highest growth rate of 41.6% among the other regions. Therefore, the Model Serving Platforms market in North America is expected to garner significant business opportunities for the vendors during the forecast period.

US, Canada, Mexico, China, Japan, India, South Korea, Australia, Indonesia, Germany, UK, France, Italy, Spain, The Netherlands, Saudi Arabia, UAE, South Africa, Israel, Turkey, Brazil, Argentina, Chile

  • Increase of generative AI and large-scale inference automation is the driving factor this market.

The Model Serving Platforms market vendors should focus on grabbing business opportunities from the Type segment as it accounted for the largest market share in the base year.
RIA - Research AI Assistant
Ask RIA