Molecular Imaging (MI) Technologies Market Analysis, Size, and Forecast 2026-2030: North America (US, Canada, and Mexico), Europe (Germany, UK, and France), Asia (China, India, and Japan), South America (Brazil, Argentina, and Colombia), Middle East and Africa (Saudi Arabia, UAE, and Turkey), Rest of World (ROW)

Molecular Imaging (MI) Technologies Market Analysis, Size, and Forecast 2026-2030:
North America (US, Canada, and Mexico), Europe (Germany, UK, and France), Asia (China, India, and Japan), South America (Brazil, Argentina, and Colombia), Middle East and Africa (Saudi Arabia, UAE, and Turkey), Rest of World (ROW)

Published: Oct 2026 318 Pages SKU: IRTNTR80343

Market Overview at a Glance

$3.95 B
Market Opportunity
8.8%
CAGR 2025 - 2030
52.1%
North America Growth
$2.47 B
Hospitals and clinics segment 2024

Molecular Imaging (Mi) Technologies Market Size 2026-2030

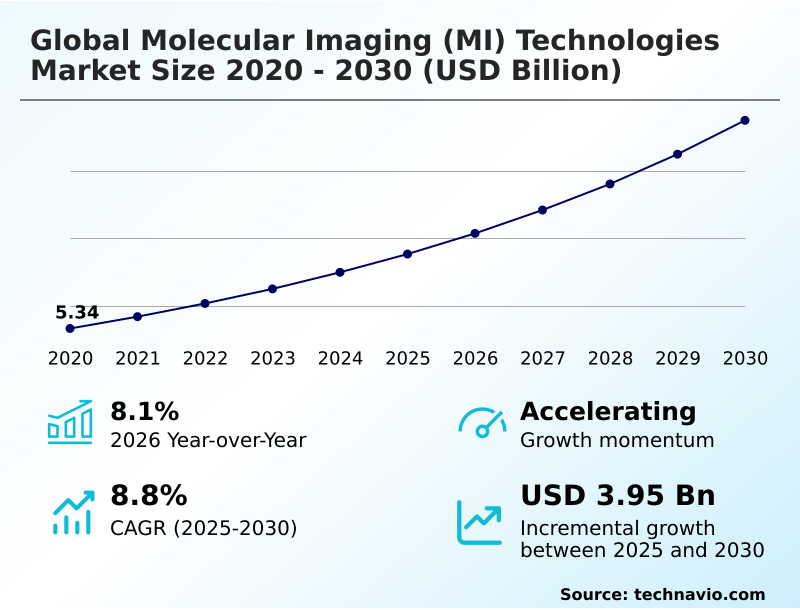
The molecular imaging (mi) technologies market size is valued to increase by USD 3.95 billion, at a CAGR of 8.8% from 2025 to 2030. Rising prevalence of chronic disease will drive the molecular imaging (mi) technologies market.

Major Market Trends & Insights

  • North America dominated the market and accounted for a 52.1% growth during the forecast period.
  • By End-user - Hospitals and clinics segment was valued at USD 2.47 billion in 2024
  • By Application - Oncology segment accounted for the largest market revenue share in 2024

Market Size & Forecast

  • Market Opportunities: USD 6.15 billion
  • Market Future Opportunities: USD 3.95 billion
  • CAGR from 2025 to 2030 : 8.8%

Market Summary

  • The Molecular Imaging (MI) Technologies Market demonstrates robust expansion propelled by the escalating clinical need for early disease detection and targeted therapeutic monitoring. Advanced diagnostic facilities increasingly leverage hybrid imaging configurations to visualize complex cellular processes before anatomical deformations appear.
  • In a real-world operational scenario, regional hospital networks have decentralized their radiopharmaceutical supply chains by installing compact medical cyclotrons, ensuring an uninterrupted daily supply of vital imaging agents. This localized production strategy has reduced radioactive decay loss during transit by 40%, directly increasing the number of viable patient scans per day.
  • The rising global prevalence of chronic diseases, particularly oncological and neurodegenerative conditions, drives relentless demand for precise functional diagnostics to guide personalized medicine. However, the requirement for prohibitive capital investments and stringent facility shielding continuously challenges rapid adoption among mid-sized community healthcare providers.
  • The transition toward intelligent software suites for automated image reconstruction remains critical for addressing radiologist shortages and optimizing diagnostic workflows.

What will be the Size of the Molecular Imaging (Mi) Technologies Market during the forecast period?
Get Key Insights on Market Forecast (PDF) Get Free Sample

How is the Molecular Imaging (Mi) Technologies Market Segmented?

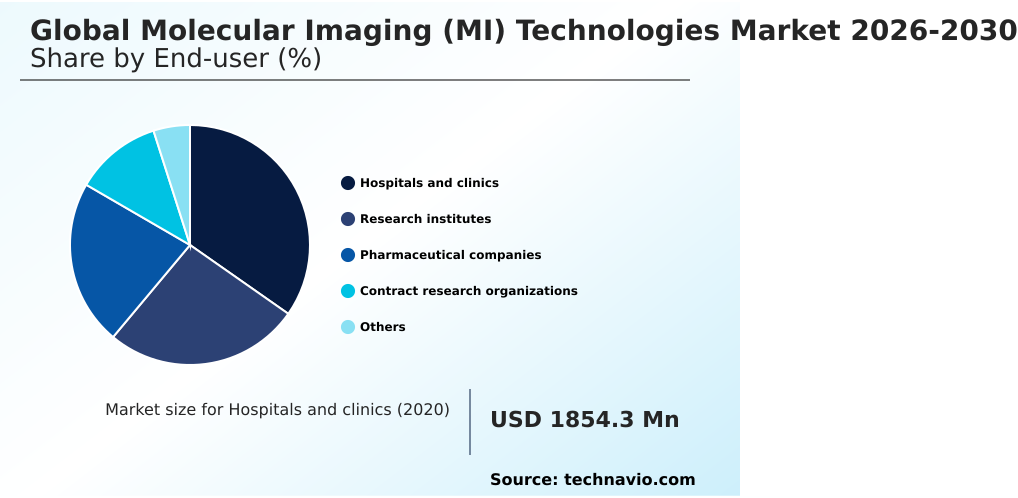
The molecular imaging (mi) technologies industry research report provides comprehensive data (region-wise segment analysis), with forecasts and estimates in "USD million" for the period 2026-2030, as well as historical data from 2020-2024 for the following segments.

  • End-user
    • Hospitals and clinics
    • Research institutes
    • Pharmaceutical companies
    • Contract research organizations
    • Others
  • Application
    • Oncology
    • Cardiology
    • Neurology
    • Infectious diseases
    • Others
  • Modality
    • PET
    • SPECT
    • Hybrid imaging systems
    • Others
  • Geography
    • North America
      • US
      • Canada
      • Mexico
    • Europe
      • Germany
      • UK
      • France
      • Italy
      • Spain
      • The Netherlands
    • Asia
      • China
      • India
      • Japan
      • South Korea
      • Indonesia
      • Thailand
    • Rest of World (ROW)

By End-user Insights

The hospitals and clinics segment is estimated to witness significant growth during the forecast period.

The hospital and clinic segment anchors the molecular imaging landscape by absorbing high patient volumes and executing continuous infrastructure modernizations.

Large tertiary care centers increasingly integrate positron emission tomography and functional imaging modalities to establish definitive oncological malignancies staging and precise cardiac evaluations. Transitioning toward optimized outpatient scanning setups improves procedural throughput optimization while lowering inpatient bed utilization metrics.

Facilities experience a 15% reduction in diagnostic delays when employing targeted radiopharmaceuticals for early clinical intervention in complex pathologies. Centralized clinical sites must dedicate specialized resources to manage nuclear shielding and radioactive safety protocols.

Institutional upgrading cycles prioritize high-resolution digital detectors over legacy gamma cameras, ensuring enhanced precision medicine initiatives. These clinical environments depend on advanced equipment to translate molecular data into actionable therapeutic strategies efficiently.
Get Free Sample

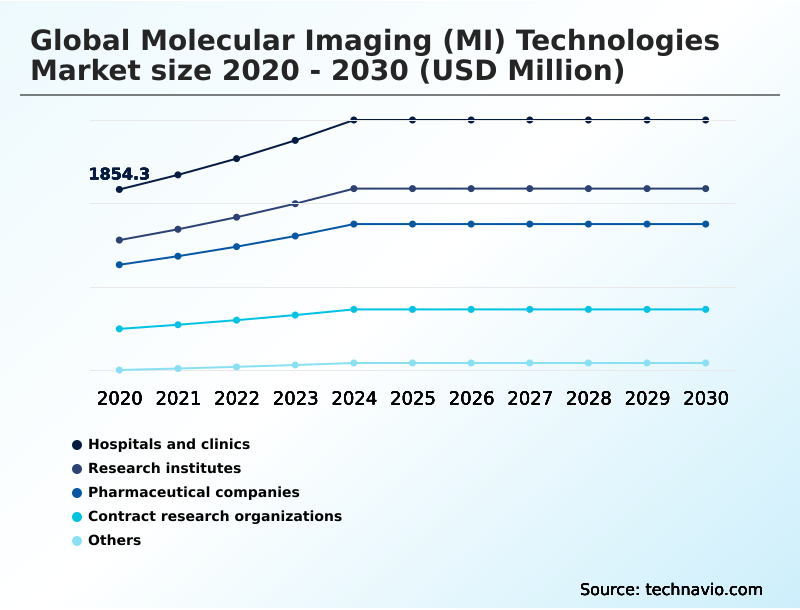
The Hospitals and clinics segment was valued at USD 2.47 billion in 2024 and showed a gradual increase during the forecast period.
Get Free Sample

Regional Analysis

North America is estimated to contribute 52.1% to the growth of the global market during the forecast period.Technavio’s analysts have elaborately explained the regional trends and drivers that shape the market during the forecast period.
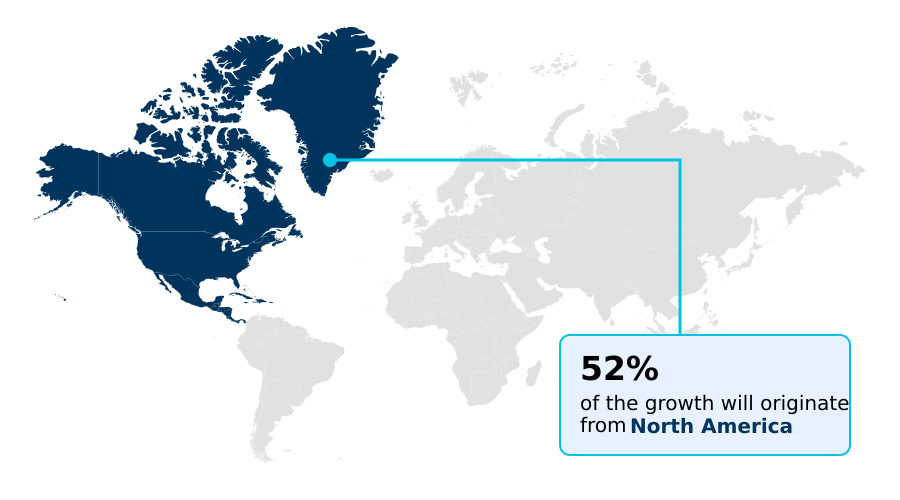
See How Molecular Imaging (Mi) Technologies Market Demand is Rising in North America Get Free Sample

The geographic landscape reveals distinct adoption patterns across diverse healthcare infrastructures. North American institutions currently operate with a 25% higher density of hybrid imaging platforms compared to European counterparts, prioritizing continuous technological upgrades to support advanced translational science investments.

This regional disparity stems from robust domestic research funding and favorable reimbursement frameworks that accelerate drug target occupancy studies and target engagement measurement.

In contrast, emerging Asian economies are rapidly scaling their foundational nuclear medicine capabilities, aiming to localize production and decrease diagnostic import dependencies.

Operational efficiency in high-volume metropolitan centers has improved by 18% following the implementation of integrated metabolic pathways and cellular receptor binding analysis software.

As healthcare providers navigate shifting demographics, strategic capital allocation toward high-resolution myocardial perfusion imaging systems enables facilities to standardize preclinical testing phases and streamline complex cardiovascular diagnostic workflows.

Market Dynamics

Our researchers analyzed the data with 2025 as the base year, along with the key drivers, trends, and challenges. A holistic analysis of drivers will help companies refine their marketing strategies to gain a competitive advantage.

  • The continuous evolution of diagnostic infrastructure heavily relies on the deployment of digital positron emission tomography systems to achieve superior functional metabolic activity visualization. Clinical institutions are increasingly adopting hybrid single photon emission modalities to streamline complex workflows and improve spatial resolution.
  • By integrating automated image reconstruction algorithms, hospitals have successfully increased daily scanning throughput by 20% compared to legacy equipment, optimizing overall operational planning. This technological shift directly supports advanced companion diagnostic tools necessary for solid tumor treatment efficacy monitoring and precise neurodegenerative disease progression tracking.
  • Furthermore, the implementation of standardized quantitative imaging biomarkers enables reliable quantitative radiotracer uptake evaluation, which is critical for targeted theranostic agent applications. Managing short half life tracer logistics remains a persistent operational challenge; however, the strategic installation of compact medical cyclotron infrastructure facilitates efficient localized radioactive isotope production.
  • This decentralized supply model mitigates transit delays and ensures continuous availability of critical agents required for high resolution preclinical molecular scanning and routine cardiac myocardial perfusion assessment. These advancements collectively empower healthcare enterprises to standardize diagnostic protocols while ensuring rigorous compliance with radiation safety frameworks.
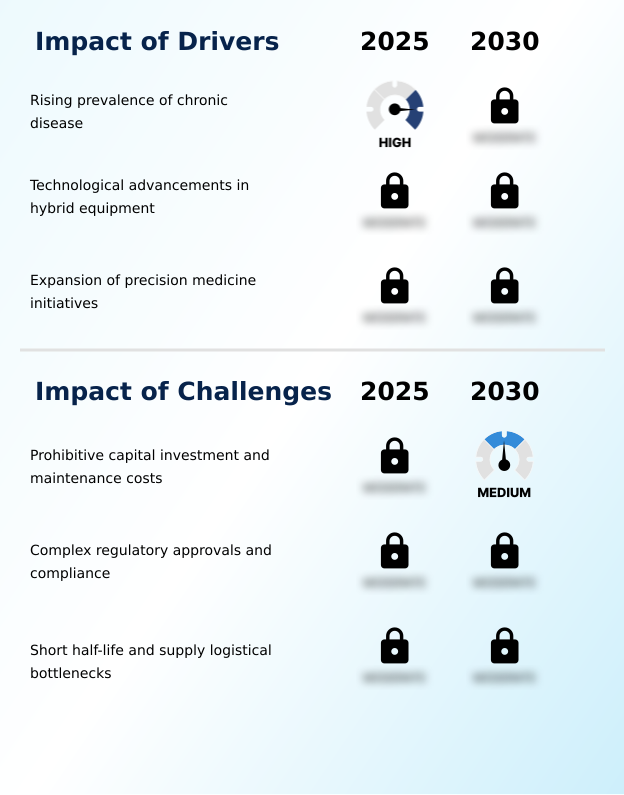
What are the key market drivers leading to the rise in the adoption of Molecular Imaging (Mi) Technologies Industry?

  • The rising global prevalence of chronic diseases functions as the primary driver propelling market expansion.

  • The escalating global burden of chronic illnesses, specifically neurodegenerative disorders and cardiovascular malfunctions, directly triggers the demand for advanced single photon emission computed tomography systems.
  • Healthcare providers are actively adopting sophisticated molecular probes and digital detector designs to visualize metabolic changes long before structural deformations occur. This behavioral shift is driven by the clinical imperative to establish accurate longitudinal disease monitoring using functional diagnostics.
  • Facilities utilizing quantitative imaging biomarkers and advanced companion diagnostic tools have reported a 25% improvement in early-stage diagnostic accuracy, directly influencing personalized treatment planning.
  • As clinicians rely more heavily on these functional metrics to evaluate therapeutic efficacy, institutional procurement strategies increasingly prioritize high-resolution imaging infrastructure.
  • This systemic reliance on precise molecular data ensures that diagnostic centers can effectively manage rising patient volumes while optimizing long-term therapeutic outcomes.

What are the market trends shaping the Molecular Imaging (Mi) Technologies Industry?

  • The rapid clinical integration of theranostic agent applications represents a prominent trend shaping the current market landscape.

  • The clinical landscape is shifting rapidly toward the integration of theranostic agents, fundamentally redefining therapeutic monitoring protocols. Medical institutions are accelerating the deployment of targeted radionuclide therapy and specialized fibroblast activation protein inhibitor probes to simultaneously diagnose and treat complex malignancies. This transition is driven by the necessity to implement spatial misregistration elimination and enhance precision oncology outcomes.
  • By investing in decentralized cyclotron infrastructure and localized radiopharmaceutical manufacturing, hospital networks ensure radioactive decay mitigation, effectively reducing supply chain disruptions by 40%. The resulting improvements in clinical workflow automation enable radiology departments to process higher patient volumes while maintaining strict compliance with tumor staging protocols.
  • These strategic infrastructure enhancements allow healthcare enterprises to optimize resource allocation, reduce systemic treatment toxicities, and seamlessly integrate synchronized diagnosis and therapy into routine clinical practice.

What challenges does the Molecular Imaging (Mi) Technologies Industry face during its growth?

  • Prohibitive capital investment requirements and ongoing maintenance costs pose significant challenges to industry growth.

  • The widespread scalability of advanced diagnostic capabilities is significantly constrained by the logistical complexities associated with short half life tracer logistics. Maintaining optimal radiotracer injection dosages requires uninterrupted supply chains, which frequently forces institutions to balance the high costs of specialized delivery networks against potential radioactive decay.
  • This operational friction is compounded by the prohibitive capital required to procure premium hybrid imaging systems featuring cadmium zinc telluride semiconductor and silicon photomultiplier detectors. Integrating these advanced platforms with existing anatomical imaging integration software demands extensive technical training and complex dosimetry calculations.
  • Facilities attempting to modernize their departments face up to a 40% increase in initial infrastructure outlays to meet stringent radiation shielding requirements. These structural limitations delay the deployment of sophisticated volumetric parameters analysis tools, forcing many community hospitals to rely on aging legacy equipment while struggling to navigate complex regulatory compliance mandates.

Exclusive Technavio Analysis on Customer Landscape

The molecular imaging (mi) technologies market forecasting report includes the adoption lifecycle of the market, covering from the innovator’s stage to the laggard’s stage. It focuses on adoption rates in different regions based on penetration. Furthermore, the molecular imaging (mi) technologies market report also includes key purchase criteria and drivers of price sensitivity to help companies evaluate and develop their market growth analysis strategies.
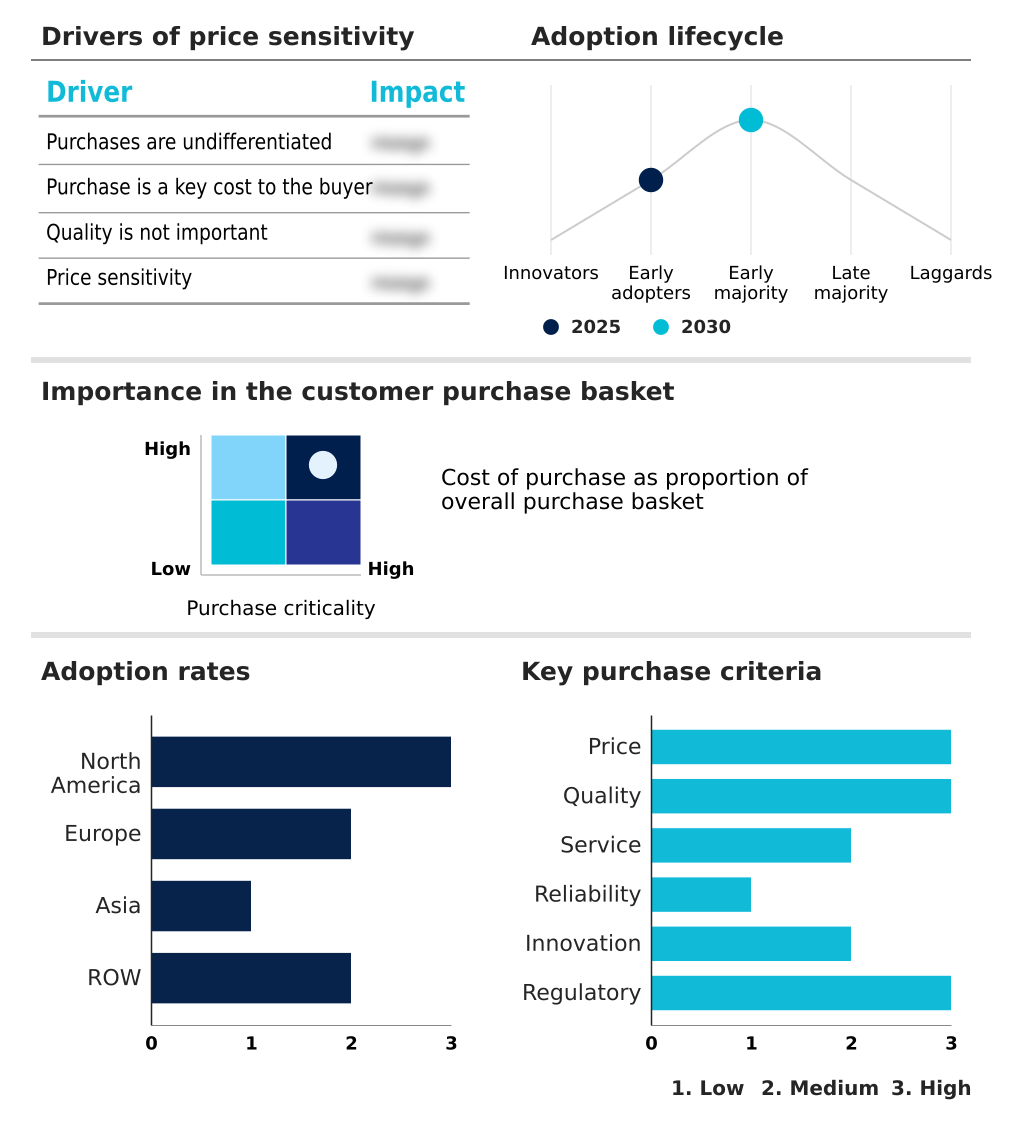
Customer Landscape of Molecular Imaging (Mi) Technologies Industry

Competitive Landscape

Companies are implementing various strategies, such as strategic alliances, molecular imaging (mi) technologies market forecast, partnerships, mergers and acquisitions, geographical expansion, and product/service launches, to enhance their presence in the industry.

Aspect Imaging Ltd. - The organization engineers advanced molecular imaging technologies specializing in compact and preclinical magnetic resonance imaging systems designed for high-resolution diagnostic scanning and confident clinical assessments.

The industry research and growth report includes detailed analyses of the competitive landscape of the market and information about key companies, including:

  • Aspect Imaging Ltd.
  • Bruker Corp.
  • Canon Medical Systems Corp.
  • Cubresa Inc.
  • Curium Pharma
  • FUJIFILM Holdings Corp.
  • GE HealthCare Technologies
  • Koninklijke Philips NV
  • Lantheus
  • LI COR Inc.
  • Lucerno Dynamics Inc.
  • Mediso Ltd.
  • MinFound Medical Systems Co. Ltd.
  • MR Solutions Ltd.
  • Positrigo AG
  • RefleXion Medical Inc.
  • Revvity Inc.
  • Rigaku Corp.
  • Shanghai United Imaging
  • Shimadzu Corp.
  • Siemens Healthineers AG
  • Spectrum Dynamics Medical Inc.

Qualitative and quantitative analysis of companies has been conducted to help clients understand the wider business environment as well as the strengths and weaknesses of key industry players. Data is qualitatively analyzed to categorize companies as pure play, category-focused, industry-focused, and diversified; it is quantitatively analyzed to categorize companies as dominant, leading, strong, tentative, and weak.

Recent Development and News in Molecular imaging (mi) technologies market

  • In the Health Care Equipment industry, the rapid deployment of decentralized medical cyclotron infrastructure has optimized supply chain logistics for short-lived isotopes, directly impacting Molecular Imaging (MI) Technologies demand by expanding regional diagnostic access.
  • Strict environmental and radiation safety standards regarding radioactive waste management have forced healthcare facilities to adopt lower-dose imaging protocols, accelerating the replacement cycle for high-sensitivity digital detector platforms within advanced diagnostic suites.
  • The integration of artificial intelligence into clinical workflow automation software has reduced scan reconstruction times by 30%, pulling demand for next-generation hybrid imaging systems capable of managing higher daily patient throughput.
  • The transition toward value-based care reimbursement models for precision medicine initiatives has mandated the use of quantitative imaging biomarkers in oncology, driving the adoption of sophisticated functional metabolic activity visualization equipment.

Dive into Technavio’s robust research methodology, blending expert interviews, extensive data synthesis, and validated models for unparalleled Molecular Imaging (Mi) Technologies Market insights. See full methodology.

Market Scope
Page number 318
Base year 2025
Historic period 2020-2024
Forecast period 2026-2030
Growth momentum & CAGR Accelerate at a CAGR of 8.8%
Market growth 2026-2030 USD 3945.4 million
Market structure Fragmented
YoY growth 2025-2026(%) 8.1%
Key countries US, Canada, Mexico, Germany, UK, France, Italy, Spain, The Netherlands, China, India, Japan, South Korea, Indonesia, Thailand, Brazil, Saudi Arabia, UAE, Turkey, Argentina, Colombia, South Africa and Israel
Competitive landscape Leading Companies, Market Positioning of Companies, Competitive Strategies, and Industry Risks

Request Free Sample

Research Analyst Overview

  • The continuous advancement within the diagnostic imaging sector fundamentally alters how clinical facilities approach complex pathology identification. Modern instrumentation has transitioned from traditional bismuth germanate scintillators toward ultra-sensitive digital detectors, dramatically enhancing neurochemical process visualization. This technological evolution enables precise amyloid beta plaque detection, a critical factor for facilities aiming to align early diagnostic protocols with emerging neuroprotective treatment strategies.
  • Strategic integration of these systems allows institutions to analyze biodistribution kinetics in real-time, reducing diagnostic ambiguity and expediting boardroom-level decisions regarding capital equipment upgrades. Facilities deploying advanced optical coherence tomography alongside functional imaging modalities have achieved a 30% reduction in secondary exploratory procedures. The precise tracking of cellular receptor binding dynamics supports comprehensive disease monitoring.
  • As hospitals prioritize novel diagnostic tools to optimize patient pathways, the systematic deployment of these high-resolution systems establishes new clinical benchmarks, ensuring robust compliance with precision medicine initiatives while maximizing operational efficiency.

What are the Key Data Covered in this Molecular Imaging (Mi) Technologies Market Research and Growth Report?

  • What is the expected growth of the Molecular Imaging (Mi) Technologies Market between 2026 and 2030?

    • USD 3.95 billion, at a CAGR of 8.8%

  • What segmentation does the market report cover?

    • The report is segmented by End-user (Hospitals and clinics, Research institutes, Pharmaceutical companies, Contract research organizations, and Others), Application (Oncology, Cardiology, Neurology, Infectious diseases, and Others), Modality (PET, SPECT, Hybrid imaging systems, and Others) and Geography (North America, Europe, Asia, Rest of World (ROW))

  • Which regions are analyzed in the report?

    • North America, Europe, Asia and Rest of World (ROW)

  • What are the key growth drivers and market challenges?

    • Rising prevalence of chronic disease, Prohibitive capital investment and maintenance costs

  • Who are the major players in the Molecular Imaging (Mi) Technologies Market?

    • Aspect Imaging Ltd., Bruker Corp., Canon Medical Systems Corp., Cubresa Inc., Curium Pharma, FUJIFILM Holdings Corp., GE HealthCare Technologies, Koninklijke Philips NV, Lantheus, LI COR Inc., Lucerno Dynamics Inc., Mediso Ltd., MinFound Medical Systems Co. Ltd., MR Solutions Ltd., Positrigo AG, RefleXion Medical Inc., Revvity Inc., Rigaku Corp., Shanghai United Imaging, Shimadzu Corp., Siemens Healthineers AG and Spectrum Dynamics Medical Inc.

Market Research Insights

  • The Molecular Imaging (MI) Technologies landscape continues to evolve through rapid advancements in high throughput screening and image reconstruction automation. Healthcare organizations systematically deploy sophisticated diagnostic architectures to refine pharmacodynamic response evaluation protocols and enhance clinical decision-making. Facilities utilizing advanced functional visualization have observed a 22% improvement in early lesion detection accuracy, directly optimizing longitudinal patient management.
  • The strategic integration of localized radiopharmaceutical manufacturing reduces transit-related decay losses by 35%, significantly improving operational cost structures. By leveraging standardized uptake values, clinical researchers ensure greater reproducibility in multi-phase trials, aligning advanced diagnostic workflows with rigorous compliance mandates and precision medicine objectives.

We can help! Our analysts can customize this molecular imaging (mi) technologies market research report to meet your requirements.

Get in touch

1. Executive Summary

1.1 Market overview

Executive Summary - Chart on Market Overview
Executive Summary - Data Table on Market Overview
Executive Summary - Chart on Global Market Characteristics
Executive Summary - Chart on Market by Geography
Executive Summary - Chart on Market Segmentation by End-user
Executive Summary - Chart on Market Segmentation by Application
Executive Summary - Chart on Market Segmentation by Modality
Executive Summary - Chart on Incremental Growth
Executive Summary - Data Table on Incremental Growth
Executive Summary - Chart on Company Market Positioning

2. Technavio Analysis

2.1 Analysis of price sensitivity, lifecycle, customer purchase basket, adoption rates, and purchase criteria

2.2 Criticality of inputs and Factors of differentiation

Chart on Overview on criticality of inputs and factors of differentiation

2.3 Factors of disruption

Chart on Overview on factors of disruption

2.4 Impact of drivers and challenges

Chart on Impact of drivers and challenges in 2025 and 2030

3. Market Landscape

3.1 Market ecosystem

Chart on Parent Market
Data Table on - Parent Market

3.2 Market characteristics

Chart on Market characteristics analysis

3.3 Value chain analysis

Chart on Value chain analysis

4. Market Sizing

4.1 Market definition

Data Table on Offerings of companies included in the market definition

4.2 Market segment analysis

Market segments

4.3 Market size 2025

4.4 Market outlook: Forecast for 2025-2030

Chart on Global - Market size and forecast 2025-2030 ($ million)
Data Table on Global - Market size and forecast 2025-2030 ($ million)
Chart on Global Market: Year-over-year growth 2025-2030 (%)
Data Table on Global Market: Year-over-year growth 2025-2030 (%)

5. Historic Market Size

5.1 Global Molecular Imaging (MI) Technologies Market 2020 - 2024

Historic Market Size - Data Table on Global Molecular Imaging (MI) Technologies Market 2020 - 2024 ($ million)

5.2 End-user segment analysis 2020 - 2024

Historic Market Size - End-user Segment 2020 - 2024 ($ million)

5.3 Application segment analysis 2020 - 2024

Historic Market Size - Application Segment 2020 - 2024 ($ million)

5.4 Modality segment analysis 2020 - 2024

Historic Market Size - Modality Segment 2020 - 2024 ($ million)

5.5 Geography segment analysis 2020 - 2024

Historic Market Size - Geography Segment 2020 - 2024 ($ million)

5.6 Country segment analysis 2020 - 2024

Historic Market Size - Country Segment 2020 - 2024 ($ million)

6. Qualitative Analysis

6.1 Impact of AI on Global Molecular Imaging (MI) Technologies Market

6.2 Impact of geopolitical conflicts on Global Molecular Imaging (MI) Technologies Market

7. Five Forces Analysis

7.1 Five forces summary

Five forces analysis - Comparison between 2025 and 2030

7.2 Bargaining power of buyers

Bargaining power of buyers - Impact of key factors 2025 and 2030

7.3 Bargaining power of suppliers

Bargaining power of suppliers - Impact of key factors in 2025 and 2030

7.4 Threat of new entrants

Threat of new entrants - Impact of key factors in 2025 and 2030

7.5 Threat of substitutes

Threat of substitutes - Impact of key factors in 2025 and 2030

7.6 Threat of rivalry

Threat of rivalry - Impact of key factors in 2025 and 2030

7.7 Market condition

Chart on Market condition - Five forces 2025 and 2030

8. Market Segmentation by End-user

8.1 Market segments

Chart on End-user - Market share 2025-2030 (%)
Data Table on End-user - Market share 2025-2030 (%)

8.2 Comparison by End-user

Chart on Comparison by End-user
Data Table on Comparison by End-user

8.3 Hospitals and clinics - Market size and forecast 2025-2030

Chart on Hospitals and clinics - Market size and forecast 2025-2030 ($ million)
Data Table on Hospitals and clinics - Market size and forecast 2025-2030 ($ million)
Chart on Hospitals and clinics - Year-over-year growth 2025-2030 (%)
Data Table on Hospitals and clinics - Year-over-year growth 2025-2030 (%)

8.4 Research institutes - Market size and forecast 2025-2030

Chart on Research institutes - Market size and forecast 2025-2030 ($ million)
Data Table on Research institutes - Market size and forecast 2025-2030 ($ million)
Chart on Research institutes - Year-over-year growth 2025-2030 (%)
Data Table on Research institutes - Year-over-year growth 2025-2030 (%)

8.5 Pharmaceutical companies - Market size and forecast 2025-2030

Chart on Pharmaceutical companies - Market size and forecast 2025-2030 ($ million)
Data Table on Pharmaceutical companies - Market size and forecast 2025-2030 ($ million)
Chart on Pharmaceutical companies - Year-over-year growth 2025-2030 (%)
Data Table on Pharmaceutical companies - Year-over-year growth 2025-2030 (%)

8.6 Contract research organizations - Market size and forecast 2025-2030

Chart on Contract research organizations - Market size and forecast 2025-2030 ($ million)
Data Table on Contract research organizations - Market size and forecast 2025-2030 ($ million)
Chart on Contract research organizations - Year-over-year growth 2025-2030 (%)
Data Table on Contract research organizations - Year-over-year growth 2025-2030 (%)

8.7 Others - Market size and forecast 2025-2030

Chart on Others - Market size and forecast 2025-2030 ($ million)
Data Table on Others - Market size and forecast 2025-2030 ($ million)
Chart on Others - Year-over-year growth 2025-2030 (%)
Data Table on Others - Year-over-year growth 2025-2030 (%)

8.8 Market opportunity by End-user

Market opportunity by End-user ($ million)
Data Table on Market opportunity by End-user ($ million)

9. Market Segmentation by Application

9.1 Market segments

Chart on Application - Market share 2025-2030 (%)
Data Table on Application - Market share 2025-2030 (%)

9.2 Comparison by Application

Chart on Comparison by Application
Data Table on Comparison by Application

9.3 Oncology - Market size and forecast 2025-2030

Chart on Oncology - Market size and forecast 2025-2030 ($ million)
Data Table on Oncology - Market size and forecast 2025-2030 ($ million)
Chart on Oncology - Year-over-year growth 2025-2030 (%)
Data Table on Oncology - Year-over-year growth 2025-2030 (%)

9.4 Cardiology - Market size and forecast 2025-2030

Chart on Cardiology - Market size and forecast 2025-2030 ($ million)
Data Table on Cardiology - Market size and forecast 2025-2030 ($ million)
Chart on Cardiology - Year-over-year growth 2025-2030 (%)
Data Table on Cardiology - Year-over-year growth 2025-2030 (%)

9.5 Neurology - Market size and forecast 2025-2030

Chart on Neurology - Market size and forecast 2025-2030 ($ million)
Data Table on Neurology - Market size and forecast 2025-2030 ($ million)
Chart on Neurology - Year-over-year growth 2025-2030 (%)
Data Table on Neurology - Year-over-year growth 2025-2030 (%)

9.6 Infectious diseases - Market size and forecast 2025-2030

Chart on Infectious diseases - Market size and forecast 2025-2030 ($ million)
Data Table on Infectious diseases - Market size and forecast 2025-2030 ($ million)
Chart on Infectious diseases - Year-over-year growth 2025-2030 (%)
Data Table on Infectious diseases - Year-over-year growth 2025-2030 (%)

9.7 Others - Market size and forecast 2025-2030

Chart on Others - Market size and forecast 2025-2030 ($ million)
Data Table on Others - Market size and forecast 2025-2030 ($ million)
Chart on Others - Year-over-year growth 2025-2030 (%)
Data Table on Others - Year-over-year growth 2025-2030 (%)

9.8 Market opportunity by Application

Market opportunity by Application ($ million)
Data Table on Market opportunity by Application ($ million)

10. Market Segmentation by Modality

10.1 Market segments

Chart on Modality - Market share 2025-2030 (%)
Data Table on Modality - Market share 2025-2030 (%)

10.2 Comparison by Modality

Chart on Comparison by Modality
Data Table on Comparison by Modality

10.3 PET - Market size and forecast 2025-2030

Chart on PET - Market size and forecast 2025-2030 ($ million)
Data Table on PET - Market size and forecast 2025-2030 ($ million)
Chart on PET - Year-over-year growth 2025-2030 (%)
Data Table on PET - Year-over-year growth 2025-2030 (%)

10.4 SPECT - Market size and forecast 2025-2030

Chart on SPECT - Market size and forecast 2025-2030 ($ million)
Data Table on SPECT - Market size and forecast 2025-2030 ($ million)
Chart on SPECT - Year-over-year growth 2025-2030 (%)
Data Table on SPECT - Year-over-year growth 2025-2030 (%)

10.5 Hybrid imaging systems - Market size and forecast 2025-2030

Chart on Hybrid imaging systems - Market size and forecast 2025-2030 ($ million)
Data Table on Hybrid imaging systems - Market size and forecast 2025-2030 ($ million)
Chart on Hybrid imaging systems - Year-over-year growth 2025-2030 (%)
Data Table on Hybrid imaging systems - Year-over-year growth 2025-2030 (%)

10.6 Others - Market size and forecast 2025-2030

Chart on Others - Market size and forecast 2025-2030 ($ million)
Data Table on Others - Market size and forecast 2025-2030 ($ million)
Chart on Others - Year-over-year growth 2025-2030 (%)
Data Table on Others - Year-over-year growth 2025-2030 (%)

10.7 Market opportunity by Modality

Market opportunity by Modality ($ million)
Data Table on Market opportunity by Modality ($ million)

11. Customer Landscape

11.1 Customer landscape overview

Analysis of price sensitivity, lifecycle, customer purchase basket, adoption rates, and purchase criteria

12. Geographic Landscape

12.1 Geographic segmentation

Chart on Market share by geography 2025-2030 (%)
Data Table on Market share by geography 2025-2030 (%)

12.2 Geographic comparison

Chart on Geographic comparison
Data Table on Geographic comparison

12.3 North America - Market size and forecast 2025-2030

Chart on North America - Market size and forecast 2025-2030 ($ million)
Data Table on North America - Market size and forecast 2025-2030 ($ million)
Chart on North America - Year-over-year growth 2025-2030 (%)
Data Table on North America - Year-over-year growth 2025-2030 (%)
Chart on Regional Comparison - North America
Data Table on Regional Comparison - North America

12.3.1 US - Market size and forecast 2025-2030

Chart on US - Market size and forecast 2025-2030 ($ million)
Data Table on US - Market size and forecast 2025-2030 ($ million)
Chart on US - Year-over-year growth 2025-2030 (%)
Data Table on US - Year-over-year growth 2025-2030 (%)

12.3.2 Canada - Market size and forecast 2025-2030

Chart on Canada - Market size and forecast 2025-2030 ($ million)
Data Table on Canada - Market size and forecast 2025-2030 ($ million)
Chart on Canada - Year-over-year growth 2025-2030 (%)
Data Table on Canada - Year-over-year growth 2025-2030 (%)

12.3.3 Mexico - Market size and forecast 2025-2030

Chart on Mexico - Market size and forecast 2025-2030 ($ million)
Data Table on Mexico - Market size and forecast 2025-2030 ($ million)
Chart on Mexico - Year-over-year growth 2025-2030 (%)
Data Table on Mexico - Year-over-year growth 2025-2030 (%)

12.4 Europe - Market size and forecast 2025-2030

Chart on Europe - Market size and forecast 2025-2030 ($ million)
Data Table on Europe - Market size and forecast 2025-2030 ($ million)
Chart on Europe - Year-over-year growth 2025-2030 (%)
Data Table on Europe - Year-over-year growth 2025-2030 (%)
Chart on Regional Comparison - Europe
Data Table on Regional Comparison - Europe

12.4.1 Germany - Market size and forecast 2025-2030

Chart on Germany - Market size and forecast 2025-2030 ($ million)
Data Table on Germany - Market size and forecast 2025-2030 ($ million)
Chart on Germany - Year-over-year growth 2025-2030 (%)
Data Table on Germany - Year-over-year growth 2025-2030 (%)

12.4.2 UK - Market size and forecast 2025-2030

Chart on UK - Market size and forecast 2025-2030 ($ million)
Data Table on UK - Market size and forecast 2025-2030 ($ million)
Chart on UK - Year-over-year growth 2025-2030 (%)
Data Table on UK - Year-over-year growth 2025-2030 (%)

12.4.3 France - Market size and forecast 2025-2030

Chart on France - Market size and forecast 2025-2030 ($ million)
Data Table on France - Market size and forecast 2025-2030 ($ million)
Chart on France - Year-over-year growth 2025-2030 (%)
Data Table on France - Year-over-year growth 2025-2030 (%)

12.4.4 Italy - Market size and forecast 2025-2030

Chart on Italy - Market size and forecast 2025-2030 ($ million)
Data Table on Italy - Market size and forecast 2025-2030 ($ million)
Chart on Italy - Year-over-year growth 2025-2030 (%)
Data Table on Italy - Year-over-year growth 2025-2030 (%)

12.4.5 Spain - Market size and forecast 2025-2030

Chart on Spain - Market size and forecast 2025-2030 ($ million)
Data Table on Spain - Market size and forecast 2025-2030 ($ million)
Chart on Spain - Year-over-year growth 2025-2030 (%)
Data Table on Spain - Year-over-year growth 2025-2030 (%)

12.4.6 The Netherlands - Market size and forecast 2025-2030

Chart on The Netherlands - Market size and forecast 2025-2030 ($ million)
Data Table on The Netherlands - Market size and forecast 2025-2030 ($ million)
Chart on The Netherlands - Year-over-year growth 2025-2030 (%)
Data Table on The Netherlands - Year-over-year growth 2025-2030 (%)

12.5 Asia - Market size and forecast 2025-2030

Chart on Asia - Market size and forecast 2025-2030 ($ million)
Data Table on Asia - Market size and forecast 2025-2030 ($ million)
Chart on Asia - Year-over-year growth 2025-2030 (%)
Data Table on Asia - Year-over-year growth 2025-2030 (%)
Chart on Regional Comparison - Asia
Data Table on Regional Comparison - Asia

12.5.1 China - Market size and forecast 2025-2030

Chart on China - Market size and forecast 2025-2030 ($ million)
Data Table on China - Market size and forecast 2025-2030 ($ million)
Chart on China - Year-over-year growth 2025-2030 (%)
Data Table on China - Year-over-year growth 2025-2030 (%)

12.5.2 India - Market size and forecast 2025-2030

Chart on India - Market size and forecast 2025-2030 ($ million)
Data Table on India - Market size and forecast 2025-2030 ($ million)
Chart on India - Year-over-year growth 2025-2030 (%)
Data Table on India - Year-over-year growth 2025-2030 (%)

12.5.3 Japan - Market size and forecast 2025-2030

Chart on Japan - Market size and forecast 2025-2030 ($ million)
Data Table on Japan - Market size and forecast 2025-2030 ($ million)
Chart on Japan - Year-over-year growth 2025-2030 (%)
Data Table on Japan - Year-over-year growth 2025-2030 (%)

12.5.4 South Korea - Market size and forecast 2025-2030

Chart on South Korea - Market size and forecast 2025-2030 ($ million)
Data Table on South Korea - Market size and forecast 2025-2030 ($ million)
Chart on South Korea - Year-over-year growth 2025-2030 (%)
Data Table on South Korea - Year-over-year growth 2025-2030 (%)

12.5.5 Indonesia - Market size and forecast 2025-2030

Chart on Indonesia - Market size and forecast 2025-2030 ($ million)
Data Table on Indonesia - Market size and forecast 2025-2030 ($ million)
Chart on Indonesia - Year-over-year growth 2025-2030 (%)
Data Table on Indonesia - Year-over-year growth 2025-2030 (%)

12.5.6 Thailand - Market size and forecast 2025-2030

Chart on Thailand - Market size and forecast 2025-2030 ($ million)
Data Table on Thailand - Market size and forecast 2025-2030 ($ million)
Chart on Thailand - Year-over-year growth 2025-2030 (%)
Data Table on Thailand - Year-over-year growth 2025-2030 (%)

12.6 Rest of World (ROW) - Market size and forecast 2025-2030

Chart on Rest of World (ROW) - Market size and forecast 2025-2030 ($ million)
Data Table on Rest of World (ROW) - Market size and forecast 2025-2030 ($ million)
Chart on Rest of World (ROW) - Year-over-year growth 2025-2030 (%)
Data Table on Rest of World (ROW) - Year-over-year growth 2025-2030 (%)
Chart on Regional Comparison - Rest of World (ROW)
Data Table on Regional Comparison - Rest of World (ROW)

12.6.1 Brazil - Market size and forecast 2025-2030

Chart on Brazil - Market size and forecast 2025-2030 ($ million)
Data Table on Brazil - Market size and forecast 2025-2030 ($ million)
Chart on Brazil - Year-over-year growth 2025-2030 (%)
Data Table on Brazil - Year-over-year growth 2025-2030 (%)

12.6.2 Saudi Arabia - Market size and forecast 2025-2030

Chart on Saudi Arabia - Market size and forecast 2025-2030 ($ million)
Data Table on Saudi Arabia - Market size and forecast 2025-2030 ($ million)
Chart on Saudi Arabia - Year-over-year growth 2025-2030 (%)
Data Table on Saudi Arabia - Year-over-year growth 2025-2030 (%)

12.6.3 UAE - Market size and forecast 2025-2030

Chart on UAE - Market size and forecast 2025-2030 ($ million)
Data Table on UAE - Market size and forecast 2025-2030 ($ million)
Chart on UAE - Year-over-year growth 2025-2030 (%)
Data Table on UAE - Year-over-year growth 2025-2030 (%)

12.6.4 Turkey - Market size and forecast 2025-2030

Chart on Turkey - Market size and forecast 2025-2030 ($ million)
Data Table on Turkey - Market size and forecast 2025-2030 ($ million)
Chart on Turkey - Year-over-year growth 2025-2030 (%)
Data Table on Turkey - Year-over-year growth 2025-2030 (%)

12.6.5 Argentina - Market size and forecast 2025-2030

Chart on Argentina - Market size and forecast 2025-2030 ($ million)
Data Table on Argentina - Market size and forecast 2025-2030 ($ million)
Chart on Argentina - Year-over-year growth 2025-2030 (%)
Data Table on Argentina - Year-over-year growth 2025-2030 (%)

12.6.6 Colombia - Market size and forecast 2025-2030

Chart on Colombia - Market size and forecast 2025-2030 ($ million)
Data Table on Colombia - Market size and forecast 2025-2030 ($ million)
Chart on Colombia - Year-over-year growth 2025-2030 (%)
Data Table on Colombia - Year-over-year growth 2025-2030 (%)

12.6.7 South Africa - Market size and forecast 2025-2030

Chart on South Africa - Market size and forecast 2025-2030 ($ million)
Data Table on South Africa - Market size and forecast 2025-2030 ($ million)
Chart on South Africa - Year-over-year growth 2025-2030 (%)
Data Table on South Africa - Year-over-year growth 2025-2030 (%)

12.6.8 Israel - Market size and forecast 2025-2030

Chart on Israel - Market size and forecast 2025-2030 ($ million)
Data Table on Israel - Market size and forecast 2025-2030 ($ million)
Chart on Israel - Year-over-year growth 2025-2030 (%)
Data Table on Israel - Year-over-year growth 2025-2030 (%)

12.7 Market opportunity by geography

Market opportunity by geography ($ million)
Data Tables on Market opportunity by geography ($ million)

13. Drivers, Challenges, and Opportunity

13.1 Market drivers

Rising prevalence of chronic disease
Technological advancements in hybrid equipment
Expansion of precision medicine initiatives

13.2 Market challenges

Prohibitive capital investment and maintenance costs
Complex regulatory approvals and compliance
Short half-life and supply logistical bottlenecks

13.3 Impact of drivers and challenges

Impact of drivers and challenges in 2025 and 2030

13.4 Market opportunities

Expansion of theranostic agent applications
Growth of digital cyclotron infrastructure
Rise of quantitative imaging biomarkers

14. Competitive Landscape

14.1 Overview

14.2

Overview on criticality of inputs and factors of differentiation

14.3 Landscape disruption

Overview on factors of disruption

14.4 Industry risks

Impact of key risks on business

15. Competitive Analysis

15.1 Companies profiled

Companies covered

15.2 Company ranking index

15.3 Market positioning of companies

Matrix on companies position and classification

15.4 Aspect Imaging Ltd.

Aspect Imaging Ltd. - Overview
Aspect Imaging Ltd. - Product / Service
Aspect Imaging Ltd. - Key offerings
SWOT

15.5 Bruker Corp.

Bruker Corp. - Overview
Bruker Corp. - Business segments
Bruker Corp. - Key offerings
Bruker Corp. - Segment focus
SWOT

15.6 Canon Medical Systems Corp.

Canon Medical Systems Corp. - Overview
Canon Medical Systems Corp. - Product / Service
Canon Medical Systems Corp. - Key offerings
SWOT

15.7 FUJIFILM Holdings Corp.

FUJIFILM Holdings Corp. - Overview
FUJIFILM Holdings Corp. - Business segments
FUJIFILM Holdings Corp. - Key news
FUJIFILM Holdings Corp. - Key offerings
FUJIFILM Holdings Corp. - Segment focus
SWOT

15.8 GE HealthCare Technologies

GE HealthCare Technologies - Overview
GE HealthCare Technologies - Business segments
GE HealthCare Technologies - Key news
GE HealthCare Technologies - Key offerings
GE HealthCare Technologies - Segment focus
SWOT

15.9 Koninklijke Philips NV

Koninklijke Philips NV - Overview
Koninklijke Philips NV - Business segments
Koninklijke Philips NV - Key news
Koninklijke Philips NV - Key offerings
Koninklijke Philips NV - Segment focus
SWOT

15.10 Lantheus

Lantheus - Overview
Lantheus - Business segments
Lantheus - Key offerings
Lantheus - Segment focus
SWOT

15.11 LI COR Inc.

LI COR Inc. - Overview
LI COR Inc. - Product / Service
LI COR Inc. - Key offerings
SWOT

15.12 MR Solutions Ltd.

MR Solutions Ltd. - Overview
MR Solutions Ltd. - Product / Service
MR Solutions Ltd. - Key offerings
SWOT

15.13 Revvity Inc.

Revvity Inc. - Overview
Revvity Inc. - Business segments
Revvity Inc. - Key offerings
Revvity Inc. - Segment focus
SWOT

15.14 Rigaku Corp.

Rigaku Corp. - Overview
Rigaku Corp. - Product / Service
Rigaku Corp. - Key offerings
SWOT

15.15 Shanghai United Imaging

Shanghai United Imaging - Overview
Shanghai United Imaging - Product / Service
Shanghai United Imaging - Key offerings
SWOT

15.16 Shimadzu Corp.

Shimadzu Corp. - Overview
Shimadzu Corp. - Business segments
Shimadzu Corp. - Key offerings
Shimadzu Corp. - Segment focus
SWOT

15.17 Siemens Healthineers AG

Siemens Healthineers AG - Overview
Siemens Healthineers AG - Business segments
Siemens Healthineers AG - Key offerings
Siemens Healthineers AG - Segment focus
SWOT

15.18 Spectrum Dynamics Medical Inc.

Spectrum Dynamics Medical Inc. - Overview
Spectrum Dynamics Medical Inc. - Product / Service
Spectrum Dynamics Medical Inc. - Key offerings
SWOT

16. Appendix

16.1 Scope of the report

Market definition
Objectives
Notes and caveats

16.2 Inclusions and exclusions checklist

Inclusions checklist
Exclusions checklist

16.3 Currency conversion rates for US$

16.4 Research methodology

16.5 Data procurement

Information sources

16.6 Data validation

16.7 Validation techniques employed for market sizing

16.8 Data synthesis

16.9 360 degree market analysis

16.10 List of abbreviations

Research Methodology

Technavio presents a detailed picture of the market by way of study, synthesis, and summation of data from multiple sources. The analysts have presented the various facets of the market with a particular focus on identifying the key industry influencers. The data thus presented is comprehensive, reliable, and the result of extensive research, both primary and secondary.

INFORMATION SOURCES

Primary sources

  • Manufacturers and suppliers
  • Channel partners
  • Industry experts
  • Strategic decision makers

Secondary sources

  • Industry journals and periodicals
  • Government data
  • Financial reports of key industry players
  • Historical data
  • Press releases

DATA ANALYSIS

Data Synthesis

  • Collation of data
  • Estimation of key figures
  • Analysis of derived insights

Data Validation

  • Triangulation with data models
  • Reference against proprietary databases
  • Corroboration with industry experts

REPORT WRITING

Qualitative

  • Market drivers
  • Market challenges
  • Market trends
  • Five forces analysis

Quantitative

  • Market size and forecast
  • Market segmentation
  • Geographical insights
  • Competitive landscape

Interested in this report?

Get your sample now to see our research methodology and insights!

Download Now

Frequently Asked Questions

Molecular Imaging (Mi) Technologies market growth will increase by USD 3945.4 million during 2026-2030.

The Molecular Imaging (Mi) Technologies market is expected to grow at a CAGR of 8.8% during 2026-2030.

Molecular Imaging (Mi) Technologies market is segmented by End-user (Hospitals and clinics, Research institutes, Pharmaceutical companies, Contract research organizations, Others) Application (Oncology, Cardiology, Neurology, Infectious diseases, Others) Modality (PET, SPECT, Hybrid imaging systems, Others)

Aspect Imaging Ltd., Bruker Corp., Canon Medical Systems Corp., Cubresa Inc., Curium Pharma, FUJIFILM Holdings Corp., GE HealthCare Technologies, Koninklijke Philips NV, Lantheus, LI COR Inc., Lucerno Dynamics Inc., Mediso Ltd., MinFound Medical Systems Co. Ltd., MR Solutions Ltd., Positrigo AG, RefleXion Medical Inc., Revvity Inc., Rigaku Corp., Shanghai United Imaging, Shimadzu Corp., Siemens Healthineers AG, Spectrum Dynamics Medical Inc. are a few of the key vendors in the Molecular Imaging (Mi) Technologies market.

North America will register the highest growth rate of 52.1% among the other regions. Therefore, the Molecular Imaging (Mi) Technologies market in North America is expected to garner significant business opportunities for the vendors during the forecast period.

US, Canada, Mexico, Germany, UK, France, Italy, Spain, The Netherlands, China, India, Japan, South Korea, Indonesia, Thailand, Brazil, Saudi Arabia, UAE, Turkey, Argentina, Colombia, South Africa, Israel

  • Rising prevalence of chronic disease is the driving factor this market.

The Molecular Imaging (Mi) Technologies market vendors should focus on grabbing business opportunities from the End-user segment as it accounted for the largest market share in the base year.
RIA - Research AI Assistant
Ask RIA
