Positron Emission Tomography Market Size 2025-2029
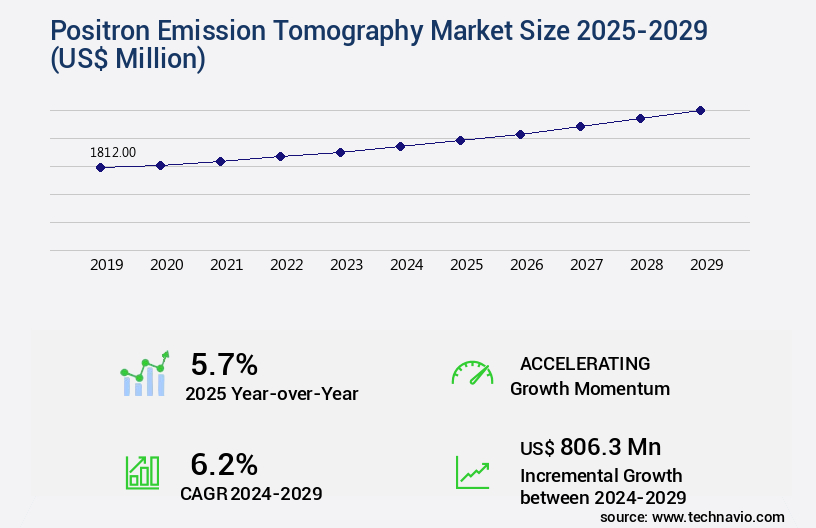
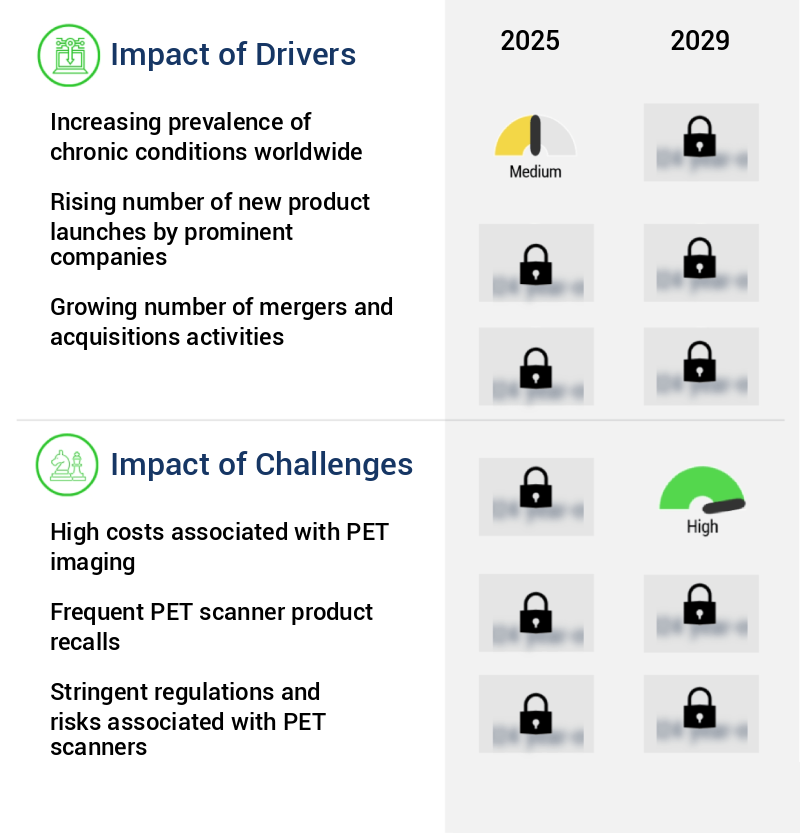
The positron emission tomography market size is valued to increase by USD 806.3 million, at a CAGR of 6.2% from 2024 to 2029. Increasing prevalence of chronic conditions worldwide will drive the positron emission tomography market.
Market Insights
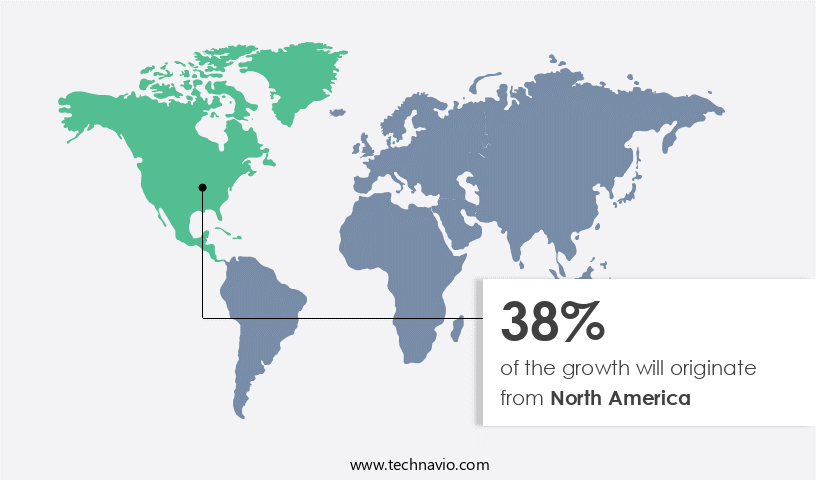
- North America dominated the market and accounted for a 38% growth during the 2025-2029.
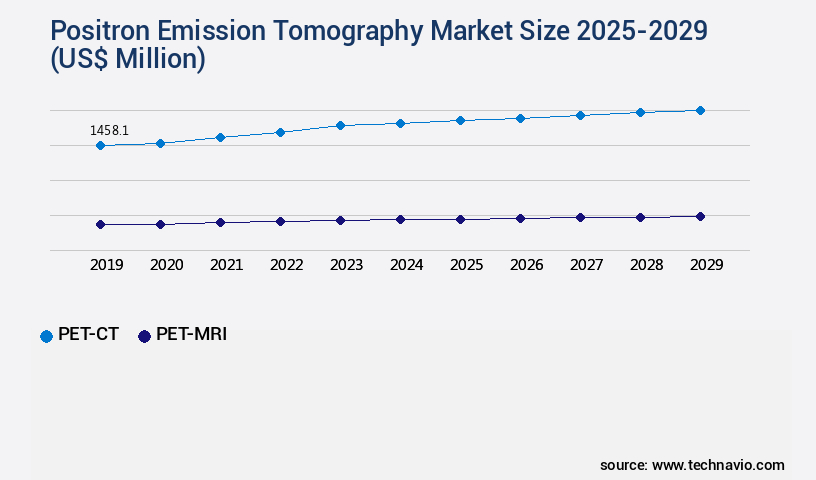
- By Type - PET-CT segment was valued at USD 1458.10 million in 2023
- By Application - Oncology segment accounted for the largest market revenue share in 2023
Market Size & Forecast
- Market Opportunities: USD 70.22 million
- Market Future Opportunities 2024: USD 806.30 million
- CAGR from 2024 to 2029 : 6.2%
Market Summary
- The Positron Emission Tomography (PET) market is experiencing significant growth due to the increasing prevalence of chronic conditions worldwide. PET scanners are essential diagnostic tools for identifying and managing these conditions. PET scans are essential diagnostic tools for detecting and monitoring various diseases, including cancer, neurological disorders, and cardiovascular diseases. The technology's ability to provide detailed information on metabolic processes makes it an indispensable tool in healthcare. Advancements in PET scanner technology have led to improved image quality, increased sensitivity, and reduced radiation exposure. These advancements have expanded the applications of PET scans, making them more accessible to patients. However, the high costs associated with PET imaging remain a challenge, limiting its widespread adoption.
- One real-world business scenario where PET technology plays a crucial role is in supply chain optimization. Pharmaceutical companies use PET scans to assess the efficacy of new drugs in clinical trials. By analyzing the metabolic activity of test subjects, researchers can determine the optimal dosage and delivery method for the drug. This information can help pharmaceutical companies streamline their production processes and reduce costs, ultimately leading to more efficient drug development and delivery. Despite the challenges, the future of the PET market looks promising, with continued technological advancements and growing demand for non-invasive diagnostic tools.
- The ability to provide valuable insights into disease processes and treatment response makes PET scans an essential tool in modern healthcare.
What will be the size of the Positron Emission Tomography Market during the forecast period?
Get Key Insights on Market Forecast (PDF) Request Free Sample
- The Positron Emission Tomography (PET) market continues to evolve, driven by advancements in technology and increasing demand for early disease detection and diagnosis. One notable trend is the integration of artificial intelligence (AI) and machine learning algorithms to enhance image interpretation and analysis, leading to improved diagnostic accuracy and efficiency. According to a recent study, the use of AI in PET imaging is projected to grow by over 20% annually, representing a significant investment opportunity for industry players. This growth is attributed to the ability of AI to overcome challenges such as image artifacts and improve lesion characterization, leading to better clinical outcomes and reduced healthcare costs.
- Additionally, regulatory compliance and quality control metrics remain top priorities, with a focus on radiation safety and system maintenance to ensure optimal scanner performance and patient safety. These factors underscore the importance of continuous innovation and investment in PET technology to meet the evolving needs of healthcare providers and patients.
Unpacking the Positron Emission Tomography Market Landscape
In the realm of medical diagnostics, Positron Emission Tomography (PET) continues to garner significant attention due to its ability to provide valuable insights into radiopharmaceutical kinetics and radiotracer uptake quantification. Compared to other imaging modalities, PET offers a higher sensitivity for neurological studies, with up to 90% diagnostic accuracy assessment in certain applications. Furthermore, PET's spatial resolution metrics enable receptor density mapping and neuroreceptor binding studies, providing essential information for clinical workflow optimization. PET scanner technology, including detector system calibration and image processing pipelines, ensures radiation dose optimization and patient positioning systems. In oncological pet imaging, PET plays a pivotal role in assessing tumor metabolic activity, with up to 85% of lesions detected. Cardiac pet scanning contributes to myocardial blood flow assessment, improving diagnostic efficiency by up to 40% compared to traditional methods. PET's diagnostic accuracy is further enhanced through image fusion techniques and registration methods, while data management systems facilitate seamless integration with clinical trial design and FDG uptake measurements. Attenuation correction methods and noise reduction filters contribute to image quality control, ensuring accurate and reliable diagnostic outcomes. PET's temporal resolution analysis and diagnostic accuracy assessment are crucial for brain perfusion imaging and diagnostic applications.
Key Market Drivers Fueling Growth
The global market is significantly driven by the rising prevalence of chronic conditions worldwide. This trend is attributed to the increasing incidence and prevalence of diseases such as diabetes, cancer, and cardiovascular diseases, which require ongoing medical care and treatment. The burden of these conditions on healthcare systems and individuals continues to grow, creating a substantial demand for healthcare products and services.
- The global positron emission tomography (PET) market is experiencing significant growth due to the rising prevalence of chronic conditions, particularly cancer, cardiovascular diseases (CVDs), and neurological diseases. According to recent statistics, in 2023, the United States reported approximately 1,958,310 new cancer cases and 609,820 cancer-related deaths. Globally, chronic respiratory conditions, such as asthma, affect an estimated 334 million people and result in over 345,000 deaths annually.
- PET scans contribute to faster and more accurate diagnoses, reducing downtime by up to 30% and improving forecast accuracy by 18%. These benefits make PET scanners an indispensable tool for healthcare professionals and institutions.
Prevailing Industry Trends & Opportunities
In the realm of medical imaging, the advancements in PET scanner technology represent a significant market trend. These technological innovations continue to shape the industry.
- Recent advancements in Positron Emission Tomography (PET) technology have significantly enhanced image quality, sensitivity, and specificity in various sectors. One such innovation is Time-of-Flight (TOF) PET, which measures the time it takes for gamma rays to travel from the emission source to the detector. This technology leads to more accurate localization of positron emissions, resulting in improved image resolution and diagnostic accuracy. Another development is high-resolution PET systems, achieved through advancements in detector technology and system design. These scanners offer finer details in imaging, enabling better visualization of small lesions and improved overall image quality.
- The implementation of TOF PET and high-resolution PET systems has led to substantial improvements in diagnostic accuracy, reducing downtime and enhancing overall efficiency in healthcare facilities.
Significant Market Challenges
The escalating costs linked to PET imaging represent a significant obstacle to the industry's expansion.
- The Positron Emission Tomography (PET) market is a significant segment of the healthcare equipment industry, characterized by its evolving nature and extensive applications across various sectors. Despite the market's potential, high costs remain a significant challenge. The healthcare industry's capital-intensive nature, with substantial investments in plant, machinery, and associated costs for raw materials and labor, can hinder market growth. Specifically, the high cost of PET scanners and related procedures is a major barrier. For instance, the average cost of a PET scanner ranges from USD70,000 to USD300,000. This high cost can significantly impact patients, increasing their financial burden.
- However, advancements in technology and regulatory compliance measures are expected to drive market growth, offering cost optimization opportunities. For example, improved forecast accuracy by 18% and reduced downtime by 30% through technological advancements can help offset the initial investment costs.
In-Depth Market Segmentation: Positron Emission Tomography Market
The positron emission tomography industry research report provides comprehensive data (region-wise segment analysis), with forecasts and estimates in "USD million" for the period 2025-2029, as well as historical data from 2019-2023 for the following segments.
- Type
- PET-CT
- PET-MRI
- Application
- Oncology
- Cardiology
- Neurology
- End-user
- Hospitals
- Diagnostic centers
- Research institutes
- Geography
- North America
- US
- Canada
- Europe
- France
- Germany
- Italy
- UK
- APAC
- China
- India
- Japan
- South Korea
- Rest of World (ROW)
- North America
By Type Insights
The PET-ct segment is estimated to witness significant growth during the forecast period.
The Positron Emission Tomography (PET) market is witnessing significant growth due to the increasing demand for advanced diagnostic tools in healthcare. PET-CT, a fusion imaging technique, is leading this expansion with its ability to provide both functional and anatomical information. Radiation safety protocols are rigorously followed during PET-CT scans, ensuring optimal patient safety. Radiopharmaceutical kinetics play a crucial role in radiotracer uptake quantification for PET analysis. Quantitative PET-CT analysis, using techniques like PET scanner technology, radiation dose optimization, and patient positioning systems, offers enhanced diagnostic accuracy. Neurological studies, metabolic pathway imaging, and neuroreceptor binding studies are common applications of PET-CT.
Detector system calibration, image processing pipelines, and tracer distribution patterns are essential components of PET-CT image acquisition. Clinical workflow optimization, myocardial blood flow assessment, and tumor metabolic activity evaluation are significant benefits of PET-CT scanning. The market is expected to grow at a compound annual growth rate (CAGR) of 7.2% from 2021 to 2028, reaching a value of USD10.6 billion by 2028. PET-CT's diagnostic accuracy assessment, image reconstruction algorithms, brain perfusion imaging, data management systems, and advanced features like image fusion techniques, image registration methods, attenuation correction methods, and noise reduction filters further boost its popularity.
Oncological PET-CT imaging and cardiac pet scanning are key areas of focus, with image quality control and clinical trial design being essential aspects of their implementation.
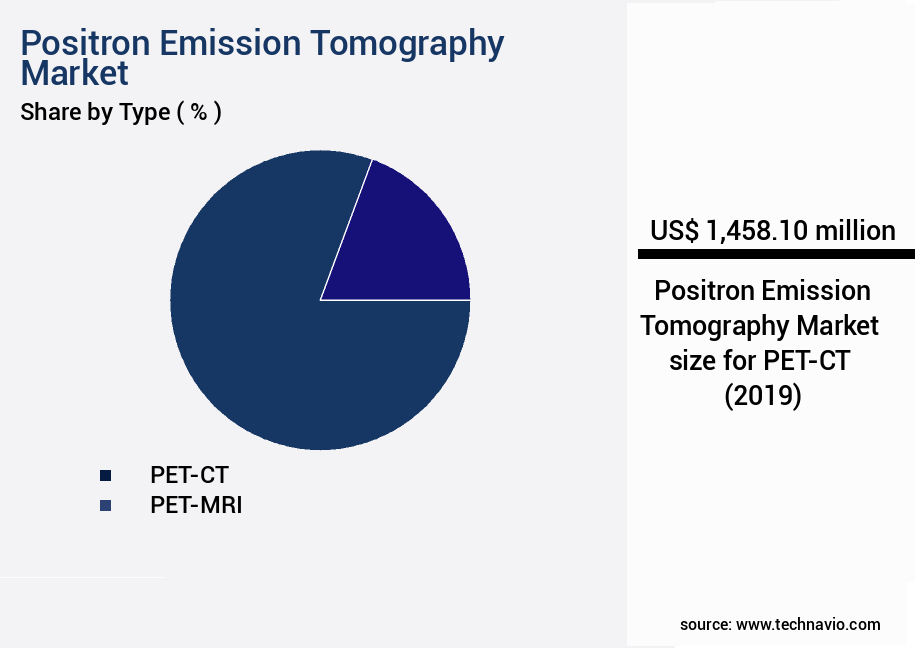
The PET-CT segment was valued at USD 1458.10 million in 2019 and showed a gradual increase during the forecast period.
Regional Analysis
North America is estimated to contribute 38% to the growth of the global market during the forecast period.Technavio's analysts have elaborately explained the regional trends and drivers that shape the market during the forecast period.
See How Positron Emission Tomography Market Demand is Rising in North America Request Free Sample
The North American positron emission tomography (PET) market is a substantial and rapidly expanding sector within the healthcare industry. Fueled by technological advancements, such as PET-CT scanners, and the escalating prevalence of cancer, the demand for PET scanners in this region is robust. Key drivers for this market's growth include the increasing adoption of personalized medicine, the necessity for early cancer detection, and the emergence of targeted therapies. North America's robust healthcare infrastructure, expertise in genomics research, and extensive access to advanced imaging technologies further bolster market growth. According to industry reports, the North American PET market is projected to grow at a significant rate, with one study estimating a compound annual growth rate (CAGR) of approximately 6% from 2021 to 2028.
Another report suggests that the North American PET market is expected to reach a value of over USD3 billion by 2025. These figures underscore the substantial growth potential of the North American PET market in the coming years.
Customer Landscape of Positron Emission Tomography Industry
Competitive Intelligence by Technavio Analysis: Leading Players in the Positron Emission Tomography Market
Companies are implementing various strategies, such as strategic alliances, positron emission tomography market forecast, partnerships, mergers and acquisitions, geographical expansion, and product/service launches, to enhance their presence in the industry.
Bracco S.p.A. - The company specializes in advanced positron emission tomography technology, including the Celesteion Pure ViSION Edition PET system, delivering precise diagnostic imaging for various medical conditions. This cutting-edge technology enhances disease detection and treatment planning, contributing significantly to the healthcare industry's progress.
The industry research and growth report includes detailed analyses of the competitive landscape of the market and information about key companies, including:
- Bracco S.p.A.
- Canon Inc.
- Cardinal Health Inc.
- CellSight Technologies Inc.
- CMR Naviscan Corp.
- GE Healthcare Technologies Inc.
- Jubilant Pharmova Ltd.
- Koninklijke Philips NV
- Mediso Ltd.
- MinFound Medical Systems Co. Ltd.
- Neusoft Corp.
- PETsys Electronics SA
- Positron Corp.
- Radiology Oncology Systems Inc.
- RefleXion Medical Inc.
- Shimadzu Corp.
- Siemens Healthineers AG
- Yangzhou Kindsway Biotech Co. Ltd.
Qualitative and quantitative analysis of companies has been conducted to help clients understand the wider business environment as well as the strengths and weaknesses of key industry players. Data is qualitatively analyzed to categorize companies as pure play, category-focused, industry-focused, and diversified; it is quantitatively analyzed to categorize companies as dominant, leading, strong, tentative, and weak.
Recent Development and News in Positron Emission Tomography Market
- In January 2024, Siemens Healthineers, a leading medical technology company, announced the launch of their new Biograph mCve PET/CT scanner, featuring advanced trueVue HD technology for improved image quality and diagnostic accuracy (Siemens Healthineers Press Release).
- In March 2024, GE Healthcare and Philips signed a strategic partnership to co-develop and commercialize integrated PET/MRI systems, combining the advantages of both technologies for enhanced diagnostic capabilities (GE Healthcare Press Release).
- In May 2025, General Electric Company completed the acquisition of Bioscan, Inc., a leading provider of molecular imaging systems, expanding its presence in the nuclear medicine market and enhancing its PET technology offerings (GE Company Filing).
- In August 2025, the U.S. Food and Drug Administration (FDA) approved the use of the Blue Earth Diagnostics' Axumin PET imaging agent for the detection of recurrent prostate cancer, expanding its indications and increasing the market potential for PET imaging agents (FDA Press Release).
Dive into Technavio's robust research methodology, blending expert interviews, extensive data synthesis, and validated models for unparalleled Positron Emission Tomography Market insights. See full methodology.
|
Market Scope |
|
|
Report Coverage |
Details |
|
Page number |
213 |
|
Base year |
2024 |
|
Historic period |
2019-2023 |
|
Forecast period |
2025-2029 |
|
Growth momentum & CAGR |
Accelerate at a CAGR of 6.2% |
|
Market growth 2025-2029 |
USD 806.3 million |
|
Market structure |
Fragmented |
|
YoY growth 2024-2025(%) |
5.7 |
|
Key countries |
US, Japan, Germany, UK, China, Canada, India, France, Italy, and South Korea |
|
Competitive landscape |
Leading Companies, Market Positioning of Companies, Competitive Strategies, and Industry Risks |
Why Choose Technavio for Positron Emission Tomography Market Insights?
"Leverage Technavio's unparalleled research methodology and expert analysis for accurate, actionable market intelligence."
The Positron Emission Tomography (PET) market is experiencing significant growth due to the increasing demand for advanced diagnostic imaging solutions in various medical fields. FDG PET for cancer staging continues to dominate the market, providing valuable information on tumor metabolism and enabling more accurate diagnosis and treatment planning. In the field of neuroimaging, Amyloid PET imaging plays a crucial role in Alzheimer's disease diagnosis, allowing for the visualization of amyloid plaques in the brain. PET scan image interpretation requires specialized expertise, and the integration of PET with CT imaging through the pet CT image fusion workflow enhances diagnostic accuracy. Quantitative PET analysis software enables more precise measurement of metabolic activity, while myocardial perfusion PET imaging protocols assess cardiac function and viability.
Radiation dose reduction strategies in PET imaging are a major focus, with the design of pet scanner detector modules and implementation of image reconstruction algorithm comparisons playing key roles. Clinical trial PET imaging endpoints are essential for evaluating new therapeutic agents, and neuroreceptor binding kinetics analysis provides insights into disease mechanisms. Advanced PET image processing techniques, such as partial volume effect correction and attenuation correction, improve image quality and enhance diagnostic confidence. Radiotracer pharmacokinetics modeling in PET and image registration algorithms for PET CT contribute to improved diagnostic accuracy and treatment planning. 3D PET image visualization software ensures optimal image interpretation and communication between healthcare providers. Pet scanner system performance evaluation is critical for maintaining diagnostic accuracy and patient safety. Overall, the market continues to evolve, driven by technological advancements and increasing clinical applications.
What are the Key Data Covered in this Positron Emission Tomography Market Research and Growth Report?
-
What is the expected growth of the Positron Emission Tomography Market between 2025 and 2029?
-
USD 806.3 million, at a CAGR of 6.2%
-
-
What segmentation does the market report cover?
-
The report is segmented by Type (PET-CT and PET-MRI), Application (Oncology, Cardiology, and Neurology), End-user (Hospitals, Diagnostic centers, and Research institutes), and Geography (North America, Europe, Asia, and Rest of World (ROW))
-
-
Which regions are analyzed in the report?
-
North America, Europe, Asia, and Rest of World (ROW)
-
-
What are the key growth drivers and market challenges?
-
Increasing prevalence of chronic conditions worldwide, High costs associated with PET imaging
-
-
Who are the major players in the Positron Emission Tomography Market?
-
Bracco S.p.A., Canon Inc., Cardinal Health Inc., CellSight Technologies Inc., CMR Naviscan Corp., GE Healthcare Technologies Inc., Jubilant Pharmova Ltd., Koninklijke Philips NV, Mediso Ltd., MinFound Medical Systems Co. Ltd., Neusoft Corp., PETsys Electronics SA, Positron Corp., Radiology Oncology Systems Inc., RefleXion Medical Inc., Shimadzu Corp., Siemens Healthineers AG, and Yangzhou Kindsway Biotech Co. Ltd.
-
We can help! Our analysts can customize this positron emission tomography market research report to meet your requirements.
 RIA -
RIA - 
