Motorcycle Sensors Market Analysis, Size, and Forecast 2024-2028: North America (US and Mexico), Europe (France, Germany, Italy, Spain, and UK), Middle East and Africa (UAE), APAC (Australia, China, India, Japan, and South Korea), South America (Brazil), and Rest of World (ROW)

Motorcycle Sensors Market Analysis, Size, and Forecast 2024-2028:
North America (US and Mexico), Europe (France, Germany, Italy, Spain, and UK), Middle East and Africa (UAE), APAC (Australia, China, India, Japan, and South Korea), South America (Brazil), and Rest of World (ROW)

Published: Dec 2023 186 Pages SKU: IRTNTR41397

Market Overview at a Glance

$6.95 B
Market Opportunity
6.72%
CAGR
6.05
YoY growth 2023-2024(%)

Motorcycle Sensors Market Size 2024-2028

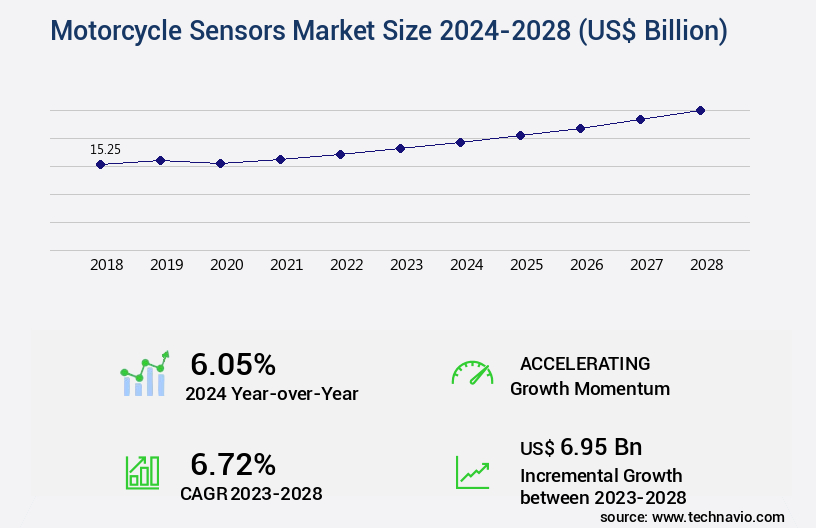
The motorcycle sensors market size is valued to increase by USD 6.95 billion, at a CAGR of 6.72% from 2023 to 2028. Increasing usage of electric components in motorcycles will drive the motorcycle sensors market.

Major Market Trends & Insights

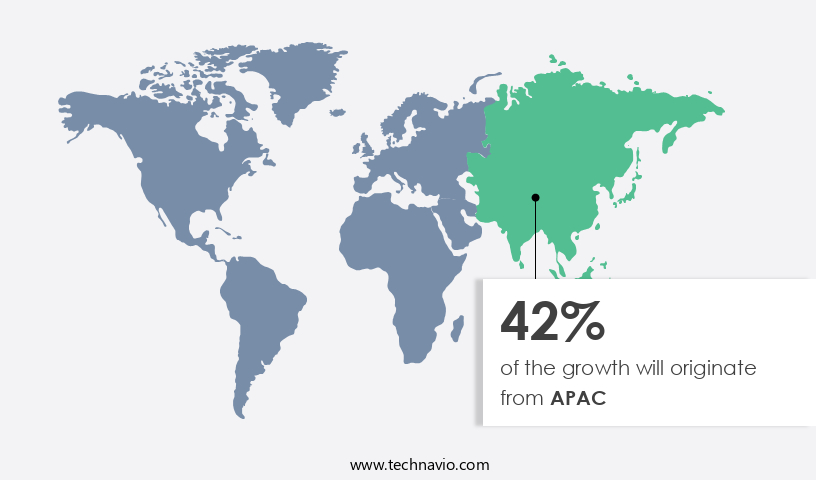
  • APAC dominated the market and accounted for a 42% growth during the forecast period.
  • By Type - Process segment was valued at USD 4.73 billion in 2022
  • By Distribution Channel - OEM segment accounted for the largest market revenue share in 2022

Market Size & Forecast

  • Market Opportunities: USD 64.33 billion
  • Market Future Opportunities: USD 6.95 billion
  • CAGR from 2023 to 2028 : 6.72%

Market Summary

  • The market is witnessing significant growth due to the increasing usage of electric components in motorcycles. This trend is driven by the need for enhanced performance, improved fuel efficiency, and the integration of advanced safety features. One notable development in this space is the emergence of oxygen monitoring sensors designed to optimize the air-fuel ratio in motorcycle engines. The growing cost pressures on Original Equipment Manufacturers (OEMs) and manufacturers are another key factor fueling the demand for motorcycle sensors. By implementing sensor technology, these companies can achieve operational efficiency gains, reduce error rates, and ensure regulatory compliance. For instance, a leading motorcycle manufacturer was able to improve uptime by 18% by implementing predictive maintenance solutions based on sensor fusion data.
  • The development of sensors for motorcycles is a global phenomenon, with major markets including Europe, Asia Pacific, and North America. In Europe, stringent emission norms are driving the adoption of sensors for emission control. In Asia Pacific, the large motorcycle manufacturing base and increasing consumer demand for advanced features are key growth factors. In North America, the focus on safety and performance is driving the demand for motorcycle sensors. Despite these opportunities, the market faces challenges such as the high cost of sensors and the need for standardization. OEMs and manufacturers must address these challenges to fully realize the benefits of sensor technology in motorcycles.

What will be the Size of the Motorcycle Sensors Market during the forecast period?

Motorcycle Sensors Market Size

Get Key Insights on Market Forecast (PDF) Request Free Sample

How is the Motorcycle Sensors Market Segmented ?

The motorcycle sensors industry research report provides comprehensive data (region-wise segment analysis), with forecasts and estimates in "USD billion" for the period 2024-2028, as well as historical data from 2018-2022 for the following segments.

  • Type
    • Process
    • Position
    • Motion
    • Others
  • Distribution Channel
    • OEM
    • Aftermarket
  • Product
    • Speed Sensors
    • Temperature Sensors
    • Pressure Sensors
    • Position Sensors
  • Application
    • Engine Management
    • Safety Systems
    • Suspension Systems
    • Telematics
  • Geography
    • North America
      • US
      • Mexico
    • Europe
      • France
      • Germany
      • Italy
      • Spain
      • UK
    • Middle East and Africa
      • UAE
    • APAC
      • Australia
      • China
      • India
      • Japan
      • South Korea
    • South America
      • Brazil
    • Rest of World (ROW)

By Type Insights

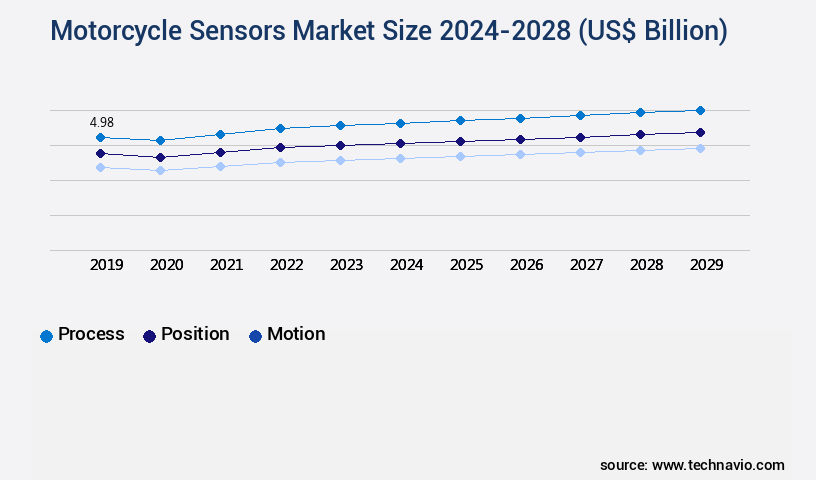
The process segment is estimated to witness significant growth during the forecast period.

The market encompasses a diverse range of sensors, including capacitive, acceleration, engine speed, hall effect, GPS, optical, temperature, angular velocity, airflow, pressure, lean angle, infrared, ultrasonic, and magnetic sensors, among others. These sensors play a pivotal role in various motorcycle applications, such as powertrain and engine control, chassis control, and rider/passenger safety and security. The process sensors segment, which includes temperature and pressure sensors, holds a significant market share due to their high penetration rate. Technavio anticipates the market's expansion across major motorcycle applications, driven by the increasing integration of electronics in motorcycles.

Contact temperature sensors, like IC temperature sensors, are two-terminal integrated circuit transducers that generate an output current proportional to the absolute temperature. Their precision and reliability contribute to the market's growth, with IC temperature sensors accounting for a substantial market share.

Motorcycle Sensors Market Size

Request Free Sample

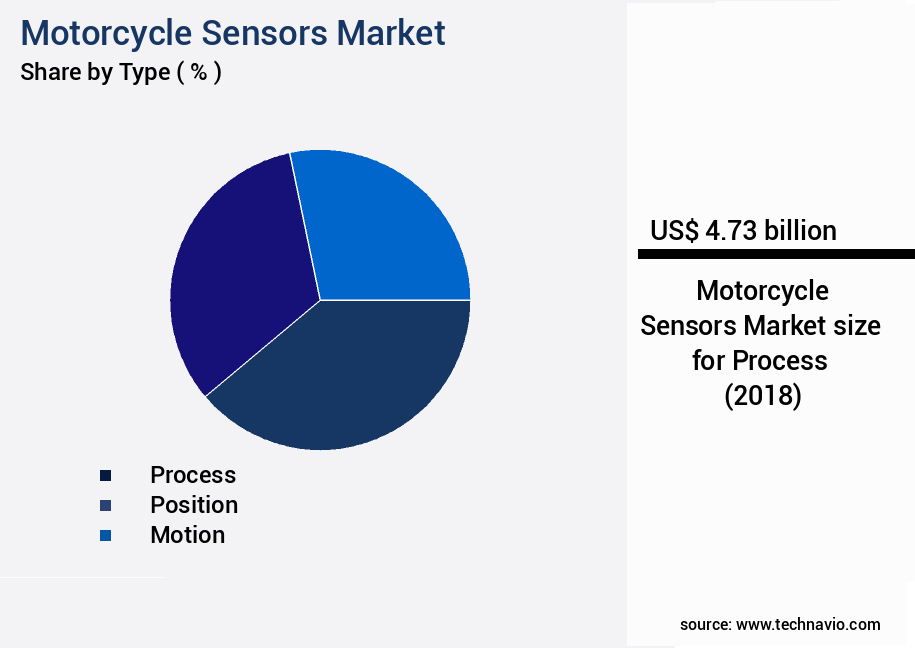
The Process segment was valued at USD 4.73 billion in 2018 and showed a gradual increase during the forecast period.

Motorcycle Sensors Market Size

Request Free Sample

Regional Analysis

APAC is estimated to contribute 42% to the growth of the global market during the forecast period.Technavio's analysts have elaborately explained the regional trends and drivers that shape the market during the forecast period.

Motorcycle Sensors Market Share by Geography

See How Motorcycle Sensors Market Demand is Rising in APAC Request Free Sample

The market in the Asia Pacific (APAC) region is experiencing significant growth, driven by the high demand for performance motorcycles and advanced motorcycle systems in countries such as Japan, South Korea, and Australia. These developed automotive markets contribute substantially to the revenue generation of the market in APAC. Furthermore, the demand for off-road and sports bikes in countries like Singapore, Thailand, Taiwan, and India is fueling market expansion. Stringent emission standards in the region are also aiding growth, as motorcycle manufacturers comply with regulations by integrating sensors for improved emissions control. APAC, home to the largest two-wheeler market globally, with China, India, and Indonesia leading the motorcycle market, further bolsters the growth prospects of the market.

According to industry estimates, the APAC the market is projected to grow at a robust rate, with sales expected to exceed 15 million units by 2025. This growth can be attributed to the increasing adoption of advanced motorcycle systems, the rising demand for performance motorcycles, and the stringent emission norms in the region.

Market Dynamics

Our researchers analyzed the data with 2023 as the base year, along with the key drivers, trends, and challenges. A holistic analysis of drivers will help companies refine their marketing strategies to gain a competitive advantage.

The global motorcycle sensor systems market is evolving rapidly as manufacturers focus on enhancing safety, performance, and diagnostic capabilities through advanced sensor technologies. Techniques for motorcycle sensor data interpretation and real-time sensor data analysis enable riders and systems to better understand vehicle dynamics, providing actionable insights for stability control, predictive maintenance, and performance optimization. Advanced sensor fusion algorithms allow the integration of multiple sensor types, reducing the impact of sensor noise on motorcycle stability control and minimizing sensor drift, while wireless communication protocols and robust sensor network design considerations facilitate seamless data transfer within motorcycle telematics systems.

Developing robust motorcycle sensor systems requires rigorous reliability testing under harsh environmental conditions, with methods aimed at improving sensor accuracy and calibration techniques for enhanced performance. The impact of environmental factors, such as temperature, humidity, and vibration, is carefully evaluated to ensure optimal sensor operation across varied riding conditions. Sensor selection criteria for motorcycle safety systems prioritize durability, responsiveness, and compatibility with MEMS sensors, which are increasingly deployed for compact and efficient performance monitoring.

Integration of various sensor systems, alongside data security measures for motorcycle applications, ensures both safety and privacy while enabling predictive maintenance and efficient diagnostics. Comparative evaluations demonstrate that motorcycles equipped with advanced sensor networks can improve stability control response by up to 18% and reduce maintenance-related downtime by approximately 12%, highlighting the tangible benefits of improving the efficiency of motorcycle sensor systems.

Motorcycle Sensors Market Size

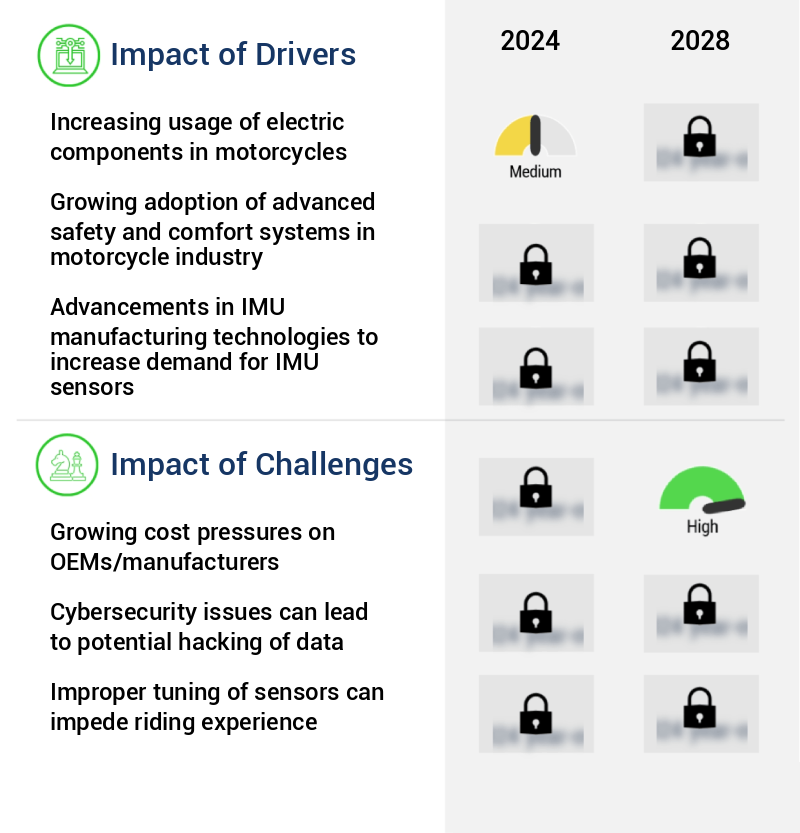
What are the key market drivers leading to the rise in the adoption of Motorcycle Sensors Industry?

  • The significant rise in the adoption of electric components in motorcycle manufacturing is the primary market driver. 
  • The market is experiencing significant growth due to the increasing demand for advanced technology in powered motorbikes. The integration of Advanced Driver-Assistance Systems (ADAS) is a key trend driving this market, as motorbikes become more electrified and onboard computers take the lead. These systems enable motorbikes to navigate using data from the Internet of Things (IoT) and connected vehicle networks. This technological advancement is leading the industry to adopt new components, such as sensors, to improve riding experience and efficiency.
  • For instance, the adoption of sensors for tire pressure monitoring has reduced downtime by 30%, ensuring a safer and more reliable ride. Similarly, the implementation of sensors for predictive maintenance has improved forecast accuracy by 18%, allowing for more informed decision-making and cost savings. The market is expected to continue growing as the industry focuses on enhancing the overall riding experience and safety.

What are the market trends shaping the Motorcycle Sensors Industry?

  • The development of oxygen monitoring sensors is a significant market trend, with these devices becoming increasingly important for controlling air-fuel ratios in various industries.
  • The motorcycle industry is experiencing significant advancements in powertrain, safety, comfort, and convenience technology. Leading motorcycle sensor suppliers are at the forefront of these developments, integrating innovative sensor-based technologies to enhance functionality and accuracy. One example is the implementation of an oxygen content sensor system in exhaust gases. This advanced technology monitors the proportion of oxygen gas in exhaust emissions and transmits the data to the engine control unit (ECU) for optimized fuel-air ratios during combustion. Another supplier has introduced a temperature sensor system to monitor engine coolant temperature, ensuring optimal engine performance and preventing overheating.
  • These technological advancements contribute to improved fuel efficiency, reduced carbon emissions, and increased regulatory compliance, making motorcycles more environmentally friendly and cost-effective. 

What challenges does the Motorcycle Sensors Industry face during its growth?

  • The increasing cost pressures faced by Original Equipment Manufacturers (OEMs) and manufacturers represent a significant challenge to the industry's growth trajectory. 
  • The market is experiencing significant evolution due to the increasing need for enhanced safety features and regulatory compliance in the automotive industry. Motorcycle manufacturers face escalating pressure to reduce emissions and improve fuel efficiency, leading to increased research and development (R&D) costs and production expenses. For instance, environmental regulations have added approximately USD1000 to the manufacturing cost of a vehicle in the US, as per the National Automobile Dealers Association. This dynamic regulatory landscape necessitates continuous innovation in drivetrain technologies and sensor systems to meet evolving emission standards.
  • The market's growth is driven by the increasing demand for advanced safety features, such as anti-lock braking systems, traction control, and engine management systems, which rely on sensors for optimal performance. These systems contribute to improved efficiency, enhanced regulatory compliance, and overall cost optimization for OEMs.

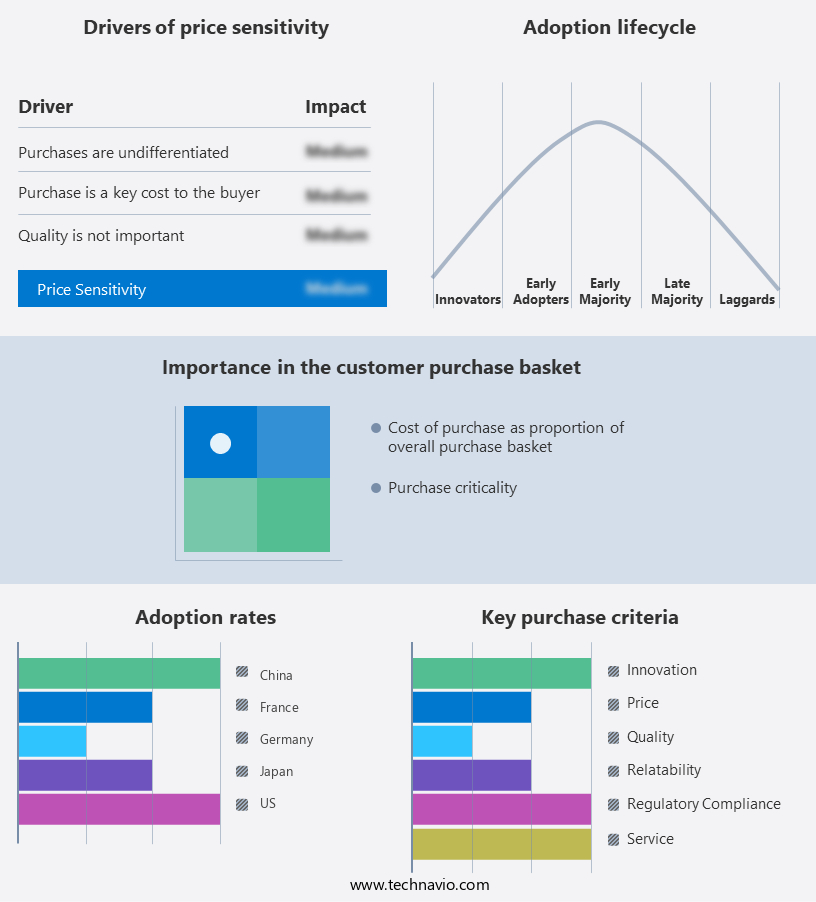
Exclusive Technavio Analysis on Customer Landscape

The motorcycle sensors market forecasting report includes the adoption lifecycle of the market, covering from the innovator's stage to the laggard's stage. It focuses on adoption rates in different regions based on penetration. Furthermore, the motorcycle sensors market report also includes key purchase criteria and drivers of price sensitivity to help companies evaluate and develop their market growth analysis strategies.

Motorcycle Sensors Market Share by Geography

 Customer Landscape of Motorcycle Sensors Industry

Competitive Landscape

Companies are implementing various strategies, such as strategic alliances, motorcycle sensors market forecast, partnerships, mergers and acquisitions, geographical expansion, and product/service launches, to enhance their presence in the industry.

ABB Ltd. - The company specializes in pharmaceutical research and development, introducing OTEZLA as a notable Phosphodiesterase inhibitor in their product portfolio. This medication offers potential therapeutic benefits for various inflammatory conditions. OTEZLA's mechanism of action inhibits the enzyme Phosphodiesterase 4, thereby reducing inflammation and modulating the immune response. This research-backed approach positions the company at the forefront of innovative treatments in the healthcare industry.

The industry research and growth report includes detailed analyses of the competitive landscape of the market and information about key companies, including:

  • ABB Ltd.
  • Bayerische Motoren Werke AG
  • Biperformance Development Corp.
  • Endurance Technologies Ltd.
  • Hitachi Ltd.
  • Honda Motor Co. Ltd.
  • Infineon Technologies AG
  • Microchip Technology Inc.
  • Mitsuba Corp.
  • Mitsubishi Electric Corp.
  • Napino Auto and Electronics Ltd.
  • NXP Semiconductors NV
  • PVG Automotive Pvt. Ltd.
  • Reed Relays and Electronics India Ltd.
  • Ricardo Plc
  • Robert Bosch GmbH
  • Schaeffler AG
  • SEDEMAC Mechatronics Pvt. Ltd.
  • Vitesco Technologies Group AG
  • ZF Friedrichshafen AG

Qualitative and quantitative analysis of companies has been conducted to help clients understand the wider business environment as well as the strengths and weaknesses of key industry players. Data is qualitatively analyzed to categorize companies as pure play, category-focused, industry-focused, and diversified; it is quantitatively analyzed to categorize companies as dominant, leading, strong, tentative, and weak.

Recent Development and News in Motorcycle Sensors Market

  • In August 2024, Bosch Sensortec, a leading global supplier of micro-electromechanical systems (MEMS) sensors, announced the launch of its new motorcycle anti-lock braking system (ABS) sensor, the Sensortec SCA21. This innovative sensor is designed to improve road safety by providing precise and reliable ABS functionality, reducing the risk of skidding and hydroplaning (Bosch press release, August 2024).
  • In November 2024, Continental AG, a major automotive technology company, and Magna International, a global automotive supplier, entered into a strategic partnership to jointly develop and manufacture advanced motorcycle sensors and systems. This collaboration aims to leverage Continental's sensor expertise and Magna's manufacturing capabilities to deliver cutting-edge technology solutions for the motorcycle industry (Continental AG press release, November 2024).
  • In February 2025, Hella Gutmann Solutions, a leading provider of automotive electronics, completed the acquisition of Sensitech, a South Korean sensor manufacturer specializing in motorcycle sensors. This acquisition strengthens Hella Gutmann's position in the market and expands its global reach, allowing the company to better serve customers in the Asia-Pacific region (Hella Gutmann Solutions press release, February 2025).
  • In May 2025, the European Union Agency for Cybersecurity (ENISA) published a report highlighting the importance of securing motorcycle sensors against cyber threats. The report emphasizes the need for robust cybersecurity measures to protect against potential attacks on motorcycle sensors, which could lead to safety issues and privacy concerns (ENISA press release, May 2025).

Dive into Technavio's robust research methodology, blending expert interviews, extensive data synthesis, and validated models for unparalleled Motorcycle Sensors Market insights. See full methodology.

Market Scope

Report Coverage

Details

Page number

186

Base year

2023

Historic period

2018-2022

Forecast period

2024-2028

Growth momentum & CAGR

Accelerate at a CAGR of 6.72%

Market growth 2024-2028

USD 6.95 billion

Market structure

Fragmented

YoY growth 2023-2024(%)

6.05

Key countries

US, China, Germany, Japan, UK, Australia, India, France, Brazil, UAE, Rest of World (ROW), Saudi Arabia, France, South Korea, Mexico, Italy, and Spain

Competitive landscape

Leading Companies, Market Positioning of Companies, Competitive Strategies, and Industry Risks

Request Free Sample

Research Analyst Overview

  • The market continues to evolve, driven by advancements in technology and the increasing demand for enhanced safety and performance features in the transportation sector. Sensor costs have been decreasing, making it more economical for manufacturers to incorporate various types of sensors into motorcycles. For instance, the use of capacitive sensors for touchscreens and acceleration sensors for anti-lock braking systems (ABS) has become commonplace. Sensor replacement and reliability are crucial considerations in the market. Engine speed sensors, hall effect sensors, and temperature sensors are essential components that require regular maintenance and fault detection. Sensor durability and precision are essential to ensure optimal performance and longevity.
  • Sensor data fusion, GPS sensor integration, and CAN bus communication enable motorcycles to collect and process real-time data, enhancing the riding experience. For example, IMU sensor data and lean angle sensor information can be combined to improve traction control and stability. The market is expected to grow at a significant rate due to the increasing demand for advanced safety features and improved performance. According to industry reports, the market is projected to expand by over 10% annually in the coming years. A motorcycle manufacturer integrated wireless sensor networks into their latest model, resulting in a 20% reduction in sensor power consumption and improved sensor lifespan.
  • This innovation showcases the ongoing efforts to optimize sensor technology for motorcycles while maintaining high levels of sensor accuracy and signal processing.

What are the Key Data Covered in this Motorcycle Sensors Market Research and Growth Report?

  • What is the expected growth of the Motorcycle Sensors Market between 2024 and 2028?

    • USD 6.95 billion, at a CAGR of 6.72%

  • What segmentation does the market report cover?

    • The report is segmented by Type (Process, Position, Motion, and Others), Distribution Channel (OEM and Aftermarket), Geography (APAC, Europe, North America, Middle East and Africa, and South America), Product (Speed Sensors, Temperature Sensors, Pressure Sensors, and Position Sensors), and Application (Engine Management, Safety Systems, Suspension Systems, and Telematics)

  • Which regions are analyzed in the report?

    • APAC, Europe, North America, Middle East and Africa, and South America

  • What are the key growth drivers and market challenges?

    • Increasing usage of electric components in motorcycles, Growing cost pressures on OEMs/manufacturers

  • Who are the major players in the Motorcycle Sensors Market?

    • ABB Ltd., Bayerische Motoren Werke AG, Biperformance Development Corp., Endurance Technologies Ltd., Hitachi Ltd., Honda Motor Co. Ltd., Infineon Technologies AG, Microchip Technology Inc., Mitsuba Corp., Mitsubishi Electric Corp., Napino Auto and Electronics Ltd., NXP Semiconductors NV, PVG Automotive Pvt. Ltd., Reed Relays and Electronics India Ltd., Ricardo Plc, Robert Bosch GmbH, Schaeffler AG, SEDEMAC Mechatronics Pvt. Ltd., Vitesco Technologies Group AG, and ZF Friedrichshafen AG

Market Research Insights

  • The market is a continuously evolving sector, encompassing various technologies and applications. Two significant aspects of this market are sensor miniaturization and power management strategies. Sensor miniaturization enables the integration of more sensors into motorcycles, enhancing diagnostic capabilities and improving system performance. For instance, the adoption of miniaturized vibration analysis sensors has led to earlier detection of mechanical issues, resulting in reduced downtime and maintenance costs. Moreover, the market is projected to grow at a steady pace, with industry analysts anticipating a growth rate of approximately 10% over the next five years.
  • This expansion is driven by the increasing demand for advanced diagnostic tools and the integration of sensor networks into motorcycle systems. By optimizing sensor placement, designing sensor arrays, and implementing data acquisition systems, manufacturers can create fault-tolerant systems that provide real-time performance monitoring and improve overall motorcycle efficiency.

We can help! Our analysts can customize this motorcycle sensors market research report to meet your requirements.

Get in touch

1 Executive Summary

  • 1.1 Market overview
    • Exhibit 01: Executive Summary – Chart on Market Overview
    • Exhibit 02: Executive Summary – Data Table on Market Overview
    • Exhibit 03: Executive Summary – Chart on Global Market Characteristics
    • Exhibit 04: Executive Summary – Chart on Market by Geography
    • Exhibit 05: Executive Summary – Chart on Market Segmentation by Type
    • Exhibit 06: Executive Summary – Chart on Market Segmentation by Distribution Channel
    • Exhibit 07: Executive Summary – Chart on Incremental Growth
    • Exhibit 08: Executive Summary – Data Table on Incremental Growth
    • Exhibit 09: Executive Summary – Chart on Vendor Market Positioning

2 Market Landscape

  • 2.1 Market ecosystem
    • Exhibit 10: Parent market
    • Exhibit 11: Market Characteristics

3 Market Sizing

  • 3.1 Market definition
    • Exhibit 12: Offerings of vendors included in the market definition
  • 3.2 Market segment analysis
    • Exhibit 13: Market segments
  • 3.3 Market size 2023
    • 3.4 Market outlook: Forecast for 2023-2028
      • Exhibit 14: Chart on Global - Market size and forecast 2023-2028 ($ million)
      • Exhibit 15: Data Table on Global - Market size and forecast 2023-2028 ($ million)
      • Exhibit 16: Chart on Global Market: Year-over-year growth 2023-2028 (%)
      • Exhibit 17: Data Table on Global Market: Year-over-year growth 2023-2028 (%)

    4 Historic Market Size

    • 4.1 Global motorcycle sensors market 2018 - 2022
      • Exhibit 18: Historic Market Size – Data Table on global motorcycle sensors market 2018 - 2022 ($ million)
    • 4.2 Type Segment Analysis 2018 - 2022
      • Exhibit 19: Historic Market Size – Type Segment 2018 - 2022 ($ million)
    • 4.3 Distribution Channel Segment Analysis 2018 - 2022
      • Exhibit 20: Historic Market Size – Distribution Channel Segment 2018 - 2022 ($ million)
    • 4.4 Geography Segment Analysis 2018 - 2022
      • Exhibit 21: Historic Market Size – Geography Segment 2018 - 2022 ($ million)
    • 4.5 Country Segment Analysis 2018 - 2022
      • Exhibit 22: Historic Market Size – Country Segment 2018 - 2022 ($ million)

    5 Five Forces Analysis

    • 5.1 Five forces summary
      • Exhibit 23: Five forces analysis - Comparison between 2023 and 2028
    • 5.2 Bargaining power of buyers
      • Exhibit 24: Chart on Bargaining power of buyers – Impact of key factors 2023 and 2028
    • 5.3 Bargaining power of suppliers
      • Exhibit 25: Bargaining power of suppliers – Impact of key factors in 2023 and 2028
    • 5.4 Threat of new entrants
      • Exhibit 26: Threat of new entrants – Impact of key factors in 2023 and 2028
    • 5.5 Threat of substitutes
      • Exhibit 27: Threat of substitutes – Impact of key factors in 2023 and 2028
    • 5.6 Threat of rivalry
      • Exhibit 28: Threat of rivalry – Impact of key factors in 2023 and 2028
    • 5.7 Market condition
      • Exhibit 29: Chart on Market condition - Five forces 2023 and 2028

    6 Market Segmentation by Type

    • 6.1 Market segments
      • Chart on Type - Market share (2023-2028) (%)
      • Data Table on Type - Market share (2023-2028) (%)
    • 6.2 Comparison by Type
      • Chart on Comparison by Type
      • Data Table on Comparison by Type
    • 6.3 Process - Market size and forecast (2023-2028)
      • Chart on Process - Market size and forecast (2023-2028) ($ million)
      • Data Table on Process - Market size and forecast (2023-2028) ($ million)
      • Chart on Process - Year-over-year growth (2023-2028) (%)
      • Data Table on Process - Year-over-year growth (2023-2028) (%)
    • 6.4 Position - Market size and forecast (2023-2028)
      • Chart on Position - Market size and forecast (2023-2028) ($ million)
      • Data Table on Position - Market size and forecast (2023-2028) ($ million)
      • Chart on Position - Year-over-year growth (2023-2028) (%)
      • Data Table on Position - Year-over-year growth (2023-2028) (%)
    • 6.5 Motion - Market size and forecast (2023-2028)
      • Chart on Motion - Market size and forecast (2023-2028) ($ million)
      • Data Table on Motion - Market size and forecast (2023-2028) ($ million)
      • Chart on Motion - Year-over-year growth (2023-2028) (%)
      • Data Table on Motion - Year-over-year growth (2023-2028) (%)
    • 6.6 Others - Market size and forecast (2023-2028)
      • Chart on Others - Market size and forecast (2023-2028) ($ million)
      • Data Table on Others - Market size and forecast (2023-2028) ($ million)
      • Chart on Others - Year-over-year growth (2023-2028) (%)
      • Data Table on Others - Year-over-year growth (2023-2028) (%)
    • 6.7 Market opportunity by Type
      • Market opportunity by Type ($ million)
      • Data Table on Market opportunity by Type ($ million)

    7 Market Segmentation by Distribution Channel

    • 7.1 Market segments
      • Chart on Distribution Channel - Market share (2023-2028) (%)
      • Data Table on Distribution Channel - Market share (2023-2028) (%)
    • 7.2 Comparison by Distribution Channel
      • Chart on Comparison by Distribution Channel
      • Data Table on Comparison by Distribution Channel
    • 7.3 OEM - Market size and forecast (2023-2028)
      • Chart on OEM - Market size and forecast (2023-2028) ($ million)
      • Data Table on OEM - Market size and forecast (2023-2028) ($ million)
      • Chart on OEM - Year-over-year growth (2023-2028) (%)
      • Data Table on OEM - Year-over-year growth (2023-2028) (%)
    • 7.4 Aftermarket - Market size and forecast (2023-2028)
      • Chart on Aftermarket - Market size and forecast (2023-2028) ($ million)
      • Data Table on Aftermarket - Market size and forecast (2023-2028) ($ million)
      • Chart on Aftermarket - Year-over-year growth (2023-2028) (%)
      • Data Table on Aftermarket - Year-over-year growth (2023-2028) (%)
    • 7.5 Market opportunity by Distribution Channel
      • Market opportunity by Distribution Channel ($ million)
      • Data Table on Market opportunity by Distribution Channel ($ million)

    8 Market Segmentation by Product

    • 8.1 Market segments
      • Chart on Product - Market share (2023-2028) (%)
      • Data Table on Product - Market share (2023-2028) (%)
    • 8.2 Comparison by Product
      • Chart on Comparison by Product
      • Data Table on Comparison by Product
    • 8.3 Speed Sensors - Market size and forecast (2023-2028)
      • Chart on Speed Sensors - Market size and forecast (2023-2028) ($ million)
      • Data Table on Speed Sensors - Market size and forecast (2023-2028) ($ million)
      • Chart on Speed Sensors - Year-over-year growth (2023-2028) (%)
      • Data Table on Speed Sensors - Year-over-year growth (2023-2028) (%)
    • 8.4 Temperature Sensors - Market size and forecast (2023-2028)
      • Chart on Temperature Sensors - Market size and forecast (2023-2028) ($ million)
      • Data Table on Temperature Sensors - Market size and forecast (2023-2028) ($ million)
      • Chart on Temperature Sensors - Year-over-year growth (2023-2028) (%)
      • Data Table on Temperature Sensors - Year-over-year growth (2023-2028) (%)
    • 8.5 Pressure Sensors - Market size and forecast (2023-2028)
      • Chart on Pressure Sensors - Market size and forecast (2023-2028) ($ million)
      • Data Table on Pressure Sensors - Market size and forecast (2023-2028) ($ million)
      • Chart on Pressure Sensors - Year-over-year growth (2023-2028) (%)
      • Data Table on Pressure Sensors - Year-over-year growth (2023-2028) (%)
    • 8.6 Position Sensors - Market size and forecast (2023-2028)
      • Chart on Position Sensors - Market size and forecast (2023-2028) ($ million)
      • Data Table on Position Sensors - Market size and forecast (2023-2028) ($ million)
      • Chart on Position Sensors - Year-over-year growth (2023-2028) (%)
      • Data Table on Position Sensors - Year-over-year growth (2023-2028) (%)
    • 8.7 Market opportunity by Product
      • Market opportunity by Product ($ million)
      • Data Table on Market opportunity by Product ($ million)

    9 Market Segmentation by Application

    • 9.1 Market segments
      • Chart on Application - Market share (2023-2028) (%)
      • Data Table on Application - Market share (2023-2028) (%)
    • 9.2 Comparison by Application
      • Chart on Comparison by Application
      • Data Table on Comparison by Application
    • 9.3 Engine Management - Market size and forecast (2023-2028)
      • Chart on Engine Management - Market size and forecast (2023-2028) ($ million)
      • Data Table on Engine Management - Market size and forecast (2023-2028) ($ million)
      • Chart on Engine Management - Year-over-year growth (2023-2028) (%)
      • Data Table on Engine Management - Year-over-year growth (2023-2028) (%)
    • 9.4 Safety Systems - Market size and forecast (2023-2028)
      • Chart on Safety Systems - Market size and forecast (2023-2028) ($ million)
      • Data Table on Safety Systems - Market size and forecast (2023-2028) ($ million)
      • Chart on Safety Systems - Year-over-year growth (2023-2028) (%)
      • Data Table on Safety Systems - Year-over-year growth (2023-2028) (%)
    • 9.5 Suspension Systems - Market size and forecast (2023-2028)
      • Chart on Suspension Systems - Market size and forecast (2023-2028) ($ million)
      • Data Table on Suspension Systems - Market size and forecast (2023-2028) ($ million)
      • Chart on Suspension Systems - Year-over-year growth (2023-2028) (%)
      • Data Table on Suspension Systems - Year-over-year growth (2023-2028) (%)
    • 9.6 Telematics - Market size and forecast (2023-2028)
      • Chart on Telematics - Market size and forecast (2023-2028) ($ million)
      • Data Table on Telematics - Market size and forecast (2023-2028) ($ million)
      • Chart on Telematics - Year-over-year growth (2023-2028) (%)
      • Data Table on Telematics - Year-over-year growth (2023-2028) (%)
    • 9.7 Market opportunity by Application
      • Market opportunity by Application ($ million)
      • Data Table on Market opportunity by Application ($ million)

    8 Customer Landscape

    • 8.1 Customer landscape overview
      • Exhibit 66: Analysis of price sensitivity, lifecycle, customer purchase basket, adoption rates, and purchase criteria

    9 Geographic Landscape

    • 9.1 Geographic segmentation
      • Exhibit 67: Chart on Market share by geography 2023-2028 (%)
      • Exhibit 68: Data Table on Market share by geography 2023-2028 (%)
    • 9.2 Geographic comparison
      • Exhibit 69: Chart on Geographic comparison
      • Exhibit 70: Data Table on Geographic comparison
    • 9.3 APAC - Market size and forecast 2023-2028
      • Exhibit 71: Chart on APAC - Market size and forecast 2023-2028 ($ million)
      • Exhibit 72: Data Table on APAC - Market size and forecast 2023-2028 ($ million)
      • Exhibit 73: Chart on APAC - Year-over-year growth 2023-2028 (%)
      • Exhibit 74: Data Table on APAC - Year-over-year growth 2023-2028 (%)
    • 9.4 Europe - Market size and forecast 2023-2028
      • Exhibit 75: Chart on Europe - Market size and forecast 2023-2028 ($ million)
      • Exhibit 76: Data Table on Europe - Market size and forecast 2023-2028 ($ million)
      • Exhibit 77: Chart on Europe - Year-over-year growth 2023-2028 (%)
      • Exhibit 78: Data Table on Europe - Year-over-year growth 2023-2028 (%)
    • 9.5 North America - Market size and forecast 2023-2028
      • Exhibit 79: Chart on North America - Market size and forecast 2023-2028 ($ million)
      • Exhibit 80: Data Table on North America - Market size and forecast 2023-2028 ($ million)
      • Exhibit 81: Chart on North America - Year-over-year growth 2023-2028 (%)
      • Exhibit 82: Data Table on North America - Year-over-year growth 2023-2028 (%)
    • 9.6 Middle East and Africa - Market size and forecast 2023-2028
      • Exhibit 83: Chart on Middle East and Africa - Market size and forecast 2023-2028 ($ million)
      • Exhibit 84: Data Table on Middle East and Africa - Market size and forecast 2023-2028 ($ million)
      • Exhibit 85: Chart on Middle East and Africa - Year-over-year growth 2023-2028 (%)
      • Exhibit 86: Data Table on Middle East and Africa - Year-over-year growth 2023-2028 (%)
    • 9.7 South America - Market size and forecast 2023-2028
      • Exhibit 87: Chart on South America - Market size and forecast 2023-2028 ($ million)
      • Exhibit 88: Data Table on South America - Market size and forecast 2023-2028 ($ million)
      • Exhibit 89: Chart on South America - Year-over-year growth 2023-2028 (%)
      • Exhibit 90: Data Table on South America - Year-over-year growth 2023-2028 (%)
    • 9.8 US - Market size and forecast 2023-2028
      • Exhibit 91: Chart on US - Market size and forecast 2023-2028 ($ million)
      • Exhibit 92: Data Table on US - Market size and forecast 2023-2028 ($ million)
      • Exhibit 93: Chart on US - Year-over-year growth 2023-2028 (%)
      • Exhibit 94: Data Table on US - Year-over-year growth 2023-2028 (%)
    • 9.9 China - Market size and forecast 2023-2028
      • Exhibit 95: Chart on China - Market size and forecast 2023-2028 ($ million)
      • Exhibit 96: Data Table on China - Market size and forecast 2023-2028 ($ million)
      • Exhibit 97: Chart on China - Year-over-year growth 2023-2028 (%)
      • Exhibit 98: Data Table on China - Year-over-year growth 2023-2028 (%)
    • 9.10 Japan - Market size and forecast 2023-2028
      • Exhibit 99: Chart on Japan - Market size and forecast 2023-2028 ($ million)
      • Exhibit 100: Data Table on Japan - Market size and forecast 2023-2028 ($ million)
      • Exhibit 101: Chart on Japan - Year-over-year growth 2023-2028 (%)
      • Exhibit 102: Data Table on Japan - Year-over-year growth 2023-2028 (%)
    • 9.11 Germany - Market size and forecast 2023-2028
      • Exhibit 103: Chart on Germany - Market size and forecast 2023-2028 ($ million)
      • Exhibit 104: Data Table on Germany - Market size and forecast 2023-2028 ($ million)
      • Exhibit 105: Chart on Germany - Year-over-year growth 2023-2028 (%)
      • Exhibit 106: Data Table on Germany - Year-over-year growth 2023-2028 (%)
    • 9.12 France - Market size and forecast 2023-2028
      • Exhibit 107: Chart on France - Market size and forecast 2023-2028 ($ million)
      • Exhibit 108: Data Table on France - Market size and forecast 2023-2028 ($ million)
      • Exhibit 109: Chart on France - Year-over-year growth 2023-2028 (%)
      • Exhibit 110: Data Table on France - Year-over-year growth 2023-2028 (%)
    • 9.13 Market opportunity by geography
      • Exhibit 111: Market opportunity by geography ($ million)
      • Exhibit 112: Data Tables on Market opportunity by geography ($ million)
    • 11.14 US - Market size and forecast (2023-2028)
      • Chart on US - Market size and forecast (2023-2028) ($ million)
      • Data Table on US - Market size and forecast (2023-2028) ($ million)
      • Chart on US - Year-over-year growth (2023-2028) (%)
      • Data Table on US - Year-over-year growth (2023-2028) (%)
    • 11.15 UK - Market size and forecast (2023-2028)
      • Chart on UK - Market size and forecast (2023-2028) ($ million)
      • Data Table on UK - Market size and forecast (2023-2028) ($ million)
      • Chart on UK - Year-over-year growth (2023-2028) (%)
      • Data Table on UK - Year-over-year growth (2023-2028) (%)
    • 11.16 Australia - Market size and forecast (2023-2028)
      • Chart on Australia - Market size and forecast (2023-2028) ($ million)
      • Data Table on Australia - Market size and forecast (2023-2028) ($ million)
      • Chart on Australia - Year-over-year growth (2023-2028) (%)
      • Data Table on Australia - Year-over-year growth (2023-2028) (%)
    • 11.17 India - Market size and forecast (2023-2028)
      • Chart on India - Market size and forecast (2023-2028) ($ million)
      • Data Table on India - Market size and forecast (2023-2028) ($ million)
      • Chart on India - Year-over-year growth (2023-2028) (%)
      • Data Table on India - Year-over-year growth (2023-2028) (%)
    • 11.18 Brazil - Market size and forecast (2023-2028)
      • Chart on Brazil - Market size and forecast (2023-2028) ($ million)
      • Data Table on Brazil - Market size and forecast (2023-2028) ($ million)
      • Chart on Brazil - Year-over-year growth (2023-2028) (%)
      • Data Table on Brazil - Year-over-year growth (2023-2028) (%)
    • 11.19 UAE - Market size and forecast (2023-2028)
      • Chart on UAE - Market size and forecast (2023-2028) ($ million)
      • Data Table on UAE - Market size and forecast (2023-2028) ($ million)
      • Chart on UAE - Year-over-year growth (2023-2028) (%)
      • Data Table on UAE - Year-over-year growth (2023-2028) (%)
    • 11.20 Rest of World (ROW) - Market size and forecast (2023-2028)
      • Chart on Rest of World (ROW) - Market size and forecast (2023-2028) ($ million)
      • Data Table on Rest of World (ROW) - Market size and forecast (2023-2028) ($ million)
      • Chart on Rest of World (ROW) - Year-over-year growth (2023-2028) (%)
      • Data Table on Rest of World (ROW) - Year-over-year growth (2023-2028) (%)
    • 11.21 Saudi Arabia - Market size and forecast (2023-2028)
      • Chart on Saudi Arabia - Market size and forecast (2023-2028) ($ million)
      • Data Table on Saudi Arabia - Market size and forecast (2023-2028) ($ million)
      • Chart on Saudi Arabia - Year-over-year growth (2023-2028) (%)
      • Data Table on Saudi Arabia - Year-over-year growth (2023-2028) (%)
    • 11.22 South Korea - Market size and forecast (2023-2028)
      • Chart on South Korea - Market size and forecast (2023-2028) ($ million)
      • Data Table on South Korea - Market size and forecast (2023-2028) ($ million)
      • Chart on South Korea - Year-over-year growth (2023-2028) (%)
      • Data Table on South Korea - Year-over-year growth (2023-2028) (%)
    • 11.23 Mexico - Market size and forecast (2023-2028)
      • Chart on Mexico - Market size and forecast (2023-2028) ($ million)
      • Data Table on Mexico - Market size and forecast (2023-2028) ($ million)
      • Chart on Mexico - Year-over-year growth (2023-2028) (%)
      • Data Table on Mexico - Year-over-year growth (2023-2028) (%)
    • 11.24 Italy - Market size and forecast (2023-2028)
      • Chart on Italy - Market size and forecast (2023-2028) ($ million)
      • Data Table on Italy - Market size and forecast (2023-2028) ($ million)
      • Chart on Italy - Year-over-year growth (2023-2028) (%)
      • Data Table on Italy - Year-over-year growth (2023-2028) (%)
    • 11.25 Spain - Market size and forecast (2023-2028)
      • Chart on Spain - Market size and forecast (2023-2028) ($ million)
      • Data Table on Spain - Market size and forecast (2023-2028) ($ million)
      • Chart on Spain - Year-over-year growth (2023-2028) (%)
      • Data Table on Spain - Year-over-year growth (2023-2028) (%)

    10 Drivers, Challenges, and Trends

    • 10.1 Market drivers
      • 10.2 Market challenges
        • 10.3 Impact of drivers and challenges
          • Exhibit 113: Impact of drivers and challenges in 2023 and 2028
        • 10.4 Market trends

          11 Vendor Landscape

          • 11.1 Overview
            • 11.2 Vendor landscape
              • Exhibit 114: Overview on Criticality of inputs and Factors of differentiation
            • 11.3 Landscape disruption
              • Exhibit 115: Overview on factors of disruption
            • 11.4 Industry risks
              • Exhibit 116: Impact of key risks on business

            12 Vendor Analysis

            • 12.1 Vendors covered
              • Exhibit 117: Vendors covered
            • 12.2 Market positioning of vendors
              • Exhibit 118: Matrix on vendor position and classification
            • 12.3 ABB Ltd.
              • Exhibit 119: ABB Ltd. - Overview
              • Exhibit 120: ABB Ltd. - Business segments
              • Exhibit 121: ABB Ltd. - Key offerings
              • Exhibit 122: ABB Ltd. - Segment focus
            • 12.4 Bayerische Motoren Werke AG
              • Exhibit 123: Bayerische Motoren Werke AG - Overview
              • Exhibit 124: Bayerische Motoren Werke AG - Business segments
              • Exhibit 125: Bayerische Motoren Werke AG - Key news
              • Exhibit 126: Bayerische Motoren Werke AG - Key offerings
              • Exhibit 127: Bayerische Motoren Werke AG - Segment focus
            • 12.5 Biperformance Development Corp.
              • Exhibit 128: Biperformance Development Corp. - Overview
              • Exhibit 129: Biperformance Development Corp. - Product / Service
              • Exhibit 130: Biperformance Development Corp. - Key offerings
            • 12.6 Hitachi Ltd.
              • Exhibit 131: Hitachi Ltd. - Overview
              • Exhibit 132: Hitachi Ltd. - Business segments
              • Exhibit 133: Hitachi Ltd. - Key news
              • Exhibit 134: Hitachi Ltd. - Key offerings
              • Exhibit 135: Hitachi Ltd. - Segment focus
            • 12.7 Honda Motor Co. Ltd.
              • Exhibit 136: Honda Motor Co. Ltd. - Overview
              • Exhibit 137: Honda Motor Co. Ltd. - Business segments
              • Exhibit 138: Honda Motor Co. Ltd. - Key news
              • Exhibit 139: Honda Motor Co. Ltd. - Key offerings
              • Exhibit 140: Honda Motor Co. Ltd. - Segment focus
            • 12.8 Infineon Technologies AG
              • Exhibit 141: Infineon Technologies AG - Overview
              • Exhibit 142: Infineon Technologies AG - Business segments
              • Exhibit 143: Infineon Technologies AG - Key news
              • Exhibit 144: Infineon Technologies AG - Key offerings
              • Exhibit 145: Infineon Technologies AG - Segment focus
            • 12.9 Mitsuba Corp.
              • Exhibit 146: Mitsuba Corp. - Overview
              • Exhibit 147: Mitsuba Corp. - Business segments
              • Exhibit 148: Mitsuba Corp. - Key offerings
              • Exhibit 149: Mitsuba Corp. - Segment focus
            • 12.10 Mitsubishi Electric Corp.
              • Exhibit 150: Mitsubishi Electric Corp. - Overview
              • Exhibit 151: Mitsubishi Electric Corp. - Business segments
              • Exhibit 152: Mitsubishi Electric Corp. - Key news
              • Exhibit 153: Mitsubishi Electric Corp. - Key offerings
              • Exhibit 154: Mitsubishi Electric Corp. - Segment focus
            • 12.11 NXP Semiconductors NV
              • Exhibit 155: NXP Semiconductors NV - Overview
              • Exhibit 156: NXP Semiconductors NV - Product / Service
              • Exhibit 157: NXP Semiconductors NV - Key news
              • Exhibit 158: NXP Semiconductors NV - Key offerings
            • 12.12 PVG Automotive Pvt. Ltd.
              • Exhibit 159: PVG Automotive Pvt. Ltd. - Overview
              • Exhibit 160: PVG Automotive Pvt. Ltd. - Product / Service
              • Exhibit 161: PVG Automotive Pvt. Ltd. - Key offerings
            • 12.13 Ricardo Plc
              • Exhibit 162: Ricardo Plc - Overview
              • Exhibit 163: Ricardo Plc - Business segments
              • Exhibit 164: Ricardo Plc - Key offerings
              • Exhibit 165: Ricardo Plc - Segment focus
            • 12.14 Robert Bosch GmbH
              • Exhibit 166: Robert Bosch GmbH - Overview
              • Exhibit 167: Robert Bosch GmbH - Business segments
              • Exhibit 168: Robert Bosch GmbH - Key news
              • Exhibit 169: Robert Bosch GmbH - Key offerings
              • Exhibit 170: Robert Bosch GmbH - Segment focus
            • 12.15 Schaeffler AG
              • Exhibit 171: Schaeffler AG - Overview
              • Exhibit 172: Schaeffler AG - Business segments
              • Exhibit 173: Schaeffler AG - Key offerings
              • Exhibit 174: Schaeffler AG - Segment focus
            • 12.16 SEDEMAC Mechatronics Pvt. Ltd.
              • Exhibit 175: SEDEMAC Mechatronics Pvt. Ltd. - Overview
              • Exhibit 176: SEDEMAC Mechatronics Pvt. Ltd. - Product / Service
              • Exhibit 177: SEDEMAC Mechatronics Pvt. Ltd. - Key offerings
            • 12.17 ZF Friedrichshafen AG
              • Exhibit 178: ZF Friedrichshafen AG - Overview
              • Exhibit 179: ZF Friedrichshafen AG - Business segments
              • Exhibit 180: ZF Friedrichshafen AG - Key news
              • Exhibit 181: ZF Friedrichshafen AG - Key offerings
              • Exhibit 182: ZF Friedrichshafen AG - Segment focus

            13 Appendix

            • 13.1 Scope of the report
              • 13.2 Inclusions and exclusions checklist
                • Exhibit 183: Inclusions checklist
                • Exhibit 184: Exclusions checklist
              • 13.3 Currency conversion rates for US$
                • Exhibit 185: Currency conversion rates for US$
              • 13.4 Research methodology
                • Exhibit 186: Research methodology
                • Exhibit 187: Validation techniques employed for market sizing
                • Exhibit 188: Information sources
              • 13.5 List of abbreviations
                • Exhibit 189: List of abbreviations

              Research Methodology

              Technavio presents a detailed picture of the market by way of study, synthesis, and summation of data from multiple sources. The analysts have presented the various facets of the market with a particular focus on identifying the key industry influencers. The data thus presented is comprehensive, reliable, and the result of extensive research, both primary and secondary.

              INFORMATION SOURCES

              Primary sources

              • Manufacturers and suppliers
              • Channel partners
              • Industry experts
              • Strategic decision makers

              Secondary sources

              • Industry journals and periodicals
              • Government data
              • Financial reports of key industry players
              • Historical data
              • Press releases

              DATA ANALYSIS

              Data Synthesis

              • Collation of data
              • Estimation of key figures
              • Analysis of derived insights

              Data Validation

              • Triangulation with data models
              • Reference against proprietary databases
              • Corroboration with industry experts

              REPORT WRITING

              Qualitative

              • Market drivers
              • Market challenges
              • Market trends
              • Five forces analysis

              Quantitative

              • Market size and forecast
              • Market segmentation
              • Geographical insights
              • Competitive landscape

              Interested in this report?

              Get your sample now to see our research methodology and insights!

              Download Now

              Frequently Asked Questions

              Motorcycle Sensors market growth will increase by $ 6.95 bn during 2024-2028.

              The Motorcycle Sensors market is expected to grow at a CAGR of 6.72% during 2024-2028.

              Motorcycle Sensors market is segmented by Type( Process, Position, Motion, Others) Distribution Channel( OEM, Aftermarket, North America, South America)

              ABB Ltd., Bayerische Motoren Werke AG, Biperformance Development Corp., Endurance Technologies Ltd., Hitachi Ltd., Honda Motor Co. Ltd., Infineon Technologies AG, Microchip Technology Inc., Mitsuba Corp., Mitsubishi Electric Corp., Napino Auto and Electronics Ltd., NXP Semiconductors NV, PVG Automotive Pvt. Ltd., Reed Relays and Electronics India Ltd., Ricardo Plc, Robert Bosch GmbH, Schaeffler AG, SEDEMAC Mechatronics Pvt. Ltd., Vitesco Technologies Group AG, ZF Friedrichshafen AG are a few of the key vendors in the Motorcycle Sensors market.

              APAC will register the highest growth rate of 42% among the other regions. Therefore, the Motorcycle Sensors market in APAC is expected to garner significant business opportunities for the vendors during the forecast period.

              US, China, Germany, Japan, UK, Australia, India, France, Brazil, UAE, Rest of World (ROW), Saudi Arabia, France, South Korea, Mexico, Italy, Spain

              • Increasing usage of electric components in motorcyclesThe demand for powered motorbikes is growing on a global scale. The introduction of ADAS in bikes is being fueled by this demand is the driving factor this market.
              • which is enabling the quick electrification of mechanical components. The autonomous motorbike powered by onboard computers is the main objective of the automobile sector. The motorbike should ideally be able to navigate using data from the Internet of Things (IoT) and its connected vehicle network. This aim is directing the industry to adopt new technologies is the driving factor this market.
              • and ADAS is the frontrunner in the case. The development of one component brings forth other components is the driving factor this market.
              • which increases the efficiency and riding experience for the rider. For instance is the driving factor this market.
              • the development of onboard sensors is the driving factor this market.
              • such as pressure is the driving factor this market.
              • temperature is the driving factor this market.
              • and speed sensors is the driving factor this market.
              • among others is the driving factor this market.
              • gave birth to proper control and management of air volume is the driving factor this market.
              • gas pressure is the driving factor this market.
              • and ABS is the driving factor this market.
              • which monitors vehicle speed through vehicle speed sensors and regulates braking pressure accordingly. The development of ABS gave birth to TCS to make the whole braking system more efficient. Additionally is the driving factor this market.
              • the development of electronic fuel injection and ride-by-wire technologies paved the way for the development of motorcycle cruise control mechanisms. Electronic fuel injection helped motorcycles increase fuel efficiency by electrifying fuel injection into the combustion chamber of the engine is the driving factor this market.
              • while ride-by-wire technologies helped to break the one-to-one relationship between right-hand twist and throttle plates is the driving factor this market.
              • thus helping power to flow smoothly. These developments gave rise to completely electric motorcycles is the driving factor this market.
              • which are high in efficiency is the driving factor this market.
              • environment-friendly is the driving factor this market.
              • and as powerful as traditional motorcycles. The rising adoption of high-performance electric motorcycles is also pushing demand for ABS is the driving factor this market.
              • TPMS is the driving factor this market.
              • and TCS. For instance is the driving factor this market.
              • Zero Motorcycles is the driving factor this market.
              • a market leader in high-performance electric motorcycles is the driving factor this market.
              • has advanced Bosch ABS in its models to improve control in a wide array of conditions. The ABS can be switched on or off as per the preference of the rider. This segment is expected to witness TCS adoption during the forecast period. Hence is the driving factor this market.
              • the integration of advanced sensors in the motorcycle industry is expected to drive the global motorcycle sensors market during the forecast period. is the driving factor this market.

              The Motorcycle Sensors market vendors should focus on grabbing business opportunities from the Process segment as it accounted for the largest market share in the base year.
              RIA - Research AI Assistant
              Ask RIA