
Multi-Cloud Cost Intelligence Platforms Market Size and Growth Forecast 2026-2030
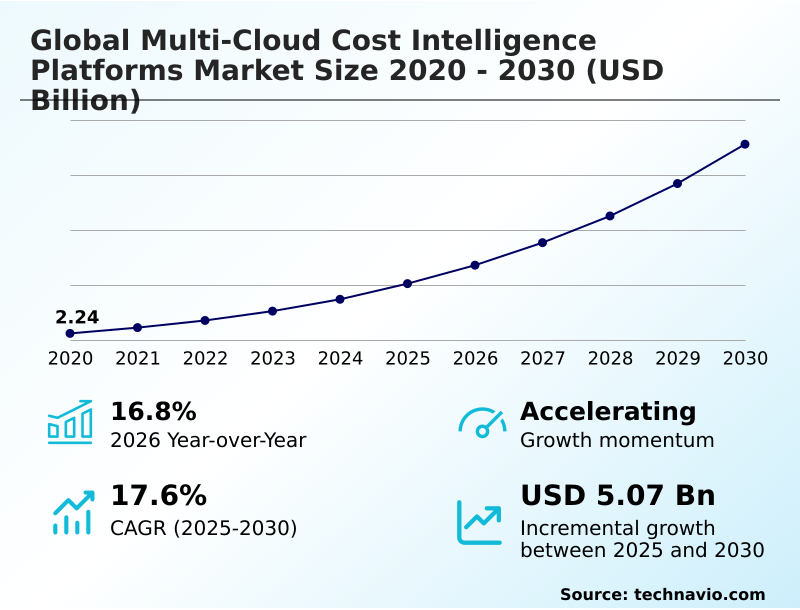
The Multi-Cloud Cost Intelligence Platforms Market size was valued at USD 4.05 billion in 2025 growing at a CAGR of 17.6% during the forecast period 2026-2030.
North America accounts for 32.7% of incremental growth during the forecast period. The Public cloud segment by Deployment was valued at USD 1.68 billion in 2024, while the Large enterprises segment holds the largest revenue share by End-user.
The market is projected to grow by USD 6.88 billion from 2020 to 2030, with USD 5.07 billion of the growth expected during the forecast period of 2025 to 2030.
Get Key Insights on Market Forecast (PDF) Request Free Sample
Multi-Cloud Cost Intelligence Platforms Market Overview
The multi-cloud cost intelligence platforms market is driven by the enterprise need for fiscal discipline in increasingly complex distributed systems, a landscape where North America accounts for over 32% of the incremental growth. As organizations adopt hybrid cloud management strategies, the challenge of billing data normalization intensifies. For instance, a global e-commerce firm using multiple public clouds for its transaction processing and data analytics workloads must perform unit cost analysis to correlate cloud spend with business outcomes. Without an automated platform, this requires significant manual effort from FinOps practitioners. Effective security governance and adherence to data residency laws such as the GDPR further complicate workload placement optimization. These platforms provide the necessary real-time anomaly detection and cost forecasting to manage a multi-provider landscape, enabling engineering-led cost visibility and transforming raw billing data into actionable financial operations intelligence.
Drivers, Trends, and Challenges in the Multi-Cloud Cost Intelligence Platforms Market
Enterprises are increasingly adopting strategies to manage cloud spend across heterogeneous environments, moving beyond simple cost tracking to a more integrated approach. This involves the need to achieve fiscal transparency in distributed systems, a task complicated by disparate billing structures from multiple vendors.
Decision-makers must now implement FinOps frameworks for corporate accountability, ensuring that every dollar of cloud spend is justified. A key tactic is to correlate cloud spend with business outcomes, which provides a clear ROI on digital infrastructure investments.
For instance, a media streaming company can optimize workload placement for cost and performance by analyzing real-time usage data, ensuring that high-demand content is served from the most cost-effective regions without sacrificing latency, a practice aligned with ISO/IEC 20000 service management principles. This level of granularity requires tools that can attribute costs down to the Kubernetes namespace, providing actionable insights.
Another critical capability is the ability to automate remediation of cloud cost spikes, preventing budget overruns before they impact financial results. Ultimately, the goal is to bridge the gap between finance and engineering teams, fostering a culture of shared ownership over cloud expenditures.
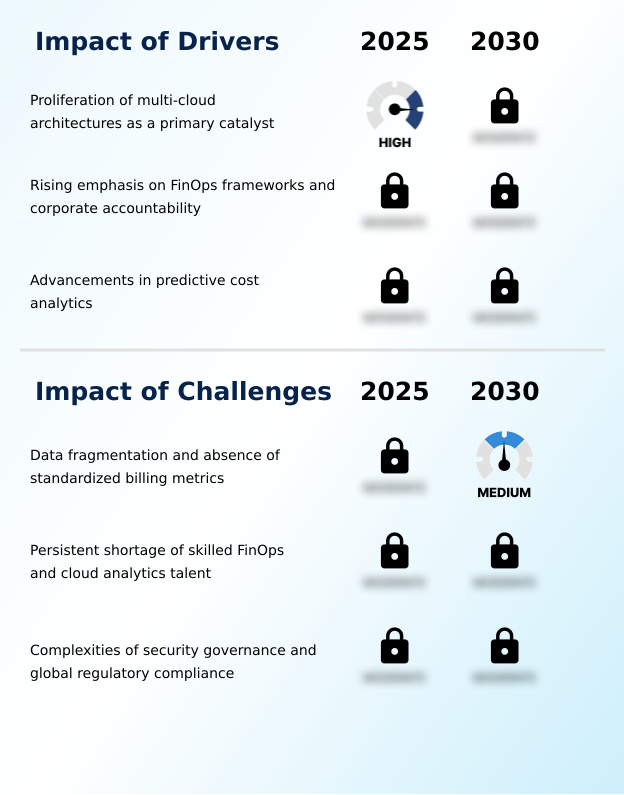
Primary Growth Driver: The proliferation of multi-cloud architectures is a primary catalyst and key driver for market growth, creating a need for centralized cost intelligence.
The primary driver is the widespread adoption of multi-cloud architectures, which creates a management vacuum and necessitates tools for centralized cloud spend visibility.
This is compounded by the rise of the FinOps culture, which promotes cloud financial accountability across engineering and finance teams, bridging a traditional organizational gap.
This movement relies on platforms providing engineering-led cost visibility to foster fiscal discipline at the development stage. Advancements in predictive cost analytics are also a significant catalyst, transforming cloud cost management from a reactive to a proactive discipline.
These AI-driven systems provide spend forecasting and real-time anomaly detection, which are critical for preventing budget overages and reducing idle resource waste in large-scale digital estates.
Emerging Market Trend: The integration of AI and machine learning for predictive FinOps is an upcoming market trend, shifting cost management from reactive monitoring to proactive financial operations.
The market is rapidly evolving with the integration of AI and machine learning, enabling proactive financial operations through predictive cost analytics and automated rightsizing. This shift supports the implementation of unit economics, allowing organizations to measure cloud resource allocation against specific business metrics.
A significant trend is the push for container-native cost visibility, essential for Kubernetes optimization and accurate chargeback and showback in microservices architectures. Furthermore, the convergence of sustainability metrics with financial management, known as GreenOps, is gaining momentum.
This involves carbon tracking and optimizing for environmental sustainability alongside fiscal discipline, reflecting broader corporate responsibility goals and compliance with standards such as the Greenhouse Gas Protocol.
Key Industry Challenge: Data fragmentation and the absence of standardized billing metrics across cloud providers present a key challenge, hindering accurate and unified expenditure analysis.
A critical structural issue is data fragmentation and the absence of standardized billing metrics across the multi-provider landscape, which complicates billing data normalization and undermines efforts to achieve a unified view of expenditure. This lack of interoperability increases the maintenance burden and costs for platform vendors.
A second major challenge is the persistent shortage of skilled FinOps practitioners and cloud analytics talent. This talent gap limits the ability of organizations to fully leverage the insights from cost intelligence platforms, turning sophisticated software into an underutilized asset.
Finally, ensuring security governance and compliance with global data residency laws like the GDPR introduces significant complexity, as platforms require high-level access to sensitive billing data, creating security risks and increasing operational overhead for vendors.
Explore Full Market Dynamics Analysis Request Free Sample
Multi-Cloud Cost Intelligence Platforms Market Segmentation
The multi-cloud cost intelligence platforms industry research report provides comprehensive data including region-wise segment analysis, with forecasts and analysis for the period 2026-2030, as well as historical data from 2020-2024 for the following segments.
Deployment Segment Analysis
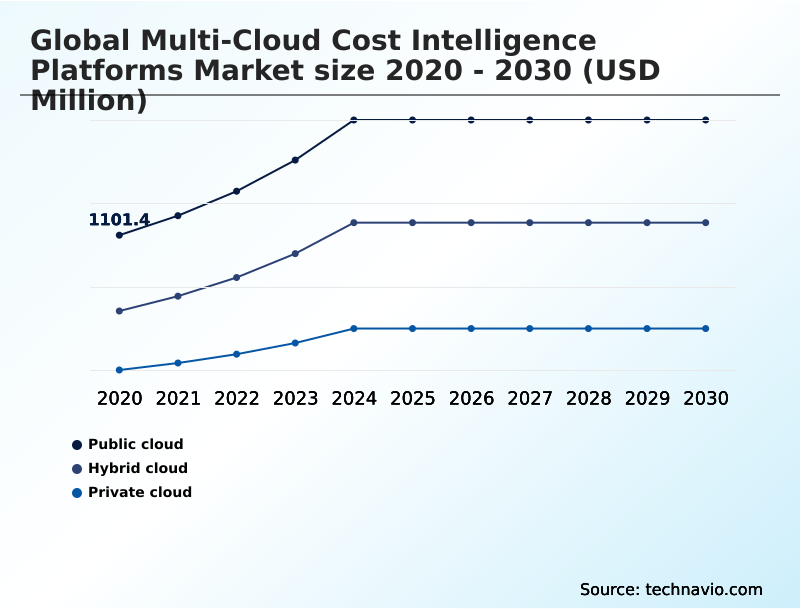
The public cloud segment is estimated to witness significant growth during the forecast period.
The public cloud segment is foundational for multi-cloud cost intelligence platforms, driven by the complex billing of major hyperscalers.
Organizations face variable expenses from data egress fees, storage tiers, and compute instances, creating significant risk of financial waste from unoptimized resources.
Effective cloud cost management requires platforms that provide cost visibility into decentralized procurement, aggregating disparate costs into a single pane of glass for better cloud financial accountability. As businesses scale operations, automated cloud consumption monitoring and spend forecasting become essential.
The shift toward serverless computing adds abstraction layers, making manual tracking ineffective. By implementing multi-cloud cost intelligence, organizations achieve a state of fiscal discipline where every dollar is mapped to specific projects, a core tenet of modern financial operations.
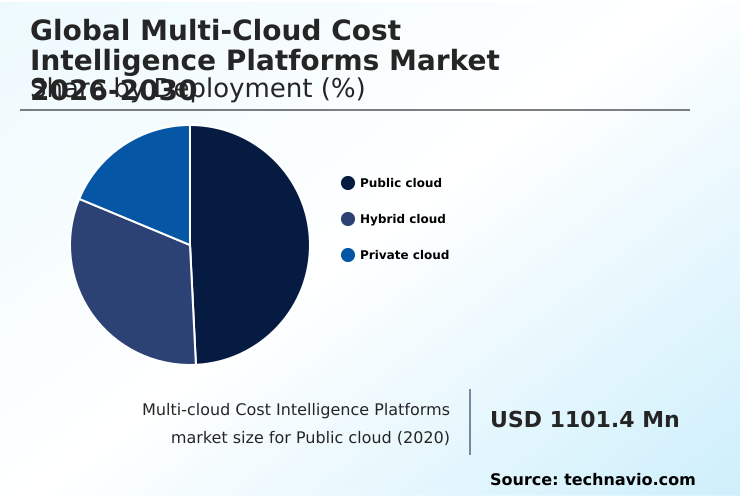
The Public cloud segment was valued at USD 1.68 billion in 2024 and showed a gradual increase during the forecast period.
Multi-Cloud Cost Intelligence Platforms Market by Region: North America Leads with 32.7% Growth Share
North America is estimated to contribute 32.7% to the growth of the global market during the forecast period.
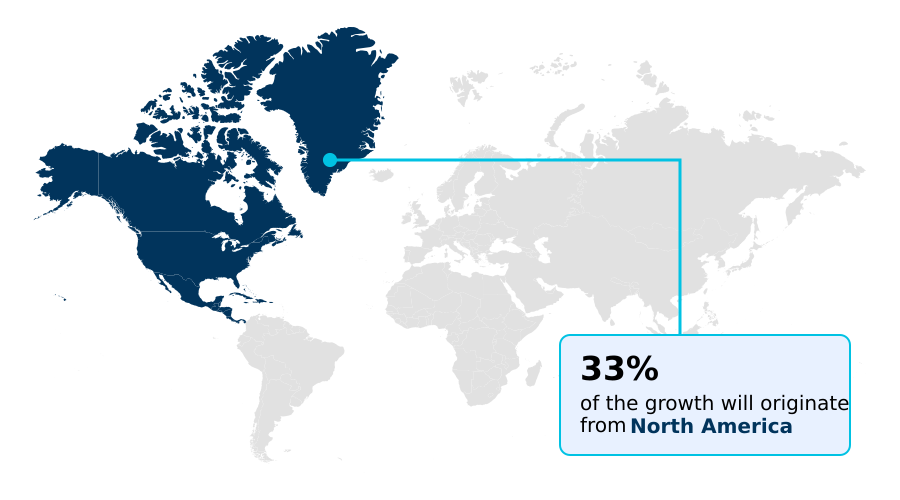
The geographic landscape is led by North America, which is projected to contribute over 32% of the market's incremental growth, reflecting early cloud adoption and a high concentration of hyperscale providers.
This maturity drives demand for sophisticated FinOps frameworks and autonomous cost optimization.
In contrast, APAC is the fastest-growing region, with a CAGR of 18.9%, fueled by rapid digitalization and the presence of local cloud giants, which necessitates robust billing data normalization.
Europe, with a 17.3% CAGR, emphasizes compliance with regulations like the GDPR, influencing security governance and the adoption of GreenOps for carbon tracking.
This regional diversity underscores the need for platforms that can manage a complex multi-provider landscape while catering to localized requirements for cloud resource allocation and fiscal transparency.
Customer Landscape Analysis for the Multi-Cloud Cost Intelligence Platforms Market
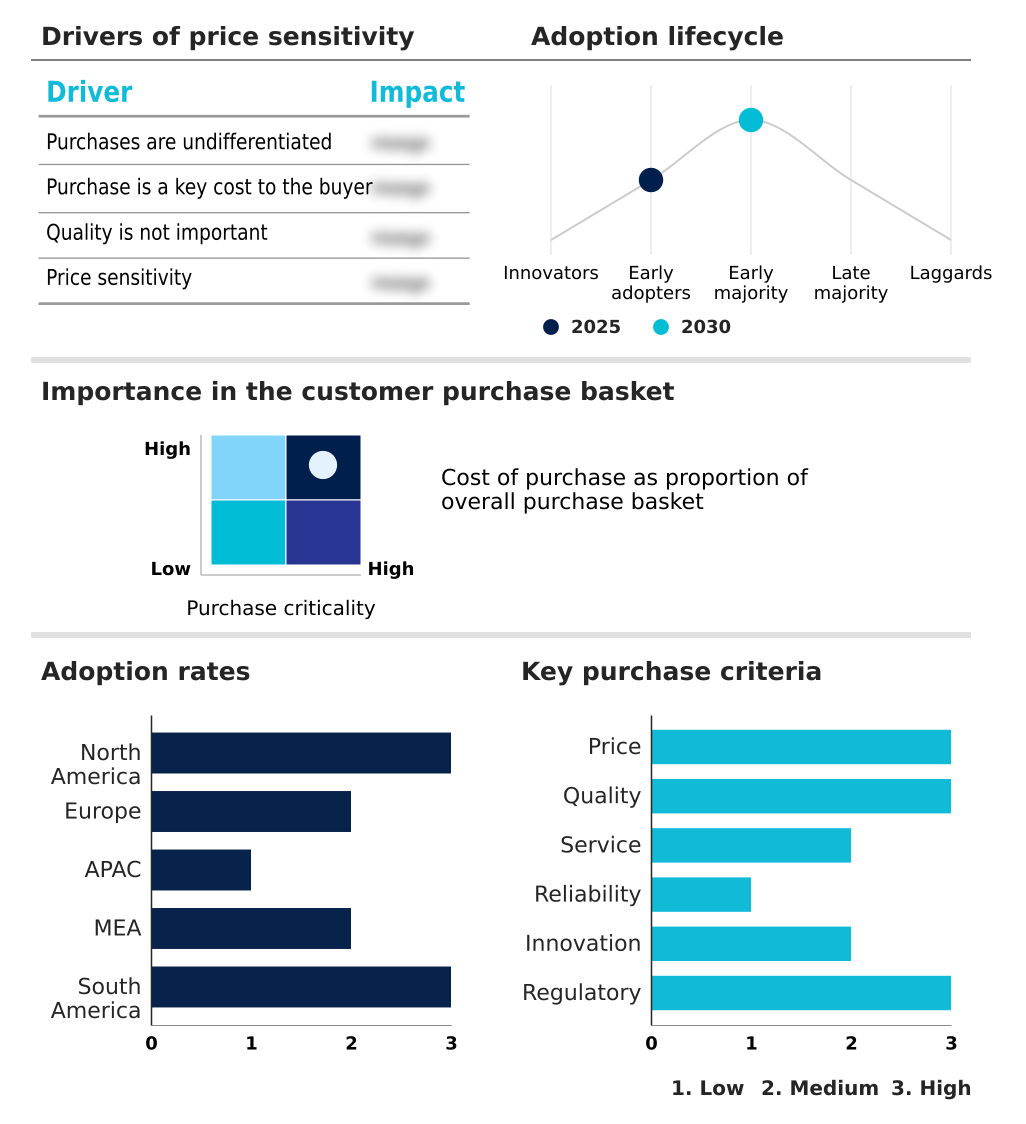
The multi-cloud cost intelligence platforms market forecasting report includes the adoption lifecycle of the market, covering from the innovator’s stage to the laggard’s stage. It focuses on adoption rates in different regions based on penetration. Furthermore, the multi-cloud cost intelligence platforms market report also includes key purchase criteria and drivers of price sensitivity to help companies evaluate and develop their market growth analysis strategies.
Competitive Landscape of the Multi-Cloud Cost Intelligence Platforms Market
Companies are implementing various strategies, such as strategic alliances, partnerships, mergers and acquisitions, geographical expansion, and product/service launches, to enhance their presence in the multi-cloud cost intelligence platforms market industry.
Anodot Ltd. - Analyzes AI-driven cloud cost management, focusing on real-time anomaly detection and proactive spend forecasting to ensure financial control across complex cloud environments.
The industry research and growth report includes detailed analyses of the competitive landscape of the market and information about key companies, including:
- Anodot Ltd.
- Apptio Inc.
- CloudZero Inc.
- Datadog Inc.
- DoiT International
- Dynatrace Inc.
- Flexera Software LLC
- Harness Inc.
- Infracost Inc.
- Microsoft Corp.
- Morpheus Data
- Nsight
- Nutanix Inc.
- ProsperOps Inc.
- ServiceNow Inc.
- SoftwareOne AG
- Ternary Inc.
- Virtana
- VNTG Inc.
- Yotascale Inc.
Qualitative and quantitative analysis of companies has been conducted to help clients understand the wider business environment as well as the strengths and weaknesses of key industry players. Data is qualitatively analyzed to categorize companies as pure play, category-focused, industry-focused, and diversified; it is quantitatively analyzed to categorize companies as dominant, leading, strong, tentative, and weak.
Recent Developments in the Multi-Cloud Cost Intelligence Platforms Market
- In February 2025, Apptio Inc. released an updated suite of its financial management software that utilizes specialized large language models to provide natural language insights into cloud spend anomalies, allowing finance teams to query cost spikes without deep technical knowledge.
- In March 2025, Kubecost announced a strategic partnership with several major cloud providers to integrate standardized billing Application Programming Interfaces that specifically target the reduction of idle resource costs in managed Kubernetes environments.
- In April 2025, Flexera introduced a sustainability module within its cloud management platform that correlates energy consumption data from data center providers with the user's financial billing data, providing a comprehensive view of the cost-per-carbon-ton of cloud operations.
- In April 2025, the International Digital Governance Board introduced a new set of compliance mandates requiring all cloud management tools to provide localized data processing nodes to comply with regional data residency laws.
Research Analyst Overview: Multi-Cloud Cost Intelligence Platforms Market
The market's trajectory is defined by a pivot from reactive cost monitoring to predictive, AI-driven cost management. Boardroom decisions on technology investment now hinge on the ability to demonstrate a clear link between cloud expenditure and business value, a task demanding sophisticated unit economics analysis.
With North America representing the largest market share, the focus is on optimizing a mature but complex cloud footprint. A key operational reality is the necessity of multi-cloud governance to manage diverse services while adhering to security frameworks like the NIST Cybersecurity Framework.
The integration of infrastructure as code into CI/CD workflows is compelling a shift-left approach to cost, where cost forecasting is performed pre-deployment. This requires platforms capable of container-native cost visibility and automated rightsizing, transforming cost management into an engineering discipline.
This evolution is driven by the need for granular chargeback and showback mechanisms, making cloud cost management a strategic imperative rather than a mere accounting function.
Dive into Technavio’s robust research methodology, blending expert interviews, extensive data synthesis, and validated models for unparalleled Multi-Cloud Cost Intelligence Platforms Market insights. See full methodology.
| Market Scope | |
|---|---|
| Page number | 284 |
| Base year | 2025 |
| Historic period | 2020-2024 |
| Forecast period | 2026-2030 |
| Growth momentum & CAGR | Accelerate at a CAGR of 17.6% |
| Market growth 2026-2030 | USD 5069.2 million |
| Market structure | Fragmented |
| YoY growth 2025-2026(%) | 16.8% |
| Key countries | US, Canada, Mexico, Germany, UK, France, The Netherlands, Italy, Spain, China, India, Japan, South Korea, Australia, Indonesia, Saudi Arabia, UAE, South Africa, Israel, Turkey, Brazil, Argentina and Colombia |
| Competitive landscape | Leading Companies, Market Positioning of Companies, Competitive Strategies, and Industry Risks |
Multi-Cloud Cost Intelligence Platforms Market: Key Questions Answered in This Report
-
What is the expected growth of the Multi-Cloud Cost Intelligence Platforms Market between 2026 and 2030?
-
The Multi-Cloud Cost Intelligence Platforms Market is expected to grow by USD 5.07 billion during 2026-2030, registering a CAGR of 17.6%. Year-over-year growth in 2026 is estimated at 16.8%%. This acceleration is shaped by proliferation of multi-cloud architectures as a primary catalyst, which is intensifying demand across multiple end-use verticals covered in the report.
-
-
What segmentation does the market report cover?
-
The report is segmented by Deployment (Public cloud, Hybrid cloud, and Private cloud), End-user (Large enterprises, and Small and medium enterprises), Platform (Subscription-based, and Usage-based) and Geography (North America, Europe, APAC, Middle East and Africa, South America). Among these, the Public cloud segment is estimated to witness significant growth during the forecast period, driven by rising adoption across key application areas. Each segment includes detailed qualitative and quantitative analysis, along with historical data from 2020-2024 and forecasts through 2030 with year-over-year growth rates.
-
-
Which regions are analyzed in the report?
-
The report covers North America, Europe, APAC, Middle East and Africa and South America. North America is estimated to contribute 32.7% to market growth during the forecast period. Country-level analysis includes US, Canada, Mexico, Germany, UK, France, The Netherlands, Italy, Spain, China, India, Japan, South Korea, Australia, Indonesia, Saudi Arabia, UAE, South Africa, Israel, Turkey, Brazil, Argentina and Colombia, with dedicated market size tables and year-over-year growth for each.
-
-
What are the key growth drivers and market challenges?
-
The primary driver is proliferation of multi-cloud architectures as a primary catalyst, which is accelerating investment and industry demand. The main challenge is data fragmentation and absence of standardized billing metrics, creating operational barriers for key market participants. The report quantifies the impact of each driver and challenge across 2026 and 2030 with comparative analysis.
-
-
Who are the major players in the Multi-Cloud Cost Intelligence Platforms Market?
-
Key vendors include Anodot Ltd., Apptio Inc., CloudZero Inc., Datadog Inc., DoiT International, Dynatrace Inc., Flexera Software LLC, Harness Inc., Infracost Inc., Microsoft Corp., Morpheus Data, Nsight, Nutanix Inc., ProsperOps Inc., ServiceNow Inc., SoftwareOne AG, Ternary Inc., Virtana, VNTG Inc. and Yotascale Inc.. The report provides qualitative and quantitative analysis categorizing companies as dominant, leading, strong, tentative, and weak based on their market positioning. Company profiles include business segment analysis, SWOT assessment, key offerings, and recent strategic developments.
-
Multi-Cloud Cost Intelligence Platforms Market Research Insights
The dynamics of the market are shaped by the enterprise pursuit of fiscal discipline across a complex multi-provider landscape. The adoption of FinOps culture is a direct response to decentralized spending, making cloud financial accountability a core organizational tenet. This shift requires sophisticated tools for cloud cost allocation and cloud waste reduction.
An operational scenario involves a fintech company implementing a platform to manage shared resource cost allocation within its Kubernetes environments, ensuring adherence to its information security policies under the ISO/IEC 27001 standard. This proactive financial operations approach prevents budget overages and addresses the technical debt associated with shadow IT.
The market is also influenced by data residency laws, which impact infrastructure decisions and total cost of ownership calculations.
We can help! Our analysts can customize this multi-cloud cost intelligence platforms market research report to meet your requirements.
 RIA -
RIA - 
