
Hyperscalers Market Size 2025-2029
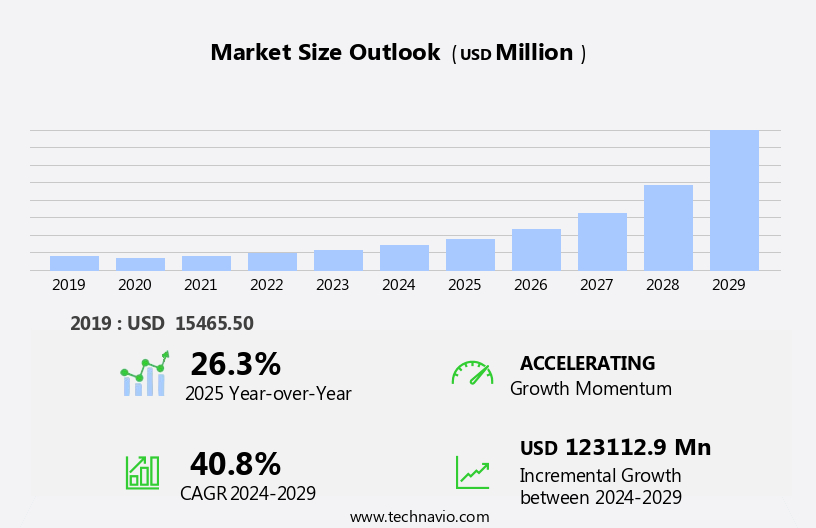
The hyperscalers market size is forecast to increase by USD 123.11 billion, at a CAGR of 40.8% between 2024 and 2029.
- The market is experiencing significant growth, driven primarily by escalating investments in data centers to support the increasing demand for cloud services. Market players are responding with strategic initiatives, such as expanding their infrastructure and enhancing their offerings to meet this demand. The cloud market is experiencing significant growth and innovation, driven by the increasing adoption of cloud technologies for digital transformation initiatives. However, the market is not without challenges. Security concerns for datacenters are emerging as a major obstacle, with the increasing threat of cyber attacks and data breaches. As the market continues to evolve, companies must prioritize robust security measures to mitigate these risks and protect their clients' data.
- Additionally, the competition is intensifying, necessitating continuous innovation and differentiation to maintain market share. Navigating these challenges and capitalizing on the growth opportunities requires a strategic approach and a focus on delivering secure, reliable, and innovative cloud solutions. Cloud automation, cloud migration services, and cloud management are becoming essential components of cloud infrastructure, enabling businesses to optimize their cloud usage and improve agility.
What will be the Size of the Hyperscalers Market during the forecast period?
- Cloud platforms are evolving to offer advanced compute solutions for cloud-native development, high-performance computing clusters, and serverless architectures. Cloud security threats continue to emerge, necessitating the development and implementation of robust cybersecurity solutions and network security measures. Cloud architectures are becoming more complex, with the integration of IoT platforms, edge computing solutions, and data center services.
- Cloud service providers are investing in cloud technology innovation to meet the demands of businesses, offering data analytics solutions, container orchestration, and cloud governance. Open source technologies are also playing a crucial role in the cloud ecosystem, providing flexibility and cost savings. Cloud adoption trends indicate that businesses are prioritizing cloud optimization, adhering to cloud compliance regulations, and implementing devops best practices. Cloud market analysis reveals that storage solutions and cloud solutions are among the most sought-after offerings, while cloud adoption strategies vary depending on industry and business size. Cloud technology continues to disrupt traditional IT infrastructure, with cloud-based applications and cloud services becoming the norm for businesses seeking to remain competitive.
- Cloud solutions are transforming industries, from finance to healthcare, and are expected to continue driving innovation and growth in the technology sector.
How is this Hyperscalers Industry segmented?
The hyperscalers industry research report provides comprehensive data (region-wise segment analysis), with forecasts and estimates in "USD million" for the period 2025-2029, as well as historical data from 2019-2023 for the following segments.
- Type
- Solution
- Service
- Business Segment
- Large enterprises
- SMEs
- End-user
- IT and telecom
- BFSI
- E-commerce and retail
- Media and entertainment
- Others
- Geography
- North America
- US
- Canada
- Europe
- France
- Germany
- UK
- APAC
- China
- India
- Japan
- South Korea
- South America
- Brazil
- Rest of World (ROW)
- North America
By Type Insights
The solution segment is estimated to witness significant growth during the forecast period. In today's business landscape, the cloud has become a necessity for enterprises as they transition their applications and workloads to this technology. Hyperscalers, companies that offer on-demand access to a shared pool of computing resources, play a pivotal role in this digital transformation. They provide various solutions, including infrastructure-as-a-service (IaaS), platform-as-a-service (PaaS), software-as-a-service (SaaS), and function-as-a-service. Enterprises leverage hyperscalers for their high-performance computing (HPC) needs, data warehousing, data science, and machine learning (ML) applications. Global enterprises also rely on these companies for agile development, disaster recovery, and business continuity. API management, cost optimization, and big data analytics are other areas where hyperscalers excel.
Major players in the market include AWS, Google, Microsoft, and Alibaba. These companies offer a range of services, from cloud computing and data centers to edge computing and serverless computing. They cater to the needs of large enterprises across industries, ensuring data sovereignty and security. Hybrid cloud solutions, such as Cloud Foundry and Kubernetes, enable organizations to maintain control over their applications while leveraging the benefits of the cloud. Open-source technologies and cloud-native architectures are also gaining popularity, contributing to the market's growth. Hyperscalers are not just technology providers; they are partners in the digital transformation journey of enterprises.
They help organizations optimize their resource management, improve capacity planning, and enhance their digital capabilities. Financial services, human resources, and software development are some of the sectors that significantly benefit from these services. The market is dynamic and evolving, driven by the increasing adoption of cloud technologies and the digital transformation initiatives of enterprises. Hyperscalers offer a wide range of services, from infrastructure and networking to ML and AI, enabling businesses to innovate and stay competitive.
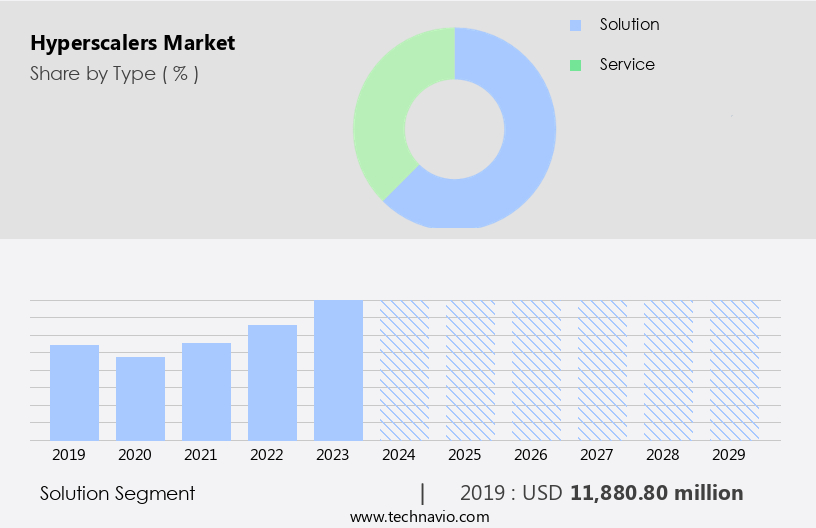
The Solution segment was valued at USD 11.88 billion in 2019 and showed a gradual increase during the forecast period.
Regional Analysis
North America is estimated to contribute 56% to the growth of the global market during the forecast period.Technavio's analysts have elaborately explained the regional trends and drivers that shape the market during the forecast period.
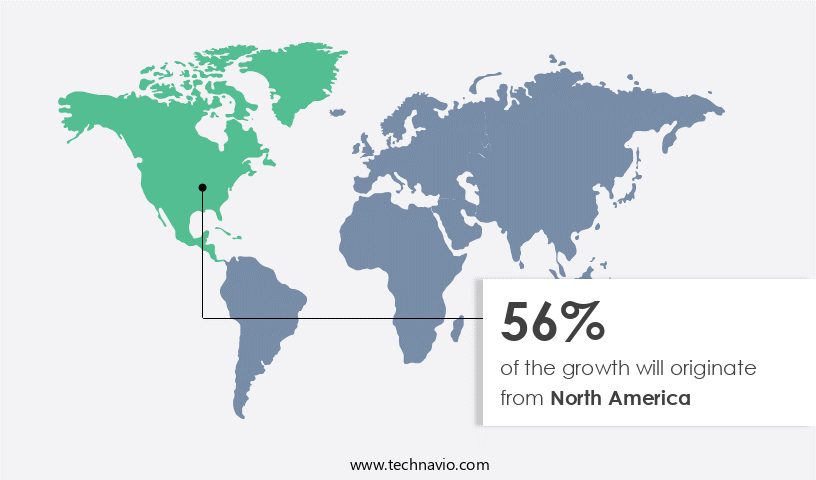
The market is witnessing significant growth, driven by the increasing adoption of enterprise applications, API management, data warehousing, data science, and high-performance computing (HPC) solutions by global enterprises. Cloud computing, including software-as-a-service (SaaS), platform-as-a-service (PaaS), and infrastructure-as-a-service (IaaS), is a major catalyst for this growth. In North America, the US leads with the highest market share, fueled by investments in data centers and the rise of agile development, disaster recovery, and business continuity solutions. The region's financial services sector is a significant contributor to this trend, prioritizing cost optimization, big data analytics, and machine learning (ML) for improved resource management and digital transformation.
Cloud migration and open-source technologies are also playing crucial roles in the market's expansion. Tencent Cloud and Alibaba Cloud are notable players in the Asia Pacific region, while Google Cloud and Microsoft Azure are major competitors in North America. The market is further evolving with the emergence of hybrid cloud, cloud foundry, serverless computing, and edge computing. Artificial intelligence (AI) and human resources (HR) applications are also gaining traction, emphasizing the importance of data sovereignty and security. Capacity planning and infrastructure management are essential considerations for enterprises adopting these advanced technologies. Overall, the market is an ever-evolving landscape, driven by the needs of large enterprises and the ongoing digital transformation across industries.
Market Dynamics
Our researchers analyzed the data with 2024 as the base year, along with the key drivers, trends, and challenges. A holistic analysis of drivers will help companies refine their marketing strategies to gain a competitive advantage.
What are the Hyperscalers market drivers leading to the rise in the adoption of Industry?
- The significant expansion of investments in data centers serves as the primary catalyst for market growth. Hyperscale data centers are large-scale facilities owned and operated by enterprises to provide a scalable and high-performance computing (HPC) infrastructure. These data centers consist of numerous small servers, or nodes, which can be integrated with an enterprise's existing architecture. By increasing the number of nodes as demand grows, enterprises can reduce initial data center operating costs. Key technologies in hyperscale data centers include enterprise applications, API management, data warehousing, data science, agile development, cloud computing, high-performance computing, and disaster recovery. Major providers of hyperscale servers for data centers include Amazon.Com Inc., Microsoft Corp, Google, and IBM. Enterprises leverage hyperscale data centers for various use cases, such as running mission-critical applications, handling large volumes of data, and ensuring business continuity through disaster recovery solutions.
- Hyperscale data centers enable organizations to be more agile and responsive to changing business requirements. Hyperscale data centers have gained significant importance among global enterprises due to their ability to offer cost savings, improved efficiency, and enhanced performance. The integration of cloud computing and advanced technologies like AI and machine learning further enhances the capabilities of hyperscale data centers, making them a strategic investment for businesses seeking to stay competitive in today's digital landscape.
What are the Hyperscalers market trends shaping the Industry?
- Market trends indicate a focus on strategic initiatives by market players. This emerging trend underscores the importance of well-planned and executed business strategies in today's competitive marketplace. Cloud computing has emerged as the preferred operating model for businesses seeking cost savings and agility in their operations. As enterprises embark on their digital transformation journeys, choosing the right cloud service provider becomes a critical decision. Hyperscalers, such as Tencent Cloud and Alibaba Cloud, offer unique strengths, including advanced capabilities in big data analytics, machine learning, and AI. Google, Microsoft Corp., AWS, and Microsoft Azure are currently leading The market from an Infrastructure-as-a-Service (IaaS) and Platform-as-a-Service (PaaS) perspective. These companies provide various offerings, including serverless functions, hybrid cloud solutions, and Software-as-a-Service (SaaS) platforms like Cloud Foundry.
- Cost optimization is a significant factor driving the adoption of hyperscalers. Their economies of scale enable them to offer competitive pricing, making cloud services more accessible to businesses of all sizes. Additionally, hyperscalers continuously invest in research and development, ensuring their offerings remain cutting-edge and aligned with the latest market trends. The market is dynamic and competitive, with each provider offering unique strengths to cater to the diverse needs of enterprises. Carefully evaluating the offerings and capabilities of each provider is essential to make an informed decision that best fits your business requirements.
How does Hyperscalers market faces challenges face during its growth?
- The growth of the industry is significantly impacted by the complex security challenges associated with datacenters. Hyperscale data centers have become essential infrastructure for large enterprises undergoing cloud migration and implementing cloud-native solutions. Open source technologies and artificial intelligence (AI) are driving innovation in software development and edge computing. However, security remains a significant concern, with data breaches and cyber-attacks costing enterprises an average of USD3.86 million globally and USD7.9 million in the US. To mitigate these risks, businesses prioritize data sovereignty and invest in robust security systems. Geographical location is a crucial factor, as data centers in secure regions offer physical security, biometric identification, and regulatory compliance. Moreover, resource management and business continuity plans are essential for maintaining optimal performance and minimizing downtime.
- By addressing these challenges, hyperscale data centers will continue to play a vital role in enabling digital transformation for businesses. The recent research indicates that the hyperscale data center market is experiencing significant growth, with enterprises increasingly relying on these facilities for their cloud infrastructure needs. Security, data sovereignty, resource management, and business continuity are essential considerations for businesses seeking to optimize their hyperscale data center investments.
Exclusive Customer Landscape
The hyperscalers market forecasting report includes the adoption lifecycle of the market, covering from the innovator's stage to the laggard's stage. It focuses on adoption rates in different regions based on penetration. Furthermore, the hyperscalers market report also includes key purchase criteria and drivers of price sensitivity to help companies evaluate and develop their market growth analysis strategies.
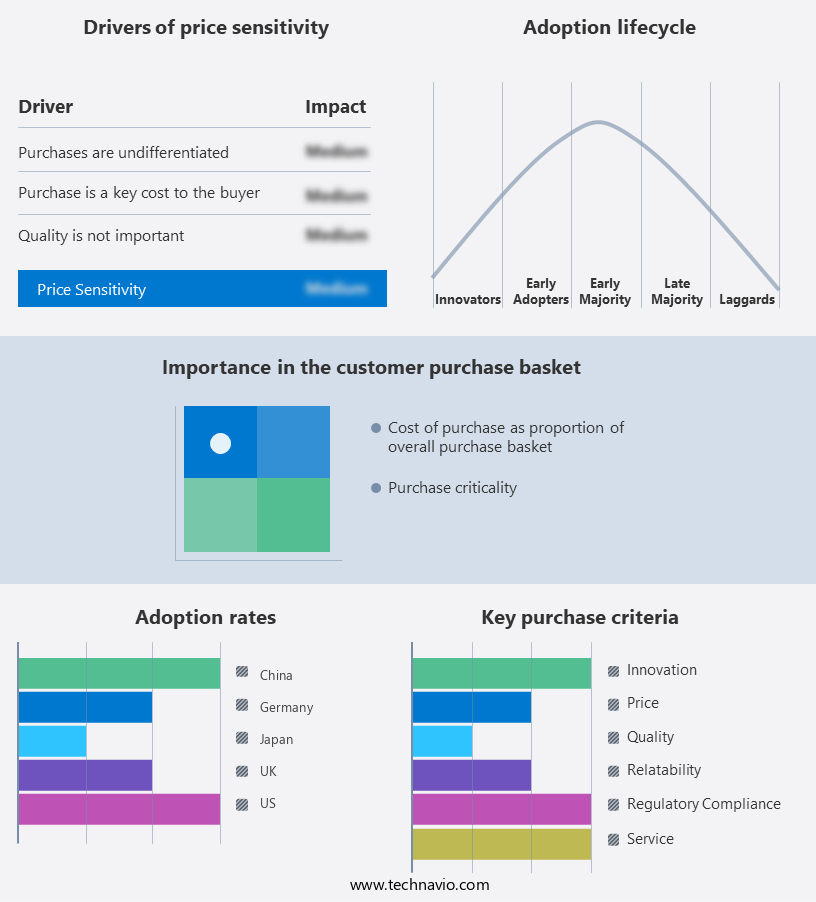
Customer Landscape
Key Companies & Market Insights
Companies are implementing various strategies, such as strategic alliances, hyperscalers market forecast, partnerships, mergers and acquisitions, geographical expansion, and product/service launches, to enhance their presence in the industry.
Alphabet Inc. - This company specializes in providing advanced technology solutions for hyperscalers, encompassing distributed systems, storage, databases, analytics, operating systems, networking, cluster computing, machine learning, and video acceleration.
The industry research and growth report includes detailed analyses of the competitive landscape of the market and information about key companies, including:
- Alphabet Inc.
- Amazon.com Inc.
- Broadcom Inc.
- Cisco Systems Inc.
- Dell Technologies Inc.
- Hewlett Packard Enterprise Co.
- Hyper Scalers Pty Ltd.
- Intel Corp.
- International Business Machines Corp.
- Kamatera Inc.
- Lenovo Group Ltd.
- Microsoft Corp.
- NVIDIA Corp.
- Oracle Corp.
- Quanta Computer Inc.
- Rackspace Technology Inc.
- SAP SE
- Telefonaktiebolaget LM Ericsson
- Verizon Communications Inc.
- VMware Inc.
Qualitative and quantitative analysis of companies has been conducted to help clients understand the wider business environment as well as the strengths and weaknesses of key industry players. Data is qualitatively analyzed to categorize companies as pure play, category-focused, industry-focused, and diversified; it is quantitatively analyzed to categorize companies as dominant, leading, strong, tentative, and weak.
Recent Development and News in Hyperscalers Market
- In February 2023, Amazon Web Services (AWS) announced the launch of its new Graviton3 processors, which offer up to 40% better performance and 25% improved power efficiency compared to the previous generation (Amazon Web Services Press Release, 2023). This significant technological advancement underscores AWS's commitment to delivering high-performance and energy-efficient cloud services.
- In July 2024, Microsoft Azure entered into a strategic partnership with IBM to expand its hybrid cloud offerings, allowing customers to run Azure workloads on IBM's public cloud and on-premises solutions (Microsoft News Center, 2024). This collaboration aims to cater to the growing demand for hybrid cloud solutions, providing businesses with greater flexibility and choice.
- In October 2024, Google Cloud Platform secured a major deal with the U.S. Department of Defense, winning a contract worth over USD1 billion to provide cloud services for the Pentagon's Joint Warfighting Cloud Capability project (Google Cloud Press Release, 2024). This significant government initiative marks a significant milestone for Google Cloud in the public sector and underscores its growing presence in the market.
- In March 2025, Alibaba Cloud, the cloud computing arm of Alibaba Group, raised over USD10 billion in its latest funding round, bringing its total valuation to over USD300 billion (Alibaba Group Investor Relations, 2025). This substantial investment will enable Alibaba Cloud to expand its global footprint, invest in research and development, and strengthen its competitive position in the market.
Research Analyst Overview
The market continues to evolve, with Tencent Cloud and Alibaba Cloud leading the charge in providing enterprise applications with advanced solutions. Cost optimization remains a key focus, as big data analytics and high-performance computing (HPC) become increasingly essential for global enterprises. Hybrid cloud solutions, such as Cloud Foundry and Platform-as-a-Service (PaaS), enable seamless integration of Software-as-a-Service (SaaS), Machine Learning (ML), and Platform-as-a-Service offerings. Cloud native technologies, including serverless functions and containerization, are transforming software development and deployment. Agile development and DevOps practices are driving the adoption of cloud computing, which is also being utilized for disaster recovery and business continuity.
Resource management and capacity planning are critical components of cloud adoption for large enterprises. Data sovereignty and security concerns are leading to the growth of edge computing and infrastructure-as-a-service (IaaS) offerings. Open source technologies are also playing a significant role in cloud migration and innovation. The financial services sector is a major adopter of cloud technologies, with applications ranging from API management to data warehousing and artificial intelligence (AI). Digital transformation is a continuous process, with cloud adoption and innovation shaping the future of enterprise applications. Capacity planning and optimization are ongoing priorities, as enterprises seek to maximize the value of their cloud investments.
Google Cloud and other hyperscalers are also making strides in the market, offering a range of solutions for human resources (HR), high-performance computing, and more.
Dive into Technavio's strong research methodology, blending expert interviews, extensive data synthesis, and validated models for unparalleled Hyperscalers Market insights. See full methodology.
|
Market Scope |
|
|
Report Coverage |
Details |
|
Page number |
218 |
|
Base year |
2024 |
|
Historic period |
2019-2023 |
|
Forecast period |
2025-2029 |
|
Growth momentum & CAGR |
Accelerate at a CAGR of 40.8% |
|
Market growth 2025-2029 |
USD 123.11 billion |
|
Market structure |
Fragmented |
|
YoY growth 2024-2025(%) |
26.3 |
|
Key countries |
US, China, Germany, Canada, Japan, UK, India, France, Brazil, and South Korea |
|
Competitive landscape |
Leading Companies, Market Positioning of Companies, Competitive Strategies, and Industry Risks |
What are the Key Data Covered in this Hyperscalers Market Research and Growth Report?
- CAGR of the Hyperscalers industry during the forecast period
- Detailed information on factors that will drive the growth and forecasting between 2025 and 2029
- Precise estimation of the size of the market and its contribution of the industry in focus to the parent market
- Accurate predictions about upcoming growth and trends and changes in consumer behaviour
- Growth of the market across North America, Europe, APAC, South America, and Middle East and Africa
- Thorough analysis of the market's competitive landscape and detailed information about companies
- Comprehensive analysis of factors that will challenge the hyperscalers market growth of industry companies
We can help! Our analysts can customize this hyperscalers market research report to meet your requirements.
 RIA -
RIA - 
