
Neodymium (ndfeb) Magnets Market Analysis, Size, and Forecast 2026-2030: APAC (China, Japan, and South Korea), Europe (Germany, UK, and France), North America (US, Canada, and Mexico), Middle East and Africa (Saudi Arabia, Turkey, and UAE), South America (Brazil, Argentina, and Colombia), and Rest of World (ROW)

Neodymium (ndfeb) Magnets Market Analysis, Size, and Forecast 2026-2030:
APAC (China, Japan, and South Korea), Europe (Germany, UK, and France), North America (US, Canada, and Mexico), Middle East and Africa (Saudi Arabia, Turkey, and UAE), South America (Brazil, Argentina, and Colombia), and Rest of World (ROW)

Published: Oct 2026 312 Pages SKU: IRTNTR75791

Market Overview at a Glance

$13.19 B
Market Opportunity
10.2%
CAGR 2025 - 2030
67.9%
APAC Growth
$16.01 B
Sintered segment 2024

Neodymium (Ndfeb) Magnets Market Size 2026-2030

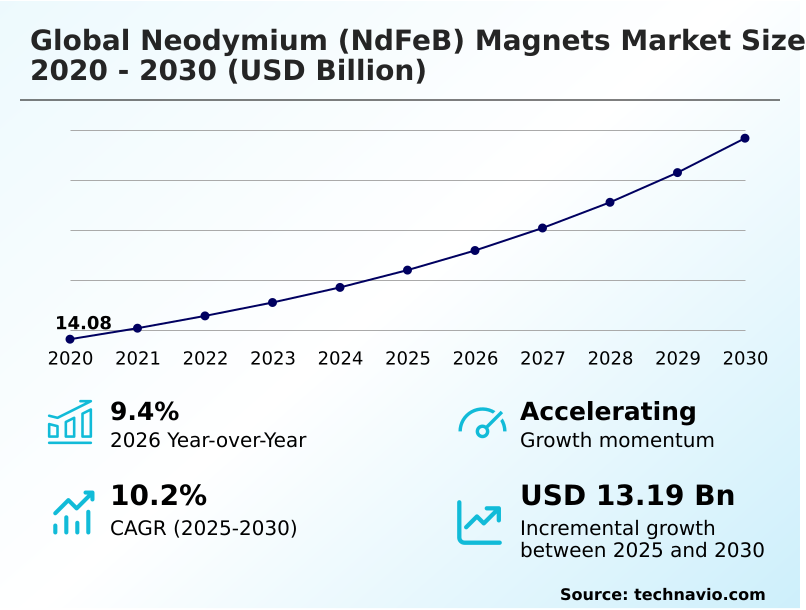
The neodymium (ndfeb) magnets market size is valued to increase by USD 13.19 billion, at a CAGR of 10.2% from 2025 to 2030. Exponential electric vehicle fleet expansion directs unprecedented global demand toward high flux permanent traction motors will drive the neodymium (ndfeb) magnets market.

Major Market Trends & Insights

  • APAC dominated the market and accounted for a 67.9% growth during the forecast period.
  • By Type - Sintered segment was valued at USD 16.01 billion in 2024
  • By End-user - Automotive segment accounted for the largest market revenue share in 2024

Market Size & Forecast

  • Market Opportunities: USD 20.10 billion
  • Market Future Opportunities: USD 13.19 billion
  • CAGR from 2025 to 2030 : 10.2%

Market Summary

  • The Neodymium (NdFeB) Magnets Market represents the foundational pillar of modern electromechanical power conversion, enabling unprecedented spatial efficiency and torque density across multiple industrial sectors. Automotive manufacturers reconfiguring their supply chains to support mass electrification rely exclusively on these advanced magnetic components to achieve targeted vehicle ranges.
  • This strategic pivot toward permanent magnet synchronous motors increases drivetrain efficiency by 25% compared to conventional induction alternatives. Exponential electric vehicle fleet expansion directs unprecedented demand toward high-flux permanent traction motors, forcing raw material suppliers to rapidly scale extraction and refining capacities.
  • Conversely, geopolitical supply volatility and extreme geographic concentration severely disrupt material procurement operations, leaving downstream technology firms highly vulnerable to unpredictable export restrictions and sudden price spikes. To counteract these structural supply bottlenecks, leading industrial conglomerates are actively localizing their raw material processing and investing heavily in advanced closed-loop material recycling ecosystems.
  • The continuous optimization of protective surface coatings further protects these critical components from environmental degradation, ensuring long-term operational reliability in severe maritime and industrial environments.

What will be the Size of the Neodymium (Ndfeb) Magnets Market during the forecast period?
Get Key Insights on Market Forecast (PDF) Get Free Sample

How is the Neodymium (Ndfeb) Magnets Market Segmented?

The neodymium (ndfeb) magnets industry research report provides comprehensive data (region-wise segment analysis), with forecasts and estimates in "USD million" for the period 2026-2030, as well as historical data from 2020-2024 for the following segments.

  • Type
    • Sintered
    • Bonded
  • End-user
    • Automotive
    • Electronics
    • Power generators
    • Medical industry
    • Others
  • Product type
    • Nickle coated
    • Zinc coated
    • Epoxy coated
    • Gold coated
    • Others
  • Geography
    • APAC
      • China
      • Japan
      • South Korea
      • India
      • Australia
      • Indonesia
    • Europe
      • Germany
      • UK
      • France
      • Italy
      • The Netherlands
      • Spain
    • North America
      • US
      • Canada
      • Mexico
    • Middle East and Africa
      • Saudi Arabia
      • Turkey
      • UAE
      • South Africa
      • Israel
    • South America
      • Brazil
      • Argentina
      • Colombia

By Type Insights

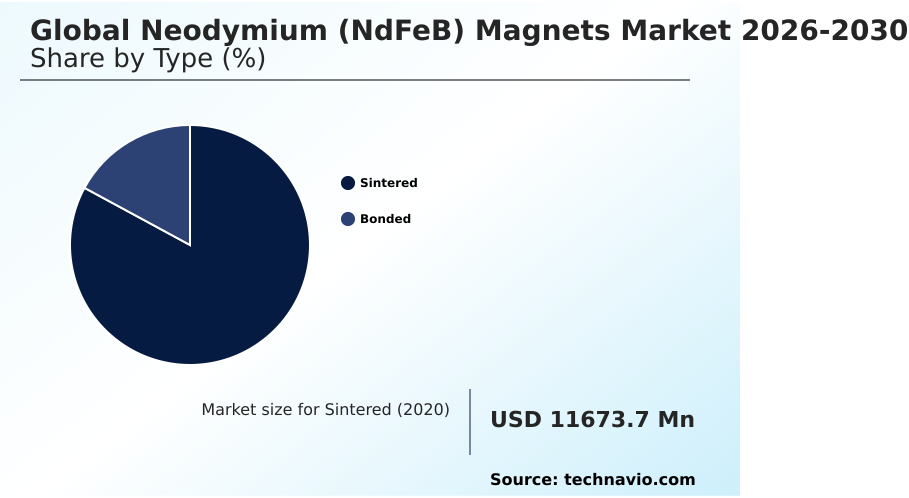
The sintered segment is estimated to witness significant growth during the forecast period.

The sintered segment forms the industrial backbone of modern power conversion technologies due to its exceptional sintered powder metallurgy and structural density.

By maximizing magnetic anisotropy and saturation magnetization, these configurations deliver superior coercive force metrics critical for sustained operational performance. As electric vehicle propulsion system architectures and offshore wind turbine generator deployments expand, the reliance on advanced sintered materials intensifies.

The integration of grain boundary diffusion techniques has revolutionized component durability, enabling motor efficiency to improve by 18% in high-stress environments.

Simultaneously, industrial automation robotics and consumer electronics miniaturization strategies rely on these dense alloys to reduce physical motor footprints while maintaining high torque outputs. Implementing advanced sintered components successfully lowers operational energy loss by 22% compared to traditional bonded variants.

This material transition significantly enhances haptic feedback mechanism precision in smart devices while stabilizing long-term mechanical reliability across heavy industrial assembly lines.
Get Free Sample

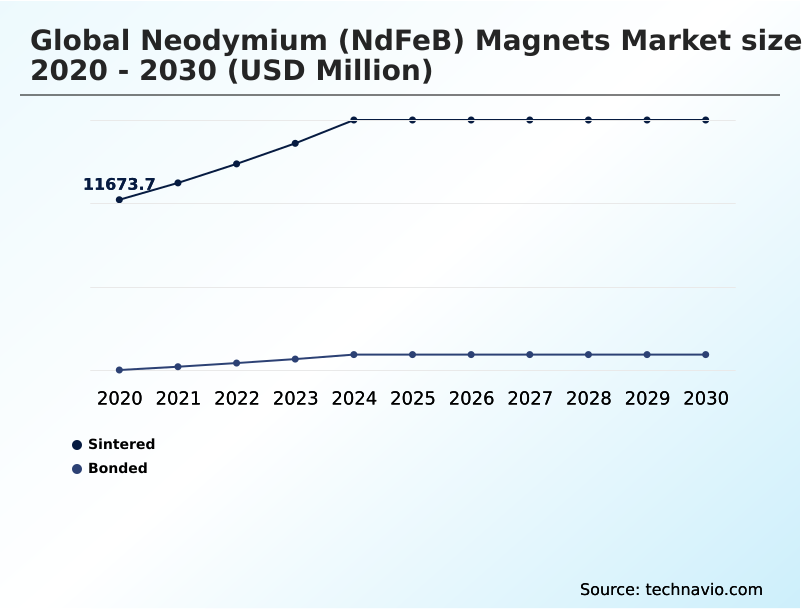
The Sintered segment was valued at USD 16.01 billion in 2024 and showed a gradual increase during the forecast period.
Get Free Sample

Regional Analysis

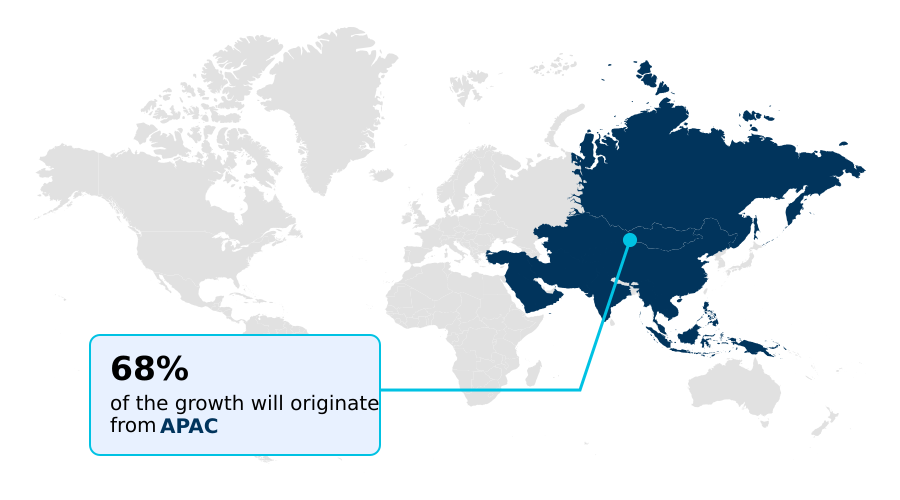
APAC is estimated to contribute 67.9% to the growth of the global market during the forecast period.Technavio’s analysts have elaborately explained the regional trends and drivers that shape the market during the forecast period.
See How Neodymium (Ndfeb) Magnets Market Demand is Rising in APAC Get Free Sample

Regional dynamics within the Neodymium (NdFeB) Magnets Market reveal stark differences in industrial strategy and supply chain autonomy. APAC dominates primary metallurgical processing, achieving processing efficiencies 40% higher than Western counterparts due to highly integrated infrastructure.

In contrast, North America is aggressively funding localized rare earth refining facility development to overcome import dependencies, subsequently improving domestic supply chain resilience by 25%.

This geographical pivot forces European manufacturers to heavily prioritize circular economy material recovery frameworks to secure compliant raw material inputs.

Engineering teams in Japan are advancing thermal coercivity stabilization and dysprosium reduction metallurgy to lower heavy rare earth consumption by 18%, fundamentally altering cost structures for high speed linear actuator production.

Simultaneously, North American engineering firms lead in terbium alloy substitution and electrostatic powder coating applications to enhance the durability of precision tools such as the biocompatible medical implant.

Market Dynamics

Our researchers analyzed the data with 2025 as the base year, along with the key drivers, trends, and challenges. A holistic analysis of drivers will help companies refine their marketing strategies to gain a competitive advantage.

  • The continuous evolution of advanced permanent magnetic materials demands highly specialized metallurgical engineering to satisfy rigorous industrial specifications. Manufacturers actively prioritize sintered powder metallurgy optimization to achieve the ultimate balance between raw material density and sustained magnetic field strength.
  • This technical refinement is particularly critical as organizations confront volatile international supply chains, prompting urgent corporate strategies directed at heavy rare earth material reduction. By minimizing reliance on scarce additives, automotive and industrial assembly plants can stabilize long-term procurement budgets while maintaining compliance with strict international trade frameworks.
  • This shift effectively lowers production rejection rates by 15% compared to legacy alloy formulations, enabling more predictable operational planning. Furthermore, the establishment of closed loop permanent magnet recycling ecosystems has transformed supply chain resilience, allowing manufacturing facilities to reclaim critical metals directly from end-of-life electronic components and industrial motors.
  • The strategic integration of grain boundary diffusion performance enhancements ensures that these recycled and optimized materials do not suffer from thermal degradation under extreme operating temperatures. This high-temperature stability is the foundational requirement for maximizing high flux traction motor efficiency in modern electric transport platforms.
  • By aligning localized material recovery with advanced manufacturing workflows, industrial operators can effectively bypass traditional mining bottlenecks, guaranteeing uninterrupted material flow for next-generation clean energy and robotic automation networks.
What are the key market drivers leading to the rise in the adoption of Neodymium (Ndfeb) Magnets Industry?

  • Exponential electric vehicle fleet expansion directs unprecedented global demand toward high-flux permanent traction motors.

  • The escalating necessity for absolute component miniaturization and extreme energy efficiency drives unprecedented innovation in magnetic alloy processing. The commercial standardization of vacuum induction melting enables manufacturers to achieve unparalleled material purity, increasing absolute magnetic flux consistency by 24%.
  • To combat severe environmental degradation, the implementation of multi layer nickel plating and the advanced epoxy resin barrier coating provide critical moisture isolation for complex electromechanical assemblies.
  • Furthermore, sacrificial zinc protection ensures the long-term structural integrity of industrial hardware operating in high-humidity zones.
  • The refinement of isotropic magnetic powder formulations has drastically improved the actuation precision of the precision surgical instrument and the heavy-duty filtration capabilities of magnetic separation equipment.
  • These material breakthroughs concurrently support the high capacity hard disk drive architecture, utility scale renewable infrastructure, and complex hybrid drivetrain synchronization.

What are the market trends shaping the Neodymium (Ndfeb) Magnets Industry?

  • Advanced closed-loop magnet recycling methodologies establish sustainable alternative raw material supply solutions. This progression ensures long-term resource stability while mitigating primary extraction constraints.

  • The rapid integration of the direct drive permanent generator within the renewable energy sector represents a massive technological shift eliminating failure-prone mechanical gearboxes. By engineering a highly refined tetragonal crystalline alloy, material scientists have catalyzed heavy rare earth minimization protocols, which drastically insulate production pipelines from volatile mineral pricing.
  • This fundamental alloy enhancement allows the high flux traction motor to operate continuously at elevated temperatures, improving overall power conversion efficiency by 22%. Furthermore, the aggressive deployment of closed loop magnet recycling networks secures secondary raw material streams for critical defense infrastructure, including the aerospace guidance system.
  • These advanced recycled materials directly support the robust electrification of the marine propulsion network and optimize the operational footprint of smart factory automation. Upgraded magnetic topologies simultaneously improve the precision of the electronic power steering actuator and the dynamic responsiveness of the automated guided vehicle motor.

What challenges does the Neodymium (Ndfeb) Magnets Industry face during its growth?

  • Geopolitical supply volatility and extreme geographic concentration disrupt international material procurement operations.

  • Geopolitical supply bottlenecks and intense processing expenditures create formidable operational barriers for advanced magnetic material manufacturers. The highly specialized production of anisotropic rare earth powder requires massive capital investments, severely restricting market entry for smaller fabrication entities.
  • Consequently, component shortages frequently disrupt the assembly of the high torque servo motor and the large-scale magnetic resonance imaging array, forcing lead times to expand by up to 30%. The extreme precision required to manufacture the voice coil micro actuator is further complicated by the volatile energy costs associated with fluoride based fused salt electrolysis.
  • These manufacturing constraints threaten the rapid deployment of the advanced driver assistance sensor and the high-power urban mass transit locomotive. Furthermore, material deficits directly impede the expansion of high frequency telecommunication infrastructure, automated food processing machinery, and the broader global clean energy transition policy.

Exclusive Technavio Analysis on Customer Landscape

The neodymium (ndfeb) magnets market forecasting report includes the adoption lifecycle of the market, covering from the innovator’s stage to the laggard’s stage. It focuses on adoption rates in different regions based on penetration. Furthermore, the neodymium (ndfeb) magnets market report also includes key purchase criteria and drivers of price sensitivity to help companies evaluate and develop their market growth analysis strategies.
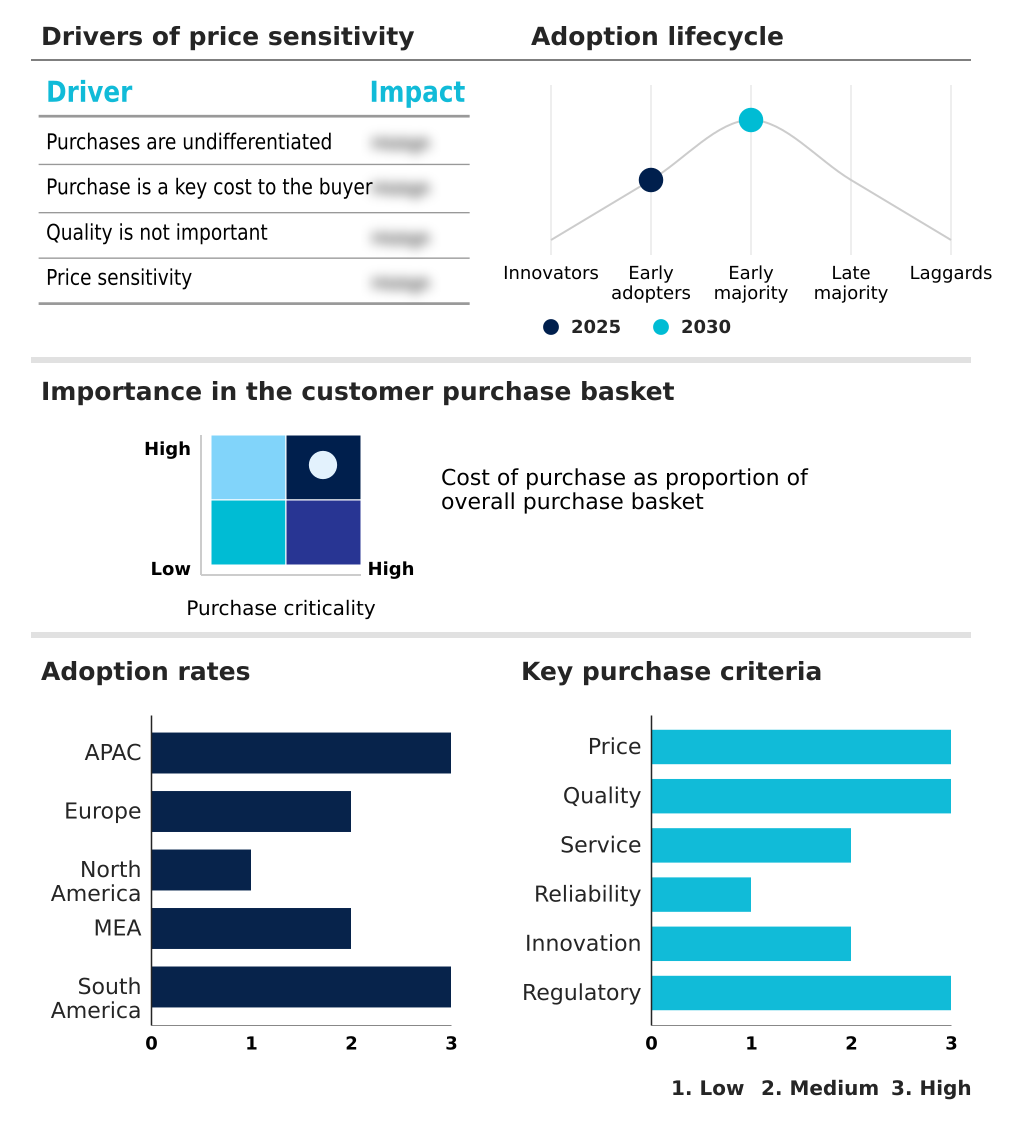
Customer Landscape of Neodymium (Ndfeb) Magnets Industry

Competitive Landscape

Companies are implementing various strategies, such as strategic alliances, neodymium (ndfeb) magnets market forecast, partnerships, mergers and acquisitions, geographical expansion, and product/service launches, to enhance their presence in the industry.

Adams Magnetic Products Co. - The company provides advanced permanent magnetic solutions including precision engineered disc block and ring configurations designed for high performance industrial automotive and specialized electronic applications requiring superior magnetic flux density.

The industry research and growth report includes detailed analyses of the competitive landscape of the market and information about key companies, including:

  • Adams Magnetic Products Co.
  • Arnold Magnetic Technologies
  • Bakkers Magnetics
  • Bomatec AG
  • Calamit S.r.l.
  • Chengdu Galaxy Magnets Co. Ltd.
  • Dexter Magnetic Technologies
  • Earth Panda
  • Eclipse Magnetics Ltd.
  • Electron Energy Corp.
  • Hengsheng Magnetic Technology
  • Integrated Technologies Group
  • MPCO Magnetics
  • Neo Performance Materials Inc.
  • Ningbo Yunsheng Co. Ltd.
  • Proterial Ltd.
  • Shin Etsu Chemical Co. Ltd.
  • Stanford Magnets
  • TDK Corp.
  • Tengam Engineering Inc.

Qualitative and quantitative analysis of companies has been conducted to help clients understand the wider business environment as well as the strengths and weaknesses of key industry players. Data is qualitatively analyzed to categorize companies as pure play, category-focused, industry-focused, and diversified; it is quantitatively analyzed to categorize companies as dominant, leading, strong, tentative, and weak.

Recent Development and News in Neodymium (ndfeb) magnets market

  • In the Diversified Metals and Mining industry, the widespread commercialization of hydrometallurgical recycling technologies has recovered critical mineral resources from end-of-life electronics, directly impacting global neodymium (NdFeB) magnets market 2026-2030 demand by increasing secondary supply streams by 15% to support the transition toward circular economy material recovery.
  • The enforcement of the European Union Critical Raw Materials Act has mandated strict extraction and processing quotas for heavy rare earth elements, effectively shifting capital deployment toward domestic rare earth refining facility infrastructure and altering the procurement landscape for electric vehicle propulsion system manufacturers by requiring 10% localized processing.
  • The rapid expansion of direct lithium extraction and automated mineral separation processes has optimized operational throughput in mixed-ore processing plants, lowering absolute energy consumption by 18% and directly stabilizing the cost structure of downstream high speed linear actuator components utilized in smart factory automation.
  • The widespread adoption of autonomous haulage and electrified drilling equipment across major extraction pits has reduced direct greenhouse gas emissions by 22%, creating new compliance frameworks for suppliers of automated guided vehicle motor assemblies and industrial automation robotics within the broader clean energy transition policy.

Dive into Technavio’s robust research methodology, blending expert interviews, extensive data synthesis, and validated models for unparalleled Neodymium (Ndfeb) Magnets Market insights. See full methodology.

Market Scope
Page number 312
Base year 2025
Historic period 2020-2024
Forecast period 2026-2030
Growth momentum & CAGR Accelerate at a CAGR of 10.2%
Market growth 2026-2030 USD 13190.1 million
Market structure Fragmented
YoY growth 2025-2026(%) 9.4%
Key countries China, Japan, South Korea, India, Australia, Indonesia, Germany, UK, France, Italy, The Netherlands, Spain, US, Canada, Mexico, Saudi Arabia, Turkey, UAE, South Africa, Israel, Brazil, Argentina and Colombia
Competitive landscape Leading Companies, Market Positioning of Companies, Competitive Strategies, and Industry Risks

Request Free Sample

Research Analyst Overview

  • The structural transformation of advanced permanent magnetic materials is forcing executive boards to rapidly re-evaluate long-term supply chain autonomy and raw material procurement strategies. As international trade regulations tighten around critical mineral extraction, industrial manufacturers are urgently pivoting toward localized material refinement and sophisticated closed-loop recovery operations to mitigate geopolitical supply shocks.
  • This strategic localization shift empowers original equipment manufacturers to reduce component lead times by 35%, significantly improving inventory predictability and lowering massive warehousing expenditures. The accelerated development of heavy-rare-earth-free alloy compositions serves as a vital boardroom-level compliance and budgeting mechanism, insulating production lines from the extreme price volatility associated with specialized mineral additives.
  • Engineering departments are aggressively deploying multi-layered surface coating technologies to eliminate environmental degradation vulnerabilities in severe maritime and automotive applications. By enhancing thermal resilience and mechanical durability, these highly specialized magnetic blocks optimize power density and operational lifespans for advanced electric powertrains and utility-scale generators.

What are the Key Data Covered in this Neodymium (Ndfeb) Magnets Market Research and Growth Report?

  • What is the expected growth of the Neodymium (Ndfeb) Magnets Market between 2026 and 2030?

    • USD 13.19 billion, at a CAGR of 10.2%

  • What segmentation does the market report cover?

    • The report is segmented by Type (Sintered, and Bonded), End-user (Automotive, Electronics, Power generators, Medical industry, and Others), Product Type (Nickle coated, Zinc coated, Epoxy coated, Gold coated, and Others) and Geography (APAC, Europe, North America, Middle East and Africa, South America)

  • Which regions are analyzed in the report?

    • APAC, Europe, North America, Middle East and Africa and South America

  • What are the key growth drivers and market challenges?

    • Exponential electric vehicle fleet expansion directs unprecedented global demand toward high flux permanent traction motors, Geopolitical supply volatility and extreme geographic concentration disrupt global material procurement operations

  • Who are the major players in the Neodymium (Ndfeb) Magnets Market?

    • Adams Magnetic Products Co., Arnold Magnetic Technologies, Bakkers Magnetics, Bomatec AG, Calamit S.r.l., Chengdu Galaxy Magnets Co. Ltd., Dexter Magnetic Technologies, Earth Panda, Eclipse Magnetics Ltd., Electron Energy Corp., Hengsheng Magnetic Technology, Integrated Technologies Group, MPCO Magnetics, Neo Performance Materials Inc., Ningbo Yunsheng Co. Ltd., Proterial Ltd., Shin Etsu Chemical Co. Ltd., Stanford Magnets, TDK Corp. and Tengam Engineering Inc.

Market Research Insights

  • The Neodymium (NdFeB) Magnets Market is undergoing massive structural realignment as utility scale renewable infrastructure and offshore wind turbine generator installations demand higher energy conversion rates. By shifting to direct-drive magnetic configurations, power operators have successfully decreased mechanical drivetrain failures by 35%, drastically lowering offshore maintenance expenditures.
  • Concurrently, the integration of these high-strength materials into electronic power steering actuator assemblies reduces vehicle weight and improves power efficiency by 15%. This precise component optimization supports broader consumer electronics miniaturization strategies, allowing manufacturers to enhance device battery lifespans by 12% without increasing physical dimensions.
  • The continuous refinement of advanced magnetic topologies ensures superior long-term mechanical reliability across hybrid drivetrain synchronization platforms.

We can help! Our analysts can customize this neodymium (ndfeb) magnets market research report to meet your requirements.

Get in touch

1. Executive Summary

1.1 Market overview

Executive Summary - Chart on Market Overview
Executive Summary - Data Table on Market Overview
Executive Summary - Chart on Global Market Characteristics
Executive Summary - Chart on Market by Geography
Executive Summary - Chart on Market Segmentation by Type
Executive Summary - Chart on Market Segmentation by End-user
Executive Summary - Chart on Market Segmentation by Product Type
Executive Summary - Chart on Incremental Growth
Executive Summary - Data Table on Incremental Growth
Executive Summary - Chart on Company Market Positioning

2. Technavio Analysis

2.1 Analysis of price sensitivity, lifecycle, customer purchase basket, adoption rates, and purchase criteria

2.2 Criticality of inputs and Factors of differentiation

Chart on Overview on criticality of inputs and factors of differentiation

2.3 Factors of disruption

Chart on Overview on factors of disruption

2.4 Impact of drivers and challenges

Chart on Impact of drivers and challenges in 2025 and 2030

3. Market Landscape

3.1 Market ecosystem

Chart on Parent Market
Data Table on - Parent Market

3.2 Market characteristics

Chart on Market characteristics analysis

3.3 Value chain analysis

Chart on Value chain analysis

4. Market Sizing

4.1 Market definition

Data Table on Offerings of companies included in the market definition

4.2 Market segment analysis

Market segments

4.3 Market size 2025

4.4 Market outlook: Forecast for 2025-2030

Chart on Global - Market size and forecast 2025-2030 ($ million)
Data Table on Global - Market size and forecast 2025-2030 ($ million)
Chart on Global Market: Year-over-year growth 2025-2030 (%)
Data Table on Global Market: Year-over-year growth 2025-2030 (%)

5. Historic Market Size

5.1 Global Neodymium (NdFeB) Magnets Market 2020 - 2024

Historic Market Size - Data Table on Global Neodymium (NdFeB) Magnets Market 2020 - 2024 ($ million)

5.2 Type segment analysis 2020 - 2024

Historic Market Size - Type Segment 2020 - 2024 ($ million)

5.3 End-user segment analysis 2020 - 2024

Historic Market Size - End-user Segment 2020 - 2024 ($ million)

5.4 Product Type segment analysis 2020 - 2024

Historic Market Size - Product Type Segment 2020 - 2024 ($ million)

5.5 Geography segment analysis 2020 - 2024

Historic Market Size - Geography Segment 2020 - 2024 ($ million)

5.6 Country segment analysis 2020 - 2024

Historic Market Size - Country Segment 2020 - 2024 ($ million)

6. Qualitative Analysis

6.1 Impact of AI on global neodymium (NdFeB) magnets market

6.2 Impact of geopolitical conflicts on global neodymium (NdFeB) magnets market

7. Five Forces Analysis

7.1 Five forces summary

Five forces analysis - Comparison between 2025 and 2030

7.2 Bargaining power of buyers

Bargaining power of buyers - Impact of key factors 2025 and 2030

7.3 Bargaining power of suppliers

Bargaining power of suppliers - Impact of key factors in 2025 and 2030

7.4 Threat of new entrants

Threat of new entrants - Impact of key factors in 2025 and 2030

7.5 Threat of substitutes

Threat of substitutes - Impact of key factors in 2025 and 2030

7.6 Threat of rivalry

Threat of rivalry - Impact of key factors in 2025 and 2030

7.7 Market condition

Chart on Market condition - Five forces 2025 and 2030

8. Market Segmentation by Type

8.1 Market segments

Chart on Type - Market share 2025-2030 (%)
Data Table on Type - Market share 2025-2030 (%)

8.2 Comparison by Type

Chart on Comparison by Type
Data Table on Comparison by Type

8.3 Sintered - Market size and forecast 2025-2030

Chart on Sintered - Market size and forecast 2025-2030 ($ million)
Data Table on Sintered - Market size and forecast 2025-2030 ($ million)
Chart on Sintered - Year-over-year growth 2025-2030 (%)
Data Table on Sintered - Year-over-year growth 2025-2030 (%)

8.4 Bonded - Market size and forecast 2025-2030

Chart on Bonded - Market size and forecast 2025-2030 ($ million)
Data Table on Bonded - Market size and forecast 2025-2030 ($ million)
Chart on Bonded - Year-over-year growth 2025-2030 (%)
Data Table on Bonded - Year-over-year growth 2025-2030 (%)

8.5 Market opportunity by Type

Market opportunity by Type ($ million)
Data Table on Market opportunity by Type ($ million)

9. Market Segmentation by End-user

9.1 Market segments

Chart on End-user - Market share 2025-2030 (%)
Data Table on End-user - Market share 2025-2030 (%)

9.2 Comparison by End-user

Chart on Comparison by End-user
Data Table on Comparison by End-user

9.3 Automotive - Market size and forecast 2025-2030

Chart on Automotive - Market size and forecast 2025-2030 ($ million)
Data Table on Automotive - Market size and forecast 2025-2030 ($ million)
Chart on Automotive - Year-over-year growth 2025-2030 (%)
Data Table on Automotive - Year-over-year growth 2025-2030 (%)

9.4 Electronics - Market size and forecast 2025-2030

Chart on Electronics - Market size and forecast 2025-2030 ($ million)
Data Table on Electronics - Market size and forecast 2025-2030 ($ million)
Chart on Electronics - Year-over-year growth 2025-2030 (%)
Data Table on Electronics - Year-over-year growth 2025-2030 (%)

9.5 Power generators - Market size and forecast 2025-2030

Chart on Power generators - Market size and forecast 2025-2030 ($ million)
Data Table on Power generators - Market size and forecast 2025-2030 ($ million)
Chart on Power generators - Year-over-year growth 2025-2030 (%)
Data Table on Power generators - Year-over-year growth 2025-2030 (%)

9.6 Medical industry - Market size and forecast 2025-2030

Chart on Medical industry - Market size and forecast 2025-2030 ($ million)
Data Table on Medical industry - Market size and forecast 2025-2030 ($ million)
Chart on Medical industry - Year-over-year growth 2025-2030 (%)
Data Table on Medical industry - Year-over-year growth 2025-2030 (%)

9.7 Others - Market size and forecast 2025-2030

Chart on Others - Market size and forecast 2025-2030 ($ million)
Data Table on Others - Market size and forecast 2025-2030 ($ million)
Chart on Others - Year-over-year growth 2025-2030 (%)
Data Table on Others - Year-over-year growth 2025-2030 (%)

9.8 Market opportunity by End-user

Market opportunity by End-user ($ million)
Data Table on Market opportunity by End-user ($ million)

10. Market Segmentation by Product Type

10.1 Market segments

Chart on Product Type - Market share 2025-2030 (%)
Data Table on Product Type - Market share 2025-2030 (%)

10.2 Comparison by Product Type

Chart on Comparison by Product Type
Data Table on Comparison by Product Type

10.3 Nickle coated - Market size and forecast 2025-2030

Chart on Nickle coated - Market size and forecast 2025-2030 ($ million)
Data Table on Nickle coated - Market size and forecast 2025-2030 ($ million)
Chart on Nickle coated - Year-over-year growth 2025-2030 (%)
Data Table on Nickle coated - Year-over-year growth 2025-2030 (%)

10.4 Zinc coated - Market size and forecast 2025-2030

Chart on Zinc coated - Market size and forecast 2025-2030 ($ million)
Data Table on Zinc coated - Market size and forecast 2025-2030 ($ million)
Chart on Zinc coated - Year-over-year growth 2025-2030 (%)
Data Table on Zinc coated - Year-over-year growth 2025-2030 (%)

10.5 Epoxy coated - Market size and forecast 2025-2030

Chart on Epoxy coated - Market size and forecast 2025-2030 ($ million)
Data Table on Epoxy coated - Market size and forecast 2025-2030 ($ million)
Chart on Epoxy coated - Year-over-year growth 2025-2030 (%)
Data Table on Epoxy coated - Year-over-year growth 2025-2030 (%)

10.6 Gold coated - Market size and forecast 2025-2030

Chart on Gold coated - Market size and forecast 2025-2030 ($ million)
Data Table on Gold coated - Market size and forecast 2025-2030 ($ million)
Chart on Gold coated - Year-over-year growth 2025-2030 (%)
Data Table on Gold coated - Year-over-year growth 2025-2030 (%)

10.7 Others - Market size and forecast 2025-2030

Chart on Others - Market size and forecast 2025-2030 ($ million)
Data Table on Others - Market size and forecast 2025-2030 ($ million)
Chart on Others - Year-over-year growth 2025-2030 (%)
Data Table on Others - Year-over-year growth 2025-2030 (%)

10.8 Market opportunity by Product Type

Market opportunity by Product Type ($ million)
Data Table on Market opportunity by Product Type ($ million)

11. Customer Landscape

11.1 Customer landscape overview

Analysis of price sensitivity, lifecycle, customer purchase basket, adoption rates, and purchase criteria

12. Geographic Landscape

12.1 Geographic segmentation

Chart on Market share by geography 2025-2030 (%)
Data Table on Market share by geography 2025-2030 (%)

12.2 Geographic comparison

Chart on Geographic comparison
Data Table on Geographic comparison

12.3 APAC - Market size and forecast 2025-2030

Chart on APAC - Market size and forecast 2025-2030 ($ million)
Data Table on APAC - Market size and forecast 2025-2030 ($ million)
Chart on APAC - Year-over-year growth 2025-2030 (%)
Data Table on APAC - Year-over-year growth 2025-2030 (%)
Chart on Regional Comparison - APAC
Data Table on Regional Comparison - APAC

12.3.1 China - Market size and forecast 2025-2030

Chart on China - Market size and forecast 2025-2030 ($ million)
Data Table on China - Market size and forecast 2025-2030 ($ million)
Chart on China - Year-over-year growth 2025-2030 (%)
Data Table on China - Year-over-year growth 2025-2030 (%)

12.3.2 Japan - Market size and forecast 2025-2030

Chart on Japan - Market size and forecast 2025-2030 ($ million)
Data Table on Japan - Market size and forecast 2025-2030 ($ million)
Chart on Japan - Year-over-year growth 2025-2030 (%)
Data Table on Japan - Year-over-year growth 2025-2030 (%)

12.3.3 South Korea - Market size and forecast 2025-2030

Chart on South Korea - Market size and forecast 2025-2030 ($ million)
Data Table on South Korea - Market size and forecast 2025-2030 ($ million)
Chart on South Korea - Year-over-year growth 2025-2030 (%)
Data Table on South Korea - Year-over-year growth 2025-2030 (%)

12.3.4 India - Market size and forecast 2025-2030

Chart on India - Market size and forecast 2025-2030 ($ million)
Data Table on India - Market size and forecast 2025-2030 ($ million)
Chart on India - Year-over-year growth 2025-2030 (%)
Data Table on India - Year-over-year growth 2025-2030 (%)

12.3.5 Australia - Market size and forecast 2025-2030

Chart on Australia - Market size and forecast 2025-2030 ($ million)
Data Table on Australia - Market size and forecast 2025-2030 ($ million)
Chart on Australia - Year-over-year growth 2025-2030 (%)
Data Table on Australia - Year-over-year growth 2025-2030 (%)

12.3.6 Indonesia - Market size and forecast 2025-2030

Chart on Indonesia - Market size and forecast 2025-2030 ($ million)
Data Table on Indonesia - Market size and forecast 2025-2030 ($ million)
Chart on Indonesia - Year-over-year growth 2025-2030 (%)
Data Table on Indonesia - Year-over-year growth 2025-2030 (%)

12.4 Europe - Market size and forecast 2025-2030

Chart on Europe - Market size and forecast 2025-2030 ($ million)
Data Table on Europe - Market size and forecast 2025-2030 ($ million)
Chart on Europe - Year-over-year growth 2025-2030 (%)
Data Table on Europe - Year-over-year growth 2025-2030 (%)
Chart on Regional Comparison - Europe
Data Table on Regional Comparison - Europe

12.4.1 Germany - Market size and forecast 2025-2030

Chart on Germany - Market size and forecast 2025-2030 ($ million)
Data Table on Germany - Market size and forecast 2025-2030 ($ million)
Chart on Germany - Year-over-year growth 2025-2030 (%)
Data Table on Germany - Year-over-year growth 2025-2030 (%)

12.4.2 UK - Market size and forecast 2025-2030

Chart on UK - Market size and forecast 2025-2030 ($ million)
Data Table on UK - Market size and forecast 2025-2030 ($ million)
Chart on UK - Year-over-year growth 2025-2030 (%)
Data Table on UK - Year-over-year growth 2025-2030 (%)

12.4.3 France - Market size and forecast 2025-2030

Chart on France - Market size and forecast 2025-2030 ($ million)
Data Table on France - Market size and forecast 2025-2030 ($ million)
Chart on France - Year-over-year growth 2025-2030 (%)
Data Table on France - Year-over-year growth 2025-2030 (%)

12.4.4 Italy - Market size and forecast 2025-2030

Chart on Italy - Market size and forecast 2025-2030 ($ million)
Data Table on Italy - Market size and forecast 2025-2030 ($ million)
Chart on Italy - Year-over-year growth 2025-2030 (%)
Data Table on Italy - Year-over-year growth 2025-2030 (%)

12.4.5 The Netherlands - Market size and forecast 2025-2030

Chart on The Netherlands - Market size and forecast 2025-2030 ($ million)
Data Table on The Netherlands - Market size and forecast 2025-2030 ($ million)
Chart on The Netherlands - Year-over-year growth 2025-2030 (%)
Data Table on The Netherlands - Year-over-year growth 2025-2030 (%)

12.4.6 Spain - Market size and forecast 2025-2030

Chart on Spain - Market size and forecast 2025-2030 ($ million)
Data Table on Spain - Market size and forecast 2025-2030 ($ million)
Chart on Spain - Year-over-year growth 2025-2030 (%)
Data Table on Spain - Year-over-year growth 2025-2030 (%)

12.5 North America - Market size and forecast 2025-2030

Chart on North America - Market size and forecast 2025-2030 ($ million)
Data Table on North America - Market size and forecast 2025-2030 ($ million)
Chart on North America - Year-over-year growth 2025-2030 (%)
Data Table on North America - Year-over-year growth 2025-2030 (%)
Chart on Regional Comparison - North America
Data Table on Regional Comparison - North America

12.5.1 US - Market size and forecast 2025-2030

Chart on US - Market size and forecast 2025-2030 ($ million)
Data Table on US - Market size and forecast 2025-2030 ($ million)
Chart on US - Year-over-year growth 2025-2030 (%)
Data Table on US - Year-over-year growth 2025-2030 (%)

12.5.2 Canada - Market size and forecast 2025-2030

Chart on Canada - Market size and forecast 2025-2030 ($ million)
Data Table on Canada - Market size and forecast 2025-2030 ($ million)
Chart on Canada - Year-over-year growth 2025-2030 (%)
Data Table on Canada - Year-over-year growth 2025-2030 (%)

12.5.3 Mexico - Market size and forecast 2025-2030

Chart on Mexico - Market size and forecast 2025-2030 ($ million)
Data Table on Mexico - Market size and forecast 2025-2030 ($ million)
Chart on Mexico - Year-over-year growth 2025-2030 (%)
Data Table on Mexico - Year-over-year growth 2025-2030 (%)

12.6 Middle East and Africa - Market size and forecast 2025-2030

Chart on Middle East and Africa - Market size and forecast 2025-2030 ($ million)
Data Table on Middle East and Africa - Market size and forecast 2025-2030 ($ million)
Chart on Middle East and Africa - Year-over-year growth 2025-2030 (%)
Data Table on Middle East and Africa - Year-over-year growth 2025-2030 (%)
Chart on Regional Comparison - Middle East and Africa
Data Table on Regional Comparison - Middle East and Africa

12.6.1 Saudi Arabia - Market size and forecast 2025-2030

Chart on Saudi Arabia - Market size and forecast 2025-2030 ($ million)
Data Table on Saudi Arabia - Market size and forecast 2025-2030 ($ million)
Chart on Saudi Arabia - Year-over-year growth 2025-2030 (%)
Data Table on Saudi Arabia - Year-over-year growth 2025-2030 (%)

12.6.2 Turkey - Market size and forecast 2025-2030

Chart on Turkey - Market size and forecast 2025-2030 ($ million)
Data Table on Turkey - Market size and forecast 2025-2030 ($ million)
Chart on Turkey - Year-over-year growth 2025-2030 (%)
Data Table on Turkey - Year-over-year growth 2025-2030 (%)

12.6.3 UAE - Market size and forecast 2025-2030

Chart on UAE - Market size and forecast 2025-2030 ($ million)
Data Table on UAE - Market size and forecast 2025-2030 ($ million)
Chart on UAE - Year-over-year growth 2025-2030 (%)
Data Table on UAE - Year-over-year growth 2025-2030 (%)

12.6.4 South Africa - Market size and forecast 2025-2030

Chart on South Africa - Market size and forecast 2025-2030 ($ million)
Data Table on South Africa - Market size and forecast 2025-2030 ($ million)
Chart on South Africa - Year-over-year growth 2025-2030 (%)
Data Table on South Africa - Year-over-year growth 2025-2030 (%)

12.6.5 Israel - Market size and forecast 2025-2030

Chart on Israel - Market size and forecast 2025-2030 ($ million)
Data Table on Israel - Market size and forecast 2025-2030 ($ million)
Chart on Israel - Year-over-year growth 2025-2030 (%)
Data Table on Israel - Year-over-year growth 2025-2030 (%)

12.7 South America - Market size and forecast 2025-2030

Chart on South America - Market size and forecast 2025-2030 ($ million)
Data Table on South America - Market size and forecast 2025-2030 ($ million)
Chart on South America - Year-over-year growth 2025-2030 (%)
Data Table on South America - Year-over-year growth 2025-2030 (%)
Chart on Regional Comparison - South America
Data Table on Regional Comparison - South America

12.7.1 Brazil - Market size and forecast 2025-2030

Chart on Brazil - Market size and forecast 2025-2030 ($ million)
Data Table on Brazil - Market size and forecast 2025-2030 ($ million)
Chart on Brazil - Year-over-year growth 2025-2030 (%)
Data Table on Brazil - Year-over-year growth 2025-2030 (%)

12.7.2 Argentina - Market size and forecast 2025-2030

Chart on Argentina - Market size and forecast 2025-2030 ($ million)
Data Table on Argentina - Market size and forecast 2025-2030 ($ million)
Chart on Argentina - Year-over-year growth 2025-2030 (%)
Data Table on Argentina - Year-over-year growth 2025-2030 (%)

12.7.3 Colombia - Market size and forecast 2025-2030

Chart on Colombia - Market size and forecast 2025-2030 ($ million)
Data Table on Colombia - Market size and forecast 2025-2030 ($ million)
Chart on Colombia - Year-over-year growth 2025-2030 (%)
Data Table on Colombia - Year-over-year growth 2025-2030 (%)

12.8 Market opportunity by geography

Market opportunity by geography ($ million)
Data Tables on Market opportunity by geography ($ million)

13. Drivers, Challenges, and Opportunity

13.1 Market drivers

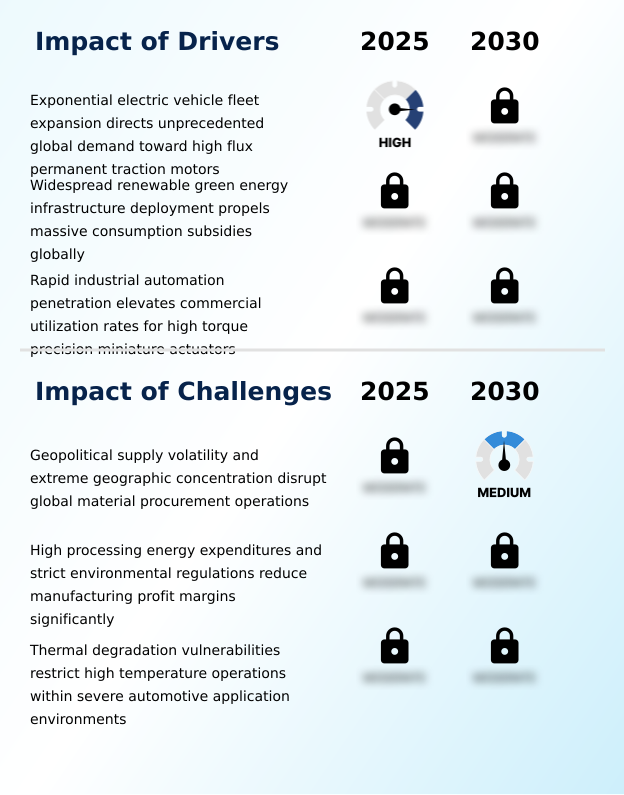
Exponential electric vehicle fleet expansion directs unprecedented global demand toward high flux permanent traction motors
Widespread renewable green energy infrastructure deployment propels massive consumption subsidies globally
Rapid industrial automation penetration elevates commercial utilization rates for high torque precision miniature actuators

13.2 Market challenges

Geopolitical supply volatility and extreme geographic concentration disrupt global material procurement operations
High processing energy expenditures and strict environmental regulations reduce manufacturing profit margins significantly
Thermal degradation vulnerabilities restrict high temperature operations within severe automotive application environments

13.3 Impact of drivers and challenges

Impact of drivers and challenges in 2025 and 2030

13.4 Market opportunities

Advanced closed loop magnet recycling methodologies establish sustainable alternative raw material supply solutions
Strategic engineering research alliances enhance thermal resistance thresholds through advanced structural material innovations
Market transition toward specialized corrosion resistant protective surface plating architectures gains global momentum

14. Competitive Landscape

14.1 Overview

14.2

Overview on criticality of inputs and factors of differentiation

14.3 Landscape disruption

Overview on factors of disruption

14.4 Industry risks

Impact of key risks on business

15. Competitive Analysis

15.1 Companies profiled

Companies covered

15.2 Company ranking index

15.3 Market positioning of companies

Matrix on companies position and classification

15.4 Adams Magnetic Products Co.

Adams Magnetic Products Co. - Overview
Adams Magnetic Products Co. - Product / Service
Adams Magnetic Products Co. - Key offerings
SWOT

15.5 Arnold Magnetic Technologies

Arnold Magnetic Technologies - Overview
Arnold Magnetic Technologies - Product / Service
Arnold Magnetic Technologies - Key offerings
SWOT

15.6 Bakkers Magnetics

Bakkers Magnetics - Overview
Bakkers Magnetics - Product / Service
Bakkers Magnetics - Key offerings
SWOT

15.7 Bomatec AG

Bomatec AG - Overview
Bomatec AG - Product / Service
Bomatec AG - Key offerings
SWOT

15.8 Calamit S.r.l.

Calamit S.r.l. - Overview
Calamit S.r.l. - Product / Service
Calamit S.r.l. - Key offerings
SWOT

15.9 Dexter Magnetic Technologies

Dexter Magnetic Technologies - Overview
Dexter Magnetic Technologies - Product / Service
Dexter Magnetic Technologies - Key offerings
SWOT

15.10 Earth Panda

Earth Panda - Overview
Earth Panda - Product / Service
Earth Panda - Key offerings
SWOT

15.11 Eclipse Magnetics Ltd.

Eclipse Magnetics Ltd. - Overview
Eclipse Magnetics Ltd. - Product / Service
Eclipse Magnetics Ltd. - Key offerings
SWOT

15.12 Neo Performance Materials Inc.

Neo Performance Materials Inc. - Overview
Neo Performance Materials Inc. - Business segments
Neo Performance Materials Inc. - Key offerings
Neo Performance Materials Inc. - Segment focus
SWOT

15.13 Ningbo Yunsheng Co. Ltd.

Ningbo Yunsheng Co. Ltd. - Overview
Ningbo Yunsheng Co. Ltd. - Business segments
Ningbo Yunsheng Co. Ltd. - Key offerings
Ningbo Yunsheng Co. Ltd. - Segment focus
SWOT

15.14 Proterial Ltd.

Proterial Ltd. - Overview
Proterial Ltd. - Product / Service
Proterial Ltd. - Key offerings
SWOT

15.15 Shin Etsu Chemical Co. Ltd.

Shin Etsu Chemical Co. Ltd. - Overview
Shin Etsu Chemical Co. Ltd. - Business segments
Shin Etsu Chemical Co. Ltd. - Key offerings
Shin Etsu Chemical Co. Ltd. - Segment focus
SWOT

15.16 Stanford Magnets

Stanford Magnets - Overview
Stanford Magnets - Product / Service
Stanford Magnets - Key offerings
SWOT

15.17 TDK Corp.

TDK Corp. - Overview
TDK Corp. - Business segments
TDK Corp. - Key offerings
TDK Corp. - Segment focus
SWOT

15.18 Tengam Engineering Inc.

Tengam Engineering Inc. - Overview
Tengam Engineering Inc. - Product / Service
Tengam Engineering Inc. - Key offerings
SWOT

16. Appendix

16.1 Scope of the report

Market definition
Objectives
Notes and caveats

16.2 Inclusions and exclusions checklist

Inclusions checklist
Exclusions checklist

16.3 Currency conversion rates for US$

16.4 Research methodology

16.5 Data procurement

Information sources

16.6 Data validation

16.7 Validation techniques employed for market sizing

16.8 Data synthesis

16.9 360 degree market analysis

16.10 List of abbreviations

Research Methodology

Technavio presents a detailed picture of the market by way of study, synthesis, and summation of data from multiple sources. The analysts have presented the various facets of the market with a particular focus on identifying the key industry influencers. The data thus presented is comprehensive, reliable, and the result of extensive research, both primary and secondary.

INFORMATION SOURCES

Primary sources

  • Manufacturers and suppliers
  • Channel partners
  • Industry experts
  • Strategic decision makers

Secondary sources

  • Industry journals and periodicals
  • Government data
  • Financial reports of key industry players
  • Historical data
  • Press releases

DATA ANALYSIS

Data Synthesis

  • Collation of data
  • Estimation of key figures
  • Analysis of derived insights

Data Validation

  • Triangulation with data models
  • Reference against proprietary databases
  • Corroboration with industry experts

REPORT WRITING

Qualitative

  • Market drivers
  • Market challenges
  • Market trends
  • Five forces analysis

Quantitative

  • Market size and forecast
  • Market segmentation
  • Geographical insights
  • Competitive landscape

Interested in this report?

Get your sample now to see our research methodology and insights!

Download Now

Frequently Asked Questions

Neodymium (Ndfeb) Magnets market growth will increase by USD 13190.1 million during 2026-2030.

The Neodymium (Ndfeb) Magnets market is expected to grow at a CAGR of 10.2% during 2026-2030.

Neodymium (Ndfeb) Magnets market is segmented by Type (Sintered, Bonded) End-user (Automotive, Electronics, Power generators, Medical industry, Others) Product type (Nickle coated, Zinc coated, Epoxy coated, Gold coated, Others)

Adams Magnetic Products Co., Arnold Magnetic Technologies, Bakkers Magnetics, Bomatec AG, Calamit S.r.l., Chengdu Galaxy Magnets Co. Ltd., Dexter Magnetic Technologies, Earth Panda, Eclipse Magnetics Ltd., Electron Energy Corp., Hengsheng Magnetic Technology, Integrated Technologies Group, MPCO Magnetics, Neo Performance Materials Inc., Ningbo Yunsheng Co. Ltd., Proterial Ltd., Shin Etsu Chemical Co. Ltd., Stanford Magnets, TDK Corp., Tengam Engineering Inc. are a few of the key vendors in the Neodymium (Ndfeb) Magnets market.

APAC will register the highest growth rate of 67.9% among the other regions. Therefore, the Neodymium (Ndfeb) Magnets market in APAC is expected to garner significant business opportunities for the vendors during the forecast period.

China, Japan, South Korea, India, Australia, Indonesia, Germany, UK, France, Italy, The Netherlands, Spain, US, Canada, Mexico, Saudi Arabia, Turkey, UAE, South Africa, Israel, Brazil, Argentina, Colombia

  • Exponential electric vehicle fleet expansion directs unprecedented global demand toward high flux permanent traction motors is the driving factor this market.

The Neodymium (Ndfeb) Magnets market vendors should focus on grabbing business opportunities from the Type segment as it accounted for the largest market share in the base year.
RIA - Research AI Assistant
Ask RIA
