Neurodiagnostics Market Analysis North America, Europe, Asia, Rest of World (ROW) - US, Germany, UK, China, Japan - Size and Forecast 2024-2028

Neurodiagnostics Market Analysis North America, Europe, Asia, Rest of World (ROW) - US, Germany, UK, China, Japan - Size and Forecast 2024-2028

Published: Nov 2023 167 Pages SKU: IRTNTR76731

Market Overview at a Glance

$4.04 B
Market Opportunity
8.01%
CAGR
7.34
YoY growth 2023-2024(%)

Neurodiagnostics Market Size 2024-2028

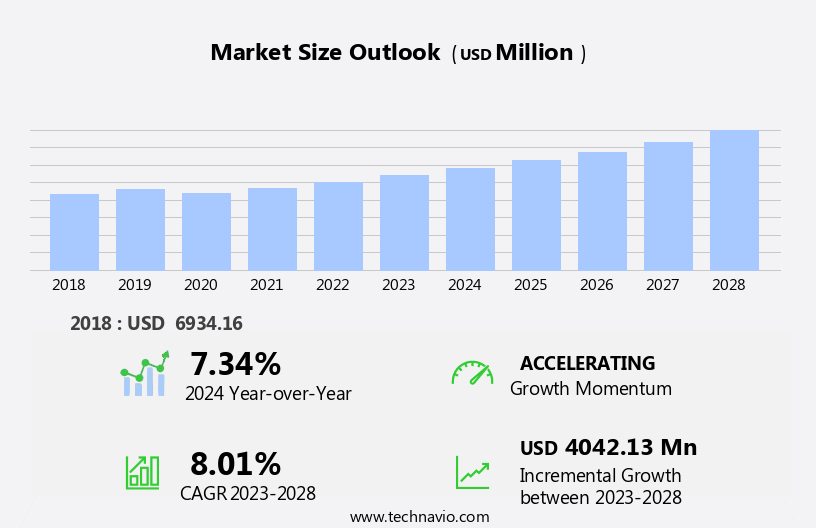
The neurodiagnostics market size is forecast to increase by USD 4.04 billion, at a CAGR of 8.01% between 2023 and 2028.

  • The market is experiencing significant growth due to the increasing prevalence of neurological disorders and the heightened focus on accurate neurological diagnostics. Neurological disorders, such as epilepsy, Parkinson's disease, and Alzheimer's disease, are on the rise, driving the demand for advanced diagnostic tools and techniques. These disorders often require precise diagnosis for effective treatment, making the accuracy and reliability of neurodiagnostic tests crucial. However, the high cost of neurology devices poses a considerable challenge for market growth. The expensive nature of these diagnostic tools can limit their accessibility, particularly in developing regions and low-income populations.
  • Despite this obstacle, opportunities exist for companies to innovate and develop cost-effective solutions, addressing this challenge and expanding market reach. By focusing on technological advancements and cost reduction strategies, market players can capitalize on the growing demand for accurate neurological diagnostics and meet the evolving needs of healthcare providers and patients.

What will be the Size of the Neurodiagnostics Market during the forecast period?

Neurodiagnostics Market Size

Explore in-depth regional segment analysis with market size data - historical 2018-2022 and forecasts 2024-2028 - in the full report.  
Request Free Sample

The market continues to evolve, driven by advancements in technology and growing applications across various sectors. Neuromuscular junction disorders, once diagnosed primarily through manual testing methods, now benefit from electromyography techniques that provide objective and precise data. Evoked potential studies, including somatosensory and auditory, offer valuable insights into neural function and have expanded the diagnostic capabilities of clinical neurophysiology testing. Electroencephalography (EEG) signal processing, with techniques such as quantitative analysis and event-related potentials, enables the detection of cognitive changes and brain activity patterns associated with conditions like dementia. Neurodiagnostic imaging techniques, such as functional brain mapping and electroencephalography devices, provide visual representations of neural activity, enhancing diagnostic accuracy.

In the realm of epilepsy, seizure detection through advanced signal processing and machine learning algorithms is revolutionizing diagnosis and treatment. Neuroimaging techniques, like magnetic resonance imaging and positron emission tomography, offer improved visualization of brain structures and functions, aiding in the identification of epileptic foci. Multiple sclerosis biomarkers and neuroimaging techniques facilitate early and accurate diagnosis, while neurodiagnostic tools like transcranial magnetic stimulation and electrocorticography monitoring contribute to the development of personalized treatment plans. The ongoing research in this field, including the application of neural network algorithms and brain computer interfaces, further underscores the dynamic nature of the market.

Peripheral nerve stimulation, nerve conduction velocity assessment, and neuropathic pain assessment are other areas of neurodiagnostics that are continually advancing, providing valuable diagnostic and therapeutic solutions for patients. The integration of these techniques into clinical practice is transforming the landscape of healthcare and neurological assessment tools, ultimately improving patient outcomes.

How is this Neurodiagnostics Industry segmented?

The neurodiagnostics industry research report provides comprehensive data (region-wise segment analysis), with forecasts and estimates in "USD million" for the period 2024-2028, as well as historical data from 2018-2022 for the following segments.

  • Type
    • Diagnostic and imaging solutions
    • In-vitro diagnostics
  • End-user
    • Diagnostic laboratories and imaging centers
    • Hospitals and surgery centers
    • Others
  • Geography
    • North America
      • US
    • Europe
      • Germany
      • UK
    • APAC
      • China
      • Japan
    • Rest of World (ROW)

By Type Insights

The diagnostic and imaging solutions segment is estimated to witness significant growth during the forecast period.

Neurodiagnostics, encompassing patient monitoring systems, high-density EEG systems, cognitive assessment metrics, transcranial magnetic stimulation, quantitative EEG analysis, signal averaging techniques, functional brain mapping, sleep apnea detection, somatosensory evoked potentials, peripheral nerve stimulation, electrocorticography monitoring, clinical neurophysiology testing, brain computer interface, intraoperative neurophysiology, neuromuscular junction disorders, evoked potential studies, EEG signal processing, multiple sclerosis biomarkers, epilepsy seizure detection, neurodiagnostic imaging techniques, electromyography techniques, electroencephalography devices, EMG artifact reduction, nerve conduction velocity, neurological assessment tools, neural network algorithms, dementia diagnostic markers, event-related potentials, and neuropathic pain assessment, is experiencing significant growth. Fueled by a high per capita income and the increasing adoption of advanced neurology systems to diagnose and treat neurological disorders, this market segment is poised for expansion.

Neurological disorders, including brain tumors, pose serious and lasting damage to individuals. Traditional methods, such as computed tomography (CT) scans, while useful for detecting bleeding or swelling in the brain, often fail to provide accurate results. As a result, there is a growing demand for advanced neurodiagnostic solutions to deliver precise results and improve patient outcomes.

Neurodiagnostics Market Size

Request Free Sample

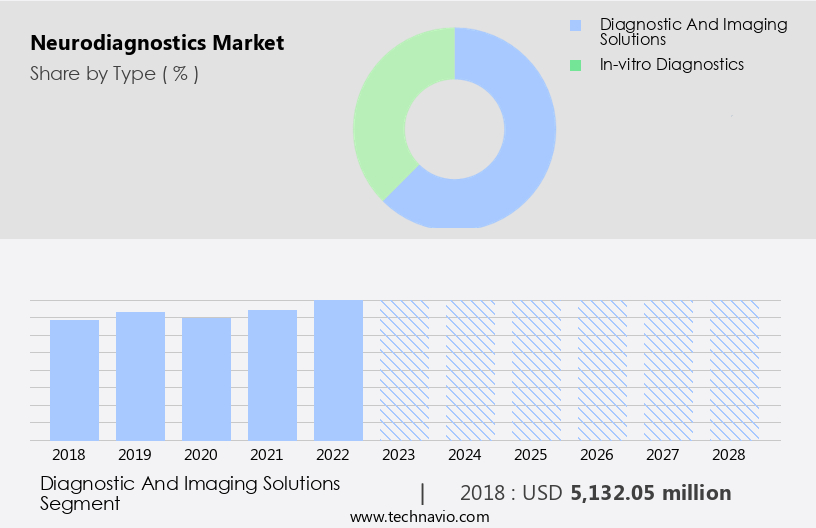
The Diagnostic and imaging solutions segment was valued at USD 5.13 billion in 2018 and showed a gradual increase during the forecast period.

Regional Analysis

Europe is estimated to contribute 36% to the growth of the global market during the forecast period. Technavio's analysts have elaborately explained the regional trends and drivers that shape the market during the forecast period.

Neurodiagnostics Market Share by Geography

 Request Free Sample

The US the market in North America is experiencing significant growth due to the increasing burden of neurological disorders, such as epilepsy and dementia, on the healthcare system. According to the Annals of Neurology, neurological disorders account for approximately USD800 billion in annual costs in the US. This expenditure, coupled with the rising demand for advanced neurology devices, is driving market growth. Neurological disorders are a major cause of mortality, and the US, with its well-established healthcare infrastructure and highly skilled medical professionals, is at the forefront of addressing this challenge. Advanced neurodiagnostic tools, such as high-density EEG systems, cognitive assessment metrics, transcranial magnetic stimulation, quantitative EEG analysis, signal averaging techniques, functional brain mapping, sleep apnea detection, somatosensory evoked potentials, peripheral nerve stimulation, electrocorticography monitoring, clinical neurophysiology testing, brain computer interfaces, intraoperative neurophysiology, neuromuscular junction disorders, evoked potential studies, EEG signal processing, multiple sclerosis biomarkers, epilepsy seizure detection, neurodiagnostic imaging techniques, electromyography techniques, electroencephalography devices, EMG artifact reduction, nerve conduction velocity, neurological assessment tools, neural network algorithms, dementia diagnostic markers, event-related potentials, and neuropathic pain assessment, are all contributing to the market's evolution.

These technologies enable early and accurate diagnosis, improved treatment outcomes, and enhanced patient care. The US's commitment to research and development, coupled with its large patient population and significant healthcare expenditure, positions it as a key player in the market.

Market Dynamics

Our researchers analyzed the data with 2023 as the base year, along with the key drivers, trends, and challenges. A holistic analysis of drivers will help companies refine their marketing strategies to gain a competitive advantage.

What are the key market drivers leading to the rise in the adoption of Neurodiagnostics Industry?

  • The rising incidence of neurological disorders serves as the primary catalyst for market growth in this sector. 
  • Neurological disorders, which affect the central and peripheral nervous systems, are a growing health concern worldwide. These conditions, including brain tumors, brain stroke, epilepsy, brain aneurysm, sleep apnea, MS, and PD, are caused by genetic defects, chromosomal abnormalities, or lifestyle factors such as diabetes mellitus, obesity, high blood pressure, hypertension, and smoking. According to a 2020 Lancet paper, neurological disorders are the second leading cause of death globally, accounting for 9 million deaths annually. Patients with neurological disorders require continuous monitoring to manage their conditions effectively. Advanced neurodiagnostic tools, such as patient monitoring systems, high-density EEG systems, cognitive assessment metrics, transcranial magnetic stimulation, quantitative EEG analysis, signal averaging techniques, and functional brain mapping, are essential for accurate diagnosis and treatment.
  • These technologies enable healthcare professionals to assess brain activity, identify abnormalities, and monitor the progression of neurological conditions. Moreover, the increasing prevalence of neurological disorders and the need for non-invasive, accurate, and reliable diagnostic tools are driving the growth of the market. The market is expected to witness significant advancements in the coming years due to ongoing research and development efforts. Neurological disorders are a major cause of disability, and the development of advanced neurodiagnostic tools can significantly improve patient outcomes and quality of life.

What are the market trends shaping the Neurodiagnostics Industry?

  • The growing importance of precise neurological diagnoses is a notable trend in the current market. Accurately identifying neurological conditions is essential for effective treatment and patient care.
  • Neurological disorders, such as Traumatic Brain Injuries (TBIs,) require precise diagnosis for effective treatment. Traditional methods like Computed Tomography (CT) scans have limitations in accurately detecting neurological damage. As a result, there is a growing need for advanced neurodiagnostic techniques to bridge this gap. Clinical neurophysiology testing, including sleep apnea detection, somatosensory evoked potentials, peripheral nerve stimulation, electrocorticography monitoring, and brain-computer interfaces, are increasingly utilized for more accurate diagnoses.
  • Intraoperative neurophysiology is another promising area, ensuring patient safety during neurosurgical procedures. Pharmaceutical companies are investing in research and development of neurological biomarkers for blood tests, offering more precise results and earlier detection of neurological disorders. This innovative approach is revolutionizing the field of neurodiagnostics, ensuring better patient outcomes.

What challenges does the Neurodiagnostics Industry face during its growth?

  • The escalating costs of neurology devices pose a significant challenge to the industry's growth trajectory. 
  • Neurology diagnoses and treatments for disorders such as neuromuscular junction disorders, multiple sclerosis, epilepsy, and others can be costly due to the expense of neurologists' fees, equipment, hospital stays, and diagnostic and surgical procedures. The advancement of neurology devices contributes to rising costs, with prices varying based on configuration and features. For instance, neurostimulation devices cost between USD8,820 and USD25,970, while an embolic coil averages USD1,750 and aneurysm clips USD60.28. Neurology procedures also carry significant costs, with an average of USD32,882 for Medicare patients and USD50,000 for uninsured patients for neurostimulator and implantation surgery.
  • These expenses hinder access to essential neurological care and treatments for many individuals. Despite these challenges, ongoing research in areas like evoked potential studies, EEG signal processing, and neurodiagnostic imaging techniques offers hope for more accurate and cost-effective diagnoses and treatments for neurological disorders.

Exclusive Customer Landscape

The neurodiagnostics market forecasting report includes the adoption lifecycle of the market, covering from the innovator's stage to the laggard's stage. It focuses on adoption rates in different regions based on penetration. Furthermore, the neurodiagnostics market report also includes key purchase criteria and drivers of price sensitivity to help companies evaluate and develop their market growth analysis strategies.

Neurodiagnostics Market Share by Geography

 Customer Landscape

Key Companies & Market Insights

Companies are implementing various strategies, such as strategic alliances, neurodiagnostics market forecast, partnerships, mergers and acquisitions, geographical expansion, and product/service launches, to enhance their presence in the industry.

Advanced Brain Monitoring Inc. - This company specializes in neurodiagnostics, providing innovative tools for interpreting brain and physiological functions in relation to chronic diseases and neurodegeneration. 

The industry research and growth report includes detailed analyses of the competitive landscape of the market and information about key companies, including:

  • Advanced Brain Monitoring Inc.
  • ANT Neuro
  • Bio Signal Group Corp.
  • Cadwell Industries Inc.
  • Canon Inc.
  • Compumedics Ltd.
  • ELMIKO BIOSIGNALS sp. z o.o.
  • F. Hoffmann La Roche Ltd.
  • FUJIFILM Corp.
  • General Electric Co.
  • Jordan NeuroScience
  • Koninklijke Philips N.V.
  • Lifelines Neuro Company LLC
  • Mitsar Co. Ltd.
  • Natus Medical Inc.
  • neurocare group AG
  • Nihon Kohden Corp.
  • NovaSignal Corp.
  • QIAGEN NV
  • Siemens Healthineers AG

Qualitative and quantitative analysis of companies has been conducted to help clients understand the wider business environment as well as the strengths and weaknesses of key industry players. Data is qualitatively analyzed to categorize companies as pure play, category-focused, industry-focused, and diversified; it is quantitatively analyzed to categorize companies as dominant, leading, strong, tentative, and weak.

Recent Development and News in Neurodiagnostics Market

  • In January 2024, Neurotechnology Corporation, a leading neurodiagnostics solutions provider, announced the launch of their new EEG system, "Star-NET," designed for remote patient monitoring and telehealth applications (Neurotechnology Corporation Press Release, 2024). This innovative product expansion aimed to cater to the growing demand for advanced neurodiagnostic tools in remote healthcare settings.
  • In March 2024, Medtronic and Philips entered into a strategic partnership to integrate Philips' advanced neuroimaging technologies into Medtronic's neurosurgical navigation systems (Medtronic Press Release, 2024). This collaboration aimed to enhance the accuracy and efficiency of neurosurgical procedures, positioning both companies at the forefront of advanced neurodiagnostics.
  • In May 2024, Natus Medical Incorporated completed the acquisition of NeuroWave Systems, a leading provider of digital EEG systems and software (Natus Medical Incorporated Press Release, 2024). This strategic move expanded Natus' product portfolio and strengthened their position in the market.
  • In April 2025, the US Food and Drug Administration (FDA) approved the marketing of Siemens Healthineers' new Magnetom Prisma Fit MRI system, featuring advanced neuroimaging capabilities (Siemens Healthineers Press Release, 2025). This regulatory approval marked a significant milestone for Siemens Healthineers, enabling them to offer a more comprehensive neurodiagnostics solution to healthcare providers in the US.

Research Analyst Overview

  • The market encompasses a range of technologies and techniques used to assess the function of the central and peripheral nervous systems. Motor evoked potentials (MEPs), nerve conduction studies (NCS), and electromyogram (EMG) interpretation are essential diagnostic tools in clinical neurophysiology labs. Neurological rehabilitation centers increasingly employ portable neurodiagnostic units for long-term monitoring solutions. Advancements in digital signal processing, artifact rejection algorithms, and neural network classifiers have enhanced the diagnostic accuracy of EEG data visualization and brainwave analysis methods. Repetitive nerve stimulation, nerve biopsy analysis, and single fiber EMG provide valuable insights into neuromuscular transmission disorders. Machine learning models and diagnostic accuracy metrics have revolutionized the interpretation of auditory and visual evoked potentials, enabling more precise treatment efficacy evaluations.
  • Clinical neurophysiology labs utilize these advanced technologies to optimize patient outcome measures and improve overall healthcare delivery. Signal denoising methods are crucial for accurate interpretation of neurodiagnostic data, ensuring reliable results in clinical settings. The integration of digital technology and advanced algorithms continues to drive innovation in the market, transforming the field and enhancing patient care.

Dive into Technavio's robust research methodology, blending expert interviews, extensive data synthesis, and validated models for unparalleled Neurodiagnostics Market insights. See full methodology.

Market Scope

Report Coverage

Details

Page number

167

Base year

2023

Historic period

2018-2022

Forecast period

2024-2028

Growth momentum & CAGR

Accelerate at a CAGR of 8.01%

Market growth 2024-2028

USD 4042.13 million

Market structure

Fragmented

YoY growth 2023-2024(%)

7.34

Key countries

US, Germany, UK, China, and Japan

Competitive landscape

Leading Companies, Market Positioning of Companies, Competitive Strategies, and Industry Risks

Request Free Sample

What are the Key Data Covered in this Neurodiagnostics Market Research and Growth Report?

  • CAGR of the Neurodiagnostics industry during the forecast period
  • Detailed information on factors that will drive the growth and forecasting between 2024 and 2028
  • Precise estimation of the size of the market and its contribution of the industry in focus to the parent market
  • Accurate predictions about upcoming growth and trends and changes in consumer behaviour
  • Growth of the market across North America, Europe, Asia, and Rest of World (ROW)
  • Thorough analysis of the market's competitive landscape and detailed information about companies
  • Comprehensive analysis of factors that will challenge the neurodiagnostics market growth of industry companies

We can help! Our analysts can customize this neurodiagnostics market research report to meet your requirements.

Get in touch

1 Executive Summary

  • 1.1 Market overview
    • Exhibit 01: Executive Summary – Chart on Market Overview
    • Exhibit 02: Executive Summary – Data Table on Market Overview
    • Exhibit 03: Executive Summary – Chart on Global Market Characteristics
    • Exhibit 04: Executive Summary – Chart on Market by Geography
    • Exhibit 05: Executive Summary – Chart on Market Segmentation by Type
    • Exhibit 06: Executive Summary – Chart on Market Segmentation by End-user
    • Exhibit 07: Executive Summary – Chart on Incremental Growth
    • Exhibit 08: Executive Summary – Data Table on Incremental Growth
    • Exhibit 09: Executive Summary – Chart on Vendor Market Positioning

2 Market Landscape

  • 2.1 Market ecosystem
    • Exhibit 10: Parent market
    • Exhibit 11: Market Characteristics

3 Market Sizing

  • 3.1 Market definition
    • Exhibit 12: Offerings of vendors included in the market definition
  • 3.2 Market segment analysis
    • Exhibit 13: Market segments
  • 3.3 Market size 2023
    • 3.4 Market outlook: Forecast for 2023-2028
      • Exhibit 14: Chart on Global - Market size and forecast 2023-2028 ($ million)
      • Exhibit 15: Data Table on Global - Market size and forecast 2023-2028 ($ million)
      • Exhibit 16: Chart on Global Market: Year-over-year growth 2023-2028 (%)
      • Exhibit 17: Data Table on Global Market: Year-over-year growth 2023-2028 (%)

    4 Historic Market Size

    • 4.1 Global neurodiagnostics market 2018 - 2022
      • Exhibit 18: Historic Market Size – Data Table on global neurodiagnostics market 2018 - 2022 ($ million)
    • 4.2 Type Segment Analysis 2018 - 2022
      • Exhibit 19: Historic Market Size – Type Segment 2018 - 2022 ($ million)
    • 4.3 End-users Segment Analysis 2018 - 2022
      • Exhibit 20: Historic Market Size – End-users Segment 2018 - 2022 ($ million)
    • 4.4 Geography Segment Analysis 2018 - 2022
      • Exhibit 21: Historic Market Size – Geography Segment 2018 - 2022 ($ million)
    • 4.5 Country Segment Analysis 2018 - 2022
      • Exhibit 22: Historic Market Size – Country Segment 2018 - 2022 ($ million)

    5 Five Forces Analysis

    • 5.1 Five forces summary
      • Exhibit 23: Five forces analysis - Comparison between 2023 and 2028
    • 5.2 Bargaining power of buyers
      • Exhibit 24: Chart on Bargaining power of buyers – Impact of key factors 2023 and 2028
    • 5.3 Bargaining power of suppliers
      • Exhibit 25: Bargaining power of suppliers – Impact of key factors in 2023 and 2028
    • 5.4 Threat of new entrants
      • Exhibit 26: Threat of new entrants – Impact of key factors in 2023 and 2028
    • 5.5 Threat of substitutes
      • Exhibit 27: Threat of substitutes – Impact of key factors in 2023 and 2028
    • 5.6 Threat of rivalry
      • Exhibit 28: Threat of rivalry – Impact of key factors in 2023 and 2028
    • 5.7 Market condition
      • Exhibit 29: Chart on Market condition - Five forces 2023 and 2028

    6 Market Segmentation by Type

    • 6.1 Market segments
      • Exhibit 30: Chart on Type - Market share 2023-2028 (%)
      • Exhibit 31: Data Table on Type - Market share 2023-2028 (%)
    • 6.2 Comparison by Type
      • Exhibit 32: Chart on Comparison by Type
      • Exhibit 33: Data Table on Comparison by Type
    • 6.3 Diagnostic and imaging solutions - Market size and forecast 2023-2028
      • Exhibit 34: Chart on Diagnostic and imaging solutions - Market size and forecast 2023-2028 ($ million)
      • Exhibit 35: Data Table on Diagnostic and imaging solutions - Market size and forecast 2023-2028 ($ million)
      • Exhibit 36: Chart on Diagnostic and imaging solutions - Year-over-year growth 2023-2028 (%)
      • Exhibit 37: Data Table on Diagnostic and imaging solutions - Year-over-year growth 2023-2028 (%)
    • 6.4 In-vitro diagnostics - Market size and forecast 2023-2028
      • Exhibit 38: Chart on In-vitro diagnostics - Market size and forecast 2023-2028 ($ million)
      • Exhibit 39: Data Table on In-vitro diagnostics - Market size and forecast 2023-2028 ($ million)
      • Exhibit 40: Chart on In-vitro diagnostics - Year-over-year growth 2023-2028 (%)
      • Exhibit 41: Data Table on In-vitro diagnostics - Year-over-year growth 2023-2028 (%)
    • 6.5 Market opportunity by Type
      • Exhibit 42: Market opportunity by Type ($ million)
      • Exhibit 43: Data Table on Market opportunity by Type ($ million)

    7 Market Segmentation by End-user

    • 7.1 Market segments
      • Exhibit 44: Chart on End-user - Market share 2023-2028 (%)
      • Exhibit 45: Data Table on End-user - Market share 2023-2028 (%)
    • 7.2 Comparison by End-user
      • Exhibit 46: Chart on Comparison by End-user
      • Exhibit 47: Data Table on Comparison by End-user
    • 7.3 Diagnostic laboratories and imaging centers - Market size and forecast 2023-2028
      • Exhibit 48: Chart on Diagnostic laboratories and imaging centers - Market size and forecast 2023-2028 ($ million)
      • Exhibit 49: Data Table on Diagnostic laboratories and imaging centers - Market size and forecast 2023-2028 ($ million)
      • Exhibit 50: Chart on Diagnostic laboratories and imaging centers - Year-over-year growth 2023-2028 (%)
      • Exhibit 51: Data Table on Diagnostic laboratories and imaging centers - Year-over-year growth 2023-2028 (%)
    • 7.4 Hospitals and surgery centers - Market size and forecast 2023-2028
      • Exhibit 52: Chart on Hospitals and surgery centers - Market size and forecast 2023-2028 ($ million)
      • Exhibit 53: Data Table on Hospitals and surgery centers - Market size and forecast 2023-2028 ($ million)
      • Exhibit 54: Chart on Hospitals and surgery centers - Year-over-year growth 2023-2028 (%)
      • Exhibit 55: Data Table on Hospitals and surgery centers - Year-over-year growth 2023-2028 (%)
    • 7.5 Others - Market size and forecast 2023-2028
      • Exhibit 56: Chart on Others - Market size and forecast 2023-2028 ($ million)
      • Exhibit 57: Data Table on Others - Market size and forecast 2023-2028 ($ million)
      • Exhibit 58: Chart on Others - Year-over-year growth 2023-2028 (%)
      • Exhibit 59: Data Table on Others - Year-over-year growth 2023-2028 (%)
    • 7.6 Market opportunity by End-user
      • Exhibit 60: Market opportunity by End-user ($ million)
      • Exhibit 61: Data Table on Market opportunity by End-user ($ million)

    8 Customer Landscape

    • 8.1 Customer landscape overview
      • Exhibit 62: Analysis of price sensitivity, lifecycle, customer purchase basket, adoption rates, and purchase criteria

    9 Geographic Landscape

    • 9.1 Geographic segmentation
      • Exhibit 63: Chart on Market share by geography 2023-2028 (%)
      • Exhibit 64: Data Table on Market share by geography 2023-2028 (%)
    • 9.2 Geographic comparison
      • Exhibit 65: Chart on Geographic comparison
      • Exhibit 66: Data Table on Geographic comparison
    • 9.3 North America - Market size and forecast 2023-2028
      • Exhibit 67: Chart on North America - Market size and forecast 2023-2028 ($ million)
      • Exhibit 68: Data Table on North America - Market size and forecast 2023-2028 ($ million)
      • Exhibit 69: Chart on North America - Year-over-year growth 2023-2028 (%)
      • Exhibit 70: Data Table on North America - Year-over-year growth 2023-2028 (%)
    • 9.4 Europe - Market size and forecast 2023-2028
      • Exhibit 71: Chart on Europe - Market size and forecast 2023-2028 ($ million)
      • Exhibit 72: Data Table on Europe - Market size and forecast 2023-2028 ($ million)
      • Exhibit 73: Chart on Europe - Year-over-year growth 2023-2028 (%)
      • Exhibit 74: Data Table on Europe - Year-over-year growth 2023-2028 (%)
    • 9.5 Asia - Market size and forecast 2023-2028
      • Exhibit 75: Chart on Asia - Market size and forecast 2023-2028 ($ million)
      • Exhibit 76: Data Table on Asia - Market size and forecast 2023-2028 ($ million)
      • Exhibit 77: Chart on Asia - Year-over-year growth 2023-2028 (%)
      • Exhibit 78: Data Table on Asia - Year-over-year growth 2023-2028 (%)
    • 9.6 Rest of World (ROW) - Market size and forecast 2023-2028
      • Exhibit 79: Chart on Rest of World (ROW) - Market size and forecast 2023-2028 ($ million)
      • Exhibit 80: Data Table on Rest of World (ROW) - Market size and forecast 2023-2028 ($ million)
      • Exhibit 81: Chart on Rest of World (ROW) - Year-over-year growth 2023-2028 (%)
      • Exhibit 82: Data Table on Rest of World (ROW) - Year-over-year growth 2023-2028 (%)
    • 9.7 US - Market size and forecast 2023-2028
      • Exhibit 83: Chart on US - Market size and forecast 2023-2028 ($ million)
      • Exhibit 84: Data Table on US - Market size and forecast 2023-2028 ($ million)
      • Exhibit 85: Chart on US - Year-over-year growth 2023-2028 (%)
      • Exhibit 86: Data Table on US - Year-over-year growth 2023-2028 (%)
    • 9.8 China - Market size and forecast 2023-2028
      • Exhibit 87: Chart on China - Market size and forecast 2023-2028 ($ million)
      • Exhibit 88: Data Table on China - Market size and forecast 2023-2028 ($ million)
      • Exhibit 89: Chart on China - Year-over-year growth 2023-2028 (%)
      • Exhibit 90: Data Table on China - Year-over-year growth 2023-2028 (%)
    • 9.9 Japan - Market size and forecast 2023-2028
      • Exhibit 91: Chart on Japan - Market size and forecast 2023-2028 ($ million)
      • Exhibit 92: Data Table on Japan - Market size and forecast 2023-2028 ($ million)
      • Exhibit 93: Chart on Japan - Year-over-year growth 2023-2028 (%)
      • Exhibit 94: Data Table on Japan - Year-over-year growth 2023-2028 (%)
    • 9.10 Germany - Market size and forecast 2023-2028
      • Exhibit 95: Chart on Germany - Market size and forecast 2023-2028 ($ million)
      • Exhibit 96: Data Table on Germany - Market size and forecast 2023-2028 ($ million)
      • Exhibit 97: Chart on Germany - Year-over-year growth 2023-2028 (%)
      • Exhibit 98: Data Table on Germany - Year-over-year growth 2023-2028 (%)
    • 9.11 UK - Market size and forecast 2023-2028
      • Exhibit 99: Chart on UK - Market size and forecast 2023-2028 ($ million)
      • Exhibit 100: Data Table on UK - Market size and forecast 2023-2028 ($ million)
      • Exhibit 101: Chart on UK - Year-over-year growth 2023-2028 (%)
      • Exhibit 102: Data Table on UK - Year-over-year growth 2023-2028 (%)
    • 9.12 Market opportunity by geography
      • Exhibit 103: Market opportunity by geography ($ million)
      • Exhibit 104: Data Tables on Market opportunity by geography ($ million)

    10 Drivers, Challenges, and Trends

    • 10.1 Market drivers
      • 10.2 Market challenges
        • 10.3 Impact of drivers and challenges
          • Exhibit 105: Impact of drivers and challenges in 2023 and 2028
        • 10.4 Market trends

          11 Vendor Landscape

          • 11.1 Overview
            • 11.2 Vendor landscape
              • Exhibit 106: Overview on Criticality of inputs and Factors of differentiation
            • 11.3 Landscape disruption
              • Exhibit 107: Overview on factors of disruption
            • 11.4 Industry risks
              • Exhibit 108: Impact of key risks on business

            12 Vendor Analysis

            • 12.1 Vendors covered
              • Exhibit 109: Vendors covered
            • 12.2 Market positioning of vendors
              • Exhibit 110: Matrix on vendor position and classification
            • 12.3 Advanced Brain Monitoring Inc.
              • Exhibit 111: Advanced Brain Monitoring Inc. - Overview
              • Exhibit 112: Advanced Brain Monitoring Inc. - Product / Service
              • Exhibit 113: Advanced Brain Monitoring Inc. - Key offerings
            • 12.4 ANT Neuro
              • Exhibit 114: ANT Neuro - Overview
              • Exhibit 115: ANT Neuro - Product / Service
              • Exhibit 116: ANT Neuro - Key offerings
            • 12.5 Cadwell Industries Inc.
              • Exhibit 117: Cadwell Industries Inc. - Overview
              • Exhibit 118: Cadwell Industries Inc. - Product / Service
              • Exhibit 119: Cadwell Industries Inc. - Key offerings
            • 12.6 Canon Inc.
              • Exhibit 120: Canon Inc. - Overview
              • Exhibit 121: Canon Inc. - Business segments
              • Exhibit 122: Canon Inc. - Key offerings
              • Exhibit 123: Canon Inc. - Segment focus
            • 12.7 Compumedics Ltd.
              • Exhibit 124: Compumedics Ltd. - Overview
              • Exhibit 125: Compumedics Ltd. - Product / Service
              • Exhibit 126: Compumedics Ltd. - Key offerings
            • 12.8 F. Hoffmann La Roche Ltd.
              • Exhibit 127: F. Hoffmann La Roche Ltd. - Overview
              • Exhibit 128: F. Hoffmann La Roche Ltd. - Business segments
              • Exhibit 129: F. Hoffmann La Roche Ltd. - Key news
              • Exhibit 130: F. Hoffmann La Roche Ltd. - Key offerings
              • Exhibit 131: F. Hoffmann La Roche Ltd. - Segment focus
            • 12.9 FUJIFILM Corp.
              • Exhibit 132: FUJIFILM Corp. - Overview
              • Exhibit 133: FUJIFILM Corp. - Business segments
              • Exhibit 134: FUJIFILM Corp. - Key news
              • Exhibit 135: FUJIFILM Corp. - Key offerings
              • Exhibit 136: FUJIFILM Corp. - Segment focus
            • 12.10 General Electric Co.
              • Exhibit 137: General Electric Co. - Overview
              • Exhibit 138: General Electric Co. - Business segments
              • Exhibit 139: General Electric Co. - Key news
              • Exhibit 140: General Electric Co. - Key offerings
              • Exhibit 141: General Electric Co. - Segment focus
            • 12.11 Koninklijke Philips N.V.
              • Exhibit 142: Koninklijke Philips N.V. - Overview
              • Exhibit 143: Koninklijke Philips N.V. - Business segments
              • Exhibit 144: Koninklijke Philips N.V. - Key news
              • Exhibit 145: Koninklijke Philips N.V. - Key offerings
              • Exhibit 146: Koninklijke Philips N.V. - Segment focus
            • 12.12 Lifelines Neuro Company LLC
              • Exhibit 147: Lifelines Neuro Company LLC - Overview
              • Exhibit 148: Lifelines Neuro Company LLC - Product / Service
              • Exhibit 149: Lifelines Neuro Company LLC - Key offerings
            • 12.13 Mitsar Co. Ltd.
              • Exhibit 150: Mitsar Co. Ltd. - Overview
              • Exhibit 151: Mitsar Co. Ltd. - Product / Service
              • Exhibit 152: Mitsar Co. Ltd. - Key offerings
            • 12.14 Natus Medical Inc.
              • Exhibit 153: Natus Medical Inc. - Overview
              • Exhibit 154: Natus Medical Inc. - Product / Service
              • Exhibit 155: Natus Medical Inc. - Key news
              • Exhibit 156: Natus Medical Inc. - Key offerings
            • 12.15 Nihon Kohden Corp.
              • Exhibit 157: Nihon Kohden Corp. - Overview
              • Exhibit 158: Nihon Kohden Corp. - Product / Service
              • Exhibit 159: Nihon Kohden Corp. - Key news
              • Exhibit 160: Nihon Kohden Corp. - Key offerings
            • 12.16 QIAGEN NV
              • Exhibit 161: QIAGEN NV - Overview
              • Exhibit 162: QIAGEN NV - Product / Service
              • Exhibit 163: QIAGEN NV - Key news
              • Exhibit 164: QIAGEN NV - Key offerings
            • 12.17 Siemens Healthineers AG
              • Exhibit 165: Siemens Healthineers AG - Overview
              • Exhibit 166: Siemens Healthineers AG - Business segments
              • Exhibit 167: Siemens Healthineers AG - Key news
              • Exhibit 168: Siemens Healthineers AG - Key offerings
              • Exhibit 169: Siemens Healthineers AG - Segment focus

            13 Appendix

            • 13.1 Scope of the report
              • 13.2 Inclusions and exclusions checklist
                • Exhibit 170: Inclusions checklist
                • Exhibit 171: Exclusions checklist
              • 13.3 Currency conversion rates for US$
                • Exhibit 172: Currency conversion rates for US$
              • 13.4 Research methodology
                • Exhibit 173: Research methodology
                • Exhibit 174: Validation techniques employed for market sizing
                • Exhibit 175: Information sources
              • 13.5 List of abbreviations
                • Exhibit 176: List of abbreviations

              Research Methodology

              Technavio presents a detailed picture of the market by way of study, synthesis, and summation of data from multiple sources. The analysts have presented the various facets of the market with a particular focus on identifying the key industry influencers. The data thus presented is comprehensive, reliable, and the result of extensive research, both primary and secondary.

              INFORMATION SOURCES

              Primary sources

              • Manufacturers and suppliers
              • Channel partners
              • Industry experts
              • Strategic decision makers

              Secondary sources

              • Industry journals and periodicals
              • Government data
              • Financial reports of key industry players
              • Historical data
              • Press releases

              DATA ANALYSIS

              Data Synthesis

              • Collation of data
              • Estimation of key figures
              • Analysis of derived insights

              Data Validation

              • Triangulation with data models
              • Reference against proprietary databases
              • Corroboration with industry experts

              REPORT WRITING

              Qualitative

              • Market drivers
              • Market challenges
              • Market trends
              • Five forces analysis

              Quantitative

              • Market size and forecast
              • Market segmentation
              • Geographical insights
              • Competitive landscape

              Interested in this report?

              Get your sample now to see our research methodology and insights!

              Download Now

              Frequently Asked Questions

              Neurodiagnostics market growth will increase by $ 4042.13 mn during 2024-2028 .

              The Neurodiagnostics market is expected to grow at a CAGR of 8.01% during 2024-2028 .

              Neurodiagnostics market is segmented by Type( Diagnostic and imaging solutions, In-vitro diagnostics, In-vitro diagnostics) End-user( Diagnostic laboratories and imaging centers, Hospitals and surgery centers, Others)

              Advanced Brain Monitoring Inc., ANT Neuro, Bio Signal Group Corp., Cadwell Industries Inc., Canon Inc., Compumedics Ltd., ELMIKO BIOSIGNALS sp. z o.o., F. Hoffmann La Roche Ltd., FUJIFILM Corp., General Electric Co., Jordan NeuroScience, Koninklijke Philips N.V., Lifelines Neuro Company LLC, Mitsar Co. Ltd., Natus Medical Inc., neurocare group AG, Nihon Kohden Corp., NovaSignal Corp., QIAGEN NV, Siemens Healthineers AG are a few of the key vendors in the Neurodiagnostics market.

              Europe will register the highest growth rate of 36% among the other regions. Therefore, the Neurodiagnostics market in Europe is expected to garner significant business opportunities for the vendors during the forecast period.

              US, Germany, UK, China, Japan

              • Increasing prevalence of neurological disordersThe prevalence of neurological disorders such as brain tumors is the driving factor this market.
              • brain stroke is the driving factor this market.
              • epilepsy is the driving factor this market.
              • brain aneurysm is the driving factor this market.
              • sleep apnea is the driving factor this market.
              • MS is the driving factor this market.
              • and PD is the driving factor this market.
              • which are associated with the central and peripheral nervous systems is the driving factor this market.
              • is significantly increasing worldwide. These are either caused due to congenital defects in genes or chromosomal abnormalities. The symptoms of neurological disorders include seizures is the driving factor this market.
              • pain is the driving factor this market.
              • paralysis is the driving factor this market.
              • muscle weakness is the driving factor this market.
              • and neurological instability. The prevalence rate of neurological disorders is higher in people with diabetes mellitus is the driving factor this market.
              • obesity is the driving factor this market.
              • high blood pressure is the driving factor this market.
              • and hypertension and people addicted to smoking; the number of smoking people is also increasing significantly. Neurological disorders are the leading cause of disability is the driving factor this market.
              • and according to a 2020 Lancet paper is the driving factor this market.
              • neurological disorder is the second leading cause of death globally is the driving factor this market.
              • accounting for 9 million deaths a year. The increasing prevalence of neurological disorders will demand diagnostic treatment is the driving factor this market.
              • which is the driving factor this market.
              • in turn is the driving factor this market.
              • will drive the growth of the global neurodiagnostics market during the forecast period. is the driving factor this market.

              The Neurodiagnostics market vendors should focus on grabbing business opportunities from the Diagnostic and imaging solutions segment as it accounted for the largest market share in the base year.