Neurological Biomarkers Market Analysis North America, Europe, Asia, Rest of World (ROW) - US, Germany, UK, France, China - Size and Forecast 2024-2028

Neurological Biomarkers Market Analysis North America, Europe, Asia, Rest of World (ROW) - US, Germany, UK, France, China - Size and Forecast 2024-2028

Published: Feb 2024 175 Pages SKU: IRTNTR73380

Market Overview at a Glance

$7.82 B
Market Opportunity
13.01%
CAGR
12.2
YoY growth 2023-2024(%)

Neurological Biomarkers Market Size 2024-2028 

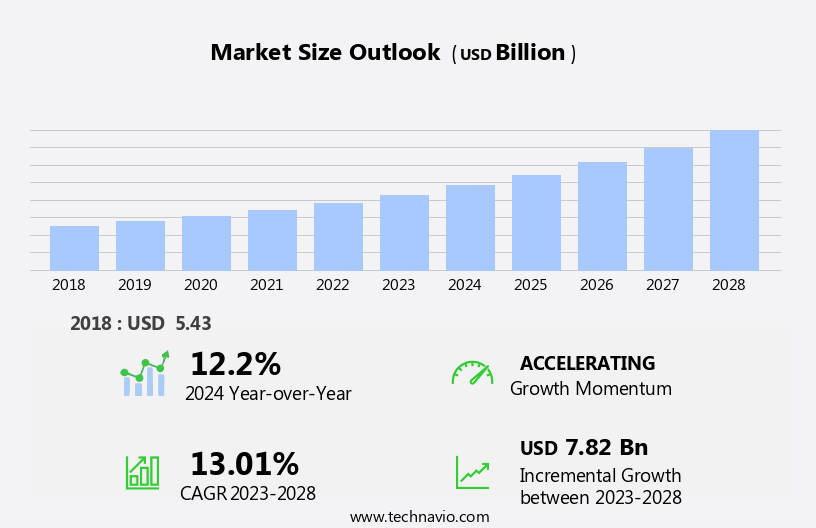
The neurological biomarkers market size is forecast to increase by USD 7.82 billion at a CAGR of 13.01% between 2023 and 2028.

  • The rising incidence of neurological disorders is the key driver of the neurological biomarkers market. Abbott Laboratories is a key player, offering neurological biomarkers like I-STAT Alinity, an easy-to-use, portable blood analyzer that provides real-time, lab-quality diagnostic test results. This innovative technology supports early diagnosis and effective management of neurological conditions, driving growth in the market as healthcare providers seek reliable tools to detect and monitor neurological disorders. 
  • Biomarkers play a crucial role In the early detection and diagnosis of neurological disorders, enabling timely intervention and improving patient outcomes. This trend is driving the need for advanced diagnostic tools to accurately identify and monitor neurological conditions, enabling precision medicine and targeted therapies. Additionally, advancements in technology and research are facilitating the development of novel biomarkers, further fueling market growth. Additionally, the integration of Assistive Technology (AT) into neuro-diagnostics is improving patient care, providing greater independence and enhanced quality of life for individuals with neurological disorders.

What will be the Size of the Neurological Biomarkers Market During the Forecast Period?

Neurological Biomarkers Market Size

 Request Free Sample

  • The market encompasses the science and technology behind identifying and measuring various indicators of brain function and injury, including those related to Parkinson's, Alzheimer's, cognitive decline, and other neurological disorders. This market is driven by the growing need for accurate and early diagnosis, effective treatment, and improved patient care. Neurological biomarkers play a crucial role in various applications, such as disease screening, assessment, rehabilitation, research, and advocacy. They are used by specialists in medicine, care providers, and researchers to aid In the management and prevention of neurological disorders. Blood-based biomarkers, CSF (cerebrospinal fluid) analysis, and imaging techniques are among the most common methods for identifying neurological biomarkers.
  • Innovation in this field is fueled by funding, policy, and training initiatives, as well as the increasing impact of neurological disorders on global health and healthcare systems. Neurological biomarkers are also essential for the development of new treatments and therapies, and for supporting the recovery and rehabilitation of brain injury patients. The utilization of digital biomarkers and blood-based biomarkers, in particular, has gained significant attention due to their accessibility, ease of collection, and potential for rapid testing. The market is expected to continue growing as research advances and the importance of early diagnosis and effective treatment becomes increasingly recognized.

How is this Neurological Biomarkers Industry segmented and which is the largest segment?

The neurological biomarkers industry research report provides comprehensive data (region-wise segment analysis), with forecasts and estimates in "USD billion" for the period 2024-2028, as well as historical data from 2018-2022 for the following segments. 

  • End-user
    • Hospitals
    • Clinical diagnostic centers
    • Research organizations and others
  • Indication
    • AD
    • PD
    • ASD
    • MS
    • Others
  • Type
    • Genomic
    • Proteomic
    • Metabolomic
    • Imaging
    • Others
  • Geography
    • North America
      • US
    • Europe
      • Germany
      • UK
      • France
    • Asia
      • China
    • Rest of World (ROW)

By End-user Insights

The hospitals segment is estimated to witness significant growth during the forecast period. Neurological biomarkers play a crucial role In the diagnosis, detection, and treatment of various neurological disorders, including major depressive disorder, sleep biomarkers for stroke and dementia, neurofilament light protein (NfL) for sports-related concussion, and protein tau181 for neurodegenerative diseases. Biomarkers are identified through techniques such as immunoblotting, antigen-antibody binding, and gene expression analysis in cerebrospinal fluid and brain imaging. Neurological biomarkers are essential in clinical research for the development of therapeutic targets and predictive biomarkers for disorders such as brain aging, traumatic brain injury, autism, brain tumors, and cardiovascular illnesses. Neurological biomarkers aid In the identification of genetic flaws and metabolic illnesses, providing valuable insights into the biological processes underlying these ailments.

Furthermore, hospitals, particularly large multispecialty hospitals and hospital groups, are the primary end-users of neurological biomarkers due to the high number of hospital admissions for neurological disorders. Medium-sized hospitals often require outsourced medical equipment and laboratory testing support for their healthcare services, further increasing the demand for neurological biomarkers.

Neurological Biomarkers Market Size

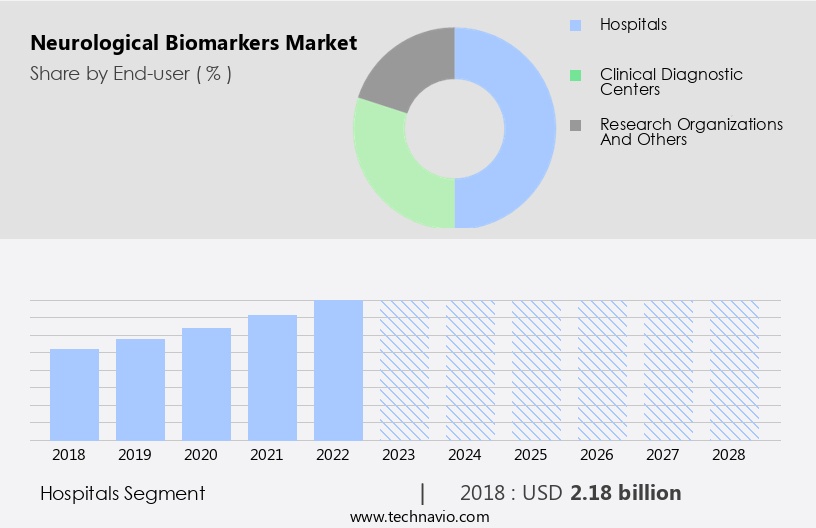
Get a glance at the share of various segments. Request Free Sample

The hospitals segment was valued at USD 2.18 billion in 2018 and showed a gradual increase during the forecast period.

Regional Analysis

North America is estimated to contribute 40% to the growth of the global market during the forecast period. Technavio's analysts have elaborately explained the regional trends and drivers that shape the market during the forecast period.

Neurological Biomarkers Market Share by Geography

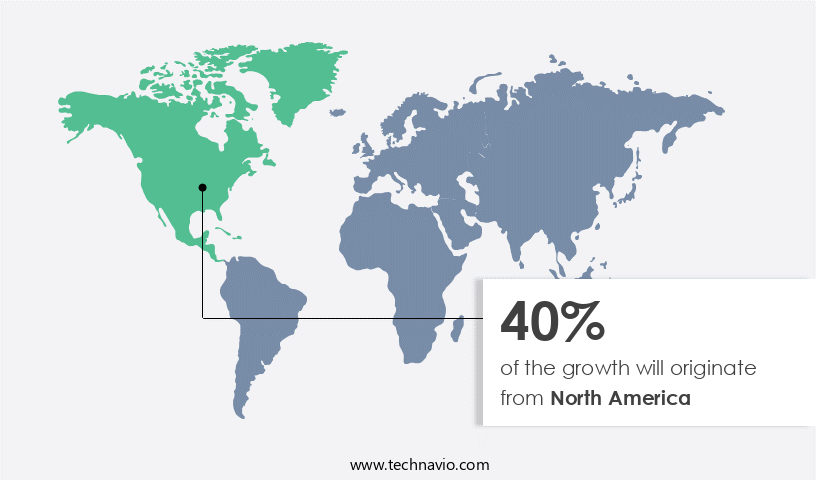
For more insights on the market share of various regions, Request Free Sample

Neurological biomarkers play a pivotal role In the diagnosis and treatment of various neurological disorders, including major depressive disorder, sleep biomarkers for stroke and dementia, neurofilament light protein (NfL) for sports-related concussion, and p-tau181 for neurodegenerative diseases. Biomarkers such as NfL and p-tau181 can be detected through spinal fluid tests, brain imaging, and gene expression analysis. Neurological biomarkers are also used In the investigation of brain aging, traumatic brain injury, autism, brain tumors, and cardiovascular illnesses. Techniques such as immunoblotting and antigen-antibody binding are employed for the detection of these biomarkers. The identification of genetic flaws through the human genome project and in-vitro investigation are crucial for therapeutic target development and predictive biomarkers.

Furthermore, the high prevalence of neurological disorders, the growing aging population, and healthcare expenditure on the treatment of neurological diseases, coupled with favorable reimbursement policies for neuro-diagnostic procedures, are expected to fuel market growth during the forecast period. Consequently, the development of neurological biomarkers and cardiac biomarkers has emerged as a promising solution. Neurological biomarkers are essential for clinical research and the development of new treatments for various neurological ailments.

Market Dynamics

Our neurological biomarkers market researchers analyzed the data with 2023 as the base year, along with the key drivers, trends, and challenges. A holistic analysis of drivers will help companies refine their marketing strategies to gain a competitive advantage.

What are the key market drivers leading to the rise In the adoption of Neurological Biomarkers Industry?

The rising incidence of neurological disorders is the key driver of the market.

  • Neurological disorders, such as major depressive disorder, sleep biomarkers, traumatic brain injury including sports-related concussion, dementia, neurodegenerative diseases, autism, and brain tumors, pose significant health challenges. These disorders can lead to disabilities, impairments, and even death. Neurofilament Light Protein (NfL) and p-tau181 are emerging biomarkers used for detection and diagnosis of neurological disorders. Spinal fluid tests using immunoblotting and antigen-antibody binding techniques are utilized for NfL and p-tau181 measurement. Brain aging, metabolic illnesses, and genetic flaws are among the biological processes involved in neurological disorders. Clinical research focuses on the treatment of these disorders through therapeutic target development, predictive biomarkers, and gene expression studies.
  • Neurofilament proteins, such as NfL, are valuable in understanding the biological mechanisms of neurological disorders. Real-time PCR and gene identification are essential in-vitro investigation techniques. Neurological disorders, including brain damage from disorders like stroke and brain imaging findings, can be indicative of various neurological ailments. Biomarkers play a crucial role in diagnosing and monitoring the progression of neurological disorders, enabling effective treatment strategies.

What are the market trends shaping the Neurological Biomarkers Industry?

Increasing focus on accurate neurological diagnostics is the upcoming market trend.

  • Neurological disorders, including major depressive disorder, sleep biomarkers for various conditions, stroke, dementia, and traumatic brain injuries such as sports-related concussions, pose significant challenges in accurate detection and diagnosis. Traditional methods like brain imaging and spinal fluid tests using immunoblotting and antigen-antibody binding techniques have limitations. For instance, brain imaging may not provide clear results In the early stages of brain damage, while spinal fluid tests can be invasive and time-consuming. To address these challenges, researchers are focusing on identifying neurofilament proteins, such as Neurofilament Light Protein (NfL) and ptau181, as potential biomarkers. These proteins are released into the bloodstream during neurodegenerative processes and can be detected through real-time PCR and other metabolic assays like P450 inhibition assays.
  • The identification of these biomarkers can lead to the development of predictive biomarkers for various neurological disorders, including brain aging, neurodegenerative diseases, and cardiovascular illnesses. Furthermore, understanding the underlying biological processes of these disorders can pave the way for the treatment of ailments and the development of therapeutic targets. Gene expression studies and in-vitro investigations are also crucial In the identification of genetic flaws associated with neurological disorders. These findings can provide valuable insights into the disease mechanisms and aid In the development of targeted therapies. 

What challenges does the Neurological Biomarkers Industry face during its growth?

Unmet market needs for effective validation of biomarkers is a key challenge affecting the industry growth.

  • Neurological biomarkers have gained significant attention in clinical research due to their potential role In the detection and treatment of various neurological disorders, including major depressive disorder, sleep biomarkers for stroke and dementia, traumatic brain injury from sports-related concussion, neurodegenerative diseases such as autism and brain tumors, and brain aging. Biomarkers like Neurofilament Light Protein (NfL) and p-tau181 are commonly used in spinal fluid tests for diagnosing these conditions. However, the validation of these biomarkers faces challenges, such as the need for convincing clinical and financial advantages, reproduction of positive clinical trial results, lack of early pre-analytical examinations, absence of autonomous result checks, and uncertainty about whether their use would improve clinical practice for neuro patients.
  • Fluid-based proteomics, a promising approach for early detection, remains costly and requires innovative techniques for unlocking its full potential. Neurofilament proteins, gene expression, and metabolic changes are among the biological processes under investigation for developing predictive biomarkers. In-vitro investigation and gene identification play crucial roles In therapeutic target development. Despite these challenges, neurological biomarkers hold immense potential for improving the diagnosis and treatment of various neurological ailments.

Exclusive Customer Landscape

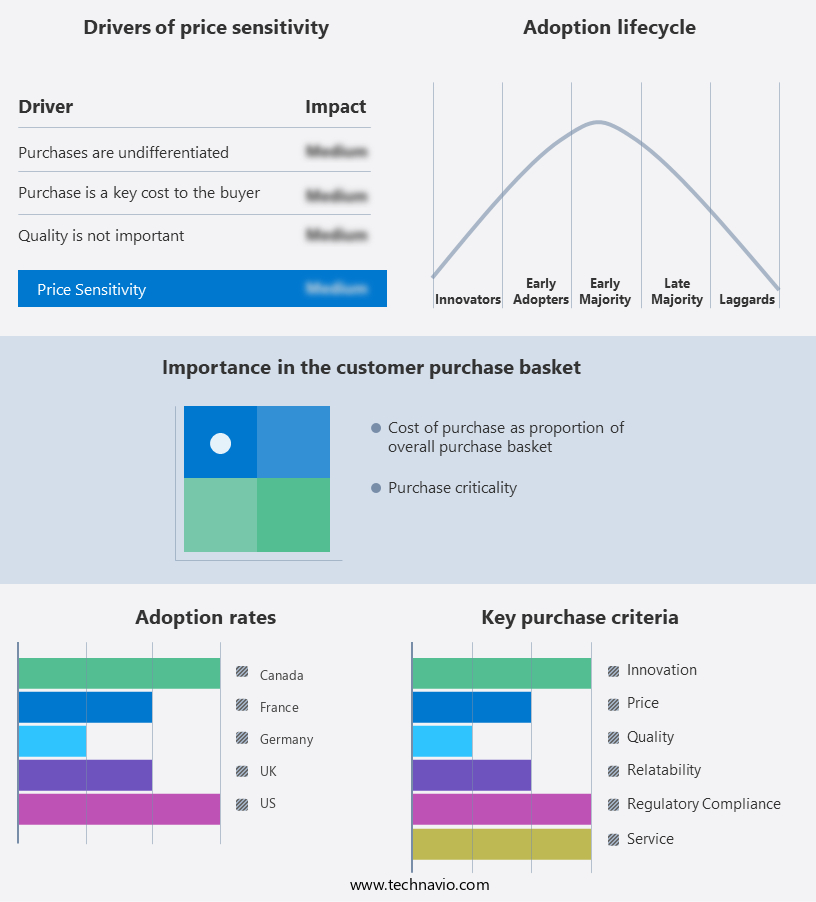
The neurological biomarkers market forecasting report includes the adoption lifecycle of the market, covering from the innovator's stage to the laggard's stage. It focuses on adoption rates in different regions based on penetration. Furthermore, the neurological biomarkers market report also includes key purchase criteria and drivers of price sensitivity to help companies evaluate and develop their market growth analysis strategies.

Neurological Biomarkers Market Share by Geography

 Customer Landscape

Key Companies & Market Insights

Companies are implementing various strategies, such as strategic alliances, neurological biomarkers market forecast, partnerships, mergers and acquisitions, geographical expansion, and product/service launches, to enhance their presence In the industry.

The industry research and growth report includes detailed analyses of the competitive landscape of the market and information about key companies, including:

  • Abbott Laboratories
  • ACROBIOSYSTEMS INC.
  • Advanced Brain Monitoring Inc.
  • Alseres Pharmaceuticals Inc
  • Bio Rad Laboratories Inc.
  • bioMerieux SA
  • Charles River Laboratories International Inc.
  • EATRIS ERIC
  • Eli Lilly and Co.
  • Enzo Biochem Inc.
  • F. Hoffmann La Roche Ltd.
  • Fujirebio Holdings Inc.
  • IQVIA Holdings Inc.
  • Merck KGaA
  • Metabolon Inc.
  • PerkinElmer Inc
  • Proteome Sciences plc
  • QIAGEN NV
  • Quanterix Corp.
  • Thermo Fisher Scientific Inc.

Qualitative and quantitative analysis of companies has been conducted to help clients understand the wider business environment as well as the strengths and weaknesses of key industry players. Data is qualitatively analyzed to categorize companies as pure play, category-focused, industry-focused, and diversified; it is quantitatively analyzed to categorize companies as dominant, leading, strong, tentative, and weak.

Research Analyst Overview

Neurological biomarkers have emerged as crucial indicators of various neurological disorders and conditions, providing valuable insights into the biological processes underlying these ailments. These markers offer an objective and quantifiable means of detecting and monitoring neurological disorders, enabling more effective diagnosis and treatment. Neurofilament light protein (NFL) is one of the most extensively studied neurological biomarkers. NFL is a neuronal protein that is released into the cerebrospinal fluid (CSF) and blood following injury or damage to nerve axons. Elevated levels of NFL have been associated with major depressive disorder, sleep biomarkers, stroke, dementia, traumatic brain injury, sports-related concussion, brain aging, and neurodegenerative diseases.

Another promising area of research is the use of biomarkers for the detection of brain tumors. Ptau181, a tau protein isoform, has been identified as a potential biomarker for glioblastoma, the most common and aggressive primary brain tumor. Spinal fluid tests using immunoblotting and antigen-antibody binding techniques have been employed to detect Ptau181 in patients with glioblastoma. Biomarkers also play a crucial role In the diagnosis and monitoring of metabolic and cardiovascular illnesses. For instance, P450 inhibition assays have been used to identify genetic flaws In the metabolism of certain drugs, which can lead to adverse reactions and cardiovascular complications.

Moreover, real-time PCR (polymerase chain reaction) and gene expression analysis have been employed in clinical research to identify the underlying genetic causes of various neurological disorders. The use of neurological biomarkers In the treatment of disorders is an active area of research. For example, biomarkers can be used to identify therapeutic targets for the development of new treatments for neurological conditions. Predictive biomarkers can also be used to identify individuals at risk of developing certain neurological disorders, enabling early intervention and prevention. Immunological biomarkers have also gained significant attention In the field of neurology. For instance, the identification of specific antibodies In the CSF has been used to diagnose autoimmune disorders such as multiple sclerosis and Guillain-Barré syndrome.

Neurological Biomarkers Market Scope

Report Coverage

Details

Page number

175

Base year

2023

Historic period

2018-2022

Forecast period

2024-2028

Growth momentum & CAGR

Accelerate at a CAGR of 13.01%

Market Growth 2024-2028

USD 7.82 billion

Market structure

Fragmented

YoY growth 2023-2024(%)

12.2

Key countries

US, Germany, UK, France, and China

Competitive landscape

Leading Companies, Market Positioning of Companies, Competitive Strategies, and Industry Risks

Request Free Sample

What are the Key Data Covered in this Neurological Biomarkers Market Research and Growth Report?

  • CAGR of the industry during the forecast period
  • Detailed information on factors that will drive the market growth and forecasting between 2024 and 2028
  • Precise estimation of the size of the market and its contribution of the industry in focus to the parent market
  • Accurate predictions about upcoming growth and trends and changes in consumer behaviour
  • Growth of the market across North America, Europe, Asia, and Rest of World (ROW)
  • Thorough analysis of the market's competitive landscape and detailed information about companies
  • Comprehensive analysis of factors that will challenge the market growth of industry companies

We can help! Our analysts can customize this market research report to meet your requirements.

Get in touch

1 Executive Summary

  • 1.1 Market overview
    • Exhibit 01: Executive Summary – Chart on Market Overview
    • Exhibit 02: Executive Summary – Data Table on Market Overview
    • Exhibit 03: Executive Summary – Chart on Global Market Characteristics
    • Exhibit 04: Executive Summary – Chart on Market by Geography
    • Exhibit 05: Executive Summary – Chart on Market Segmentation by End-user
    • Exhibit 06: Executive Summary – Chart on Market Segmentation by Indication
    • Exhibit 07: Executive Summary – Chart on Incremental Growth
    • Exhibit 08: Executive Summary – Data Table on Incremental Growth
    • Exhibit 09: Executive Summary – Chart on Vendor Market Positioning

2 Market Landscape

  • 2.1 Market ecosystem
    • Exhibit 10: Parent market
    • Exhibit 11: Market Characteristics

3 Market Sizing

  • 3.1 Market definition
    • Exhibit 12: Offerings of vendors included in the market definition
  • 3.2 Market segment analysis
    • Exhibit 13: Market segments
  • 3.3 Market size 2023
    • 3.4 Market outlook: Forecast for 2023-2028
      • Exhibit 14: Chart on Global - Market size and forecast 2023-2028 ($ million)
      • Exhibit 15: Data Table on Global - Market size and forecast 2023-2028 ($ million)
      • Exhibit 16: Chart on Global Market: Year-over-year growth 2023-2028 (%)
      • Exhibit 17: Data Table on Global Market: Year-over-year growth 2023-2028 (%)

    4 Historic Market Size

    • 4.1 Global neurological biomarkers market 2018 - 2022
      • Exhibit 18: Historic Market Size – Data Table on global neurological biomarkers market 2018 - 2022 ($ million)
    • 4.2 End-user Segment Analysis 2018 - 2022
      • Exhibit 19: Historic Market Size – End-user Segment 2018 - 2022 ($ million)
    • 4.3 Indication Segment Analysis 2018 - 2022
      • Exhibit 20: Historic Market Size – Indication Segment 2018 - 2022 ($ million)
    • 4.4 Geography Segment Analysis 2018 - 2022
      • Exhibit 21: Historic Market Size – Geography Segment 2018 - 2022 ($ million)
    • 4.5 Country Segment Analysis 2018 - 2022
      • Exhibit 22: Historic Market Size – Country Segment 2018 - 2022 ($ million)

    5 Five Forces Analysis

    • 5.1 Five forces summary
      • Exhibit 23: Five forces analysis - Comparison between 2023 and 2028
    • 5.2 Bargaining power of buyers
      • Exhibit 24: Chart on Bargaining power of buyers – Impact of key factors 2023 and 2028
    • 5.3 Bargaining power of suppliers
      • Exhibit 25: Bargaining power of suppliers – Impact of key factors in 2023 and 2028
    • 5.4 Threat of new entrants
      • Exhibit 26: Threat of new entrants – Impact of key factors in 2023 and 2028
    • 5.5 Threat of substitutes
      • Exhibit 27: Threat of substitutes – Impact of key factors in 2023 and 2028
    • 5.6 Threat of rivalry
      • Exhibit 28: Threat of rivalry – Impact of key factors in 2023 and 2028
    • 5.7 Market condition
      • Exhibit 29: Chart on Market condition - Five forces 2023 and 2028

    6 Market Segmentation by End-user

    • 6.1 Market segments
      • Exhibit 30: Chart on End-user - Market share 2023-2028 (%)
      • Exhibit 31: Data Table on End-user - Market share 2023-2028 (%)
    • 6.2 Comparison by End-user
      • Exhibit 32: Chart on Comparison by End-user
      • Exhibit 33: Data Table on Comparison by End-user
    • 6.3 Hospitals - Market size and forecast 2023-2028
      • Exhibit 34: Chart on Hospitals - Market size and forecast 2023-2028 ($ million)
      • Exhibit 35: Data Table on Hospitals - Market size and forecast 2023-2028 ($ million)
      • Exhibit 36: Chart on Hospitals - Year-over-year growth 2023-2028 (%)
      • Exhibit 37: Data Table on Hospitals - Year-over-year growth 2023-2028 (%)
    • 6.4 Clinical diagnostic centers - Market size and forecast 2023-2028
      • Exhibit 38: Chart on Clinical diagnostic centers - Market size and forecast 2023-2028 ($ million)
      • Exhibit 39: Data Table on Clinical diagnostic centers - Market size and forecast 2023-2028 ($ million)
      • Exhibit 40: Chart on Clinical diagnostic centers - Year-over-year growth 2023-2028 (%)
      • Exhibit 41: Data Table on Clinical diagnostic centers - Year-over-year growth 2023-2028 (%)
    • 6.5 Research organizations and others - Market size and forecast 2023-2028
      • Exhibit 42: Chart on Research organizations and others - Market size and forecast 2023-2028 ($ million)
      • Exhibit 43: Data Table on Research organizations and others - Market size and forecast 2023-2028 ($ million)
      • Exhibit 44: Chart on Research organizations and others - Year-over-year growth 2023-2028 (%)
      • Exhibit 45: Data Table on Research organizations and others - Year-over-year growth 2023-2028 (%)
    • 6.6 Market opportunity by End-user
      • Exhibit 46: Market opportunity by End-user ($ million)
      • Exhibit 47: Data Table on Market opportunity by End-user ($ million)

    7 Market Segmentation by Indication

    • 7.1 Market segments
      • Exhibit 48: Chart on Indication - Market share 2023-2028 (%)
      • Exhibit 49: Data Table on Indication - Market share 2023-2028 (%)
    • 7.2 Comparison by Indication
      • Exhibit 50: Chart on Comparison by Indication
      • Exhibit 51: Data Table on Comparison by Indication
    • 7.3 AD - Market size and forecast 2023-2028
      • Exhibit 52: Chart on AD - Market size and forecast 2023-2028 ($ million)
      • Exhibit 53: Data Table on AD - Market size and forecast 2023-2028 ($ million)
      • Exhibit 54: Chart on AD - Year-over-year growth 2023-2028 (%)
      • Exhibit 55: Data Table on AD - Year-over-year growth 2023-2028 (%)
    • 7.4 PD - Market size and forecast 2023-2028
      • Exhibit 56: Chart on PD - Market size and forecast 2023-2028 ($ million)
      • Exhibit 57: Data Table on PD - Market size and forecast 2023-2028 ($ million)
      • Exhibit 58: Chart on PD - Year-over-year growth 2023-2028 (%)
      • Exhibit 59: Data Table on PD - Year-over-year growth 2023-2028 (%)
    • 7.5 ASD - Market size and forecast 2023-2028
      • Exhibit 60: Chart on ASD - Market size and forecast 2023-2028 ($ million)
      • Exhibit 61: Data Table on ASD - Market size and forecast 2023-2028 ($ million)
      • Exhibit 62: Chart on ASD - Year-over-year growth 2023-2028 (%)
      • Exhibit 63: Data Table on ASD - Year-over-year growth 2023-2028 (%)
    • 7.6 MS - Market size and forecast 2023-2028
      • Exhibit 64: Chart on MS - Market size and forecast 2023-2028 ($ million)
      • Exhibit 65: Data Table on MS - Market size and forecast 2023-2028 ($ million)
      • Exhibit 66: Chart on MS - Year-over-year growth 2023-2028 (%)
      • Exhibit 67: Data Table on MS - Year-over-year growth 2023-2028 (%)
    • 7.7 Others - Market size and forecast 2023-2028
      • Exhibit 68: Chart on Others - Market size and forecast 2023-2028 ($ million)
      • Exhibit 69: Data Table on Others - Market size and forecast 2023-2028 ($ million)
      • Exhibit 70: Chart on Others - Year-over-year growth 2023-2028 (%)
      • Exhibit 71: Data Table on Others - Year-over-year growth 2023-2028 (%)
    • 7.8 Market opportunity by Indication
      • Exhibit 72: Market opportunity by Indication ($ million)
      • Exhibit 73: Data Table on Market opportunity by Indication ($ million)

    8 Market Segmentation by Type

    • 8.1 Market segments
      • Chart on Type - Market share (2023-2028) (%)
      • Data Table on Type - Market share (2023-2028) (%)
    • 8.2 Comparison by Type
      • Chart on Comparison by Type
      • Data Table on Comparison by Type
    • 8.3 Genomic - Market size and forecast (2023-2028)
      • Chart on Genomic - Market size and forecast (2023-2028) ($ million)
      • Data Table on Genomic - Market size and forecast (2023-2028) ($ million)
      • Chart on Genomic - Year-over-year growth (2023-2028) (%)
      • Data Table on Genomic - Year-over-year growth (2023-2028) (%)
    • 8.4 Proteomic - Market size and forecast (2023-2028)
      • Chart on Proteomic - Market size and forecast (2023-2028) ($ million)
      • Data Table on Proteomic - Market size and forecast (2023-2028) ($ million)
      • Chart on Proteomic - Year-over-year growth (2023-2028) (%)
      • Data Table on Proteomic - Year-over-year growth (2023-2028) (%)
    • 8.5 Metabolomic - Market size and forecast (2023-2028)
      • Chart on Metabolomic - Market size and forecast (2023-2028) ($ million)
      • Data Table on Metabolomic - Market size and forecast (2023-2028) ($ million)
      • Chart on Metabolomic - Year-over-year growth (2023-2028) (%)
      • Data Table on Metabolomic - Year-over-year growth (2023-2028) (%)
    • 8.6 Imaging - Market size and forecast (2023-2028)
      • Chart on Imaging - Market size and forecast (2023-2028) ($ million)
      • Data Table on Imaging - Market size and forecast (2023-2028) ($ million)
      • Chart on Imaging - Year-over-year growth (2023-2028) (%)
      • Data Table on Imaging - Year-over-year growth (2023-2028) (%)
    • 8.7 Others - Market size and forecast (2023-2028)
      • Chart on Others - Market size and forecast (2023-2028) ($ million)
      • Data Table on Others - Market size and forecast (2023-2028) ($ million)
      • Chart on Others - Year-over-year growth (2023-2028) (%)
      • Data Table on Others - Year-over-year growth (2023-2028) (%)
    • 8.8 Market opportunity by Type
      • Market opportunity by $segment_name ($ million)
      • Data Table on Market opportunity by $segment_name ($ million)

    8 Customer Landscape

    • 8.1 Customer landscape overview
      • Exhibit 74: Analysis of price sensitivity, lifecycle, customer purchase basket, adoption rates, and purchase criteria

    9 Geographic Landscape

    • 9.1 Geographic segmentation
      • Exhibit 75: Chart on Market share by geography 2023-2028 (%)
      • Exhibit 76: Data Table on Market share by geography 2023-2028 (%)
    • 9.2 Geographic comparison
      • Exhibit 77: Chart on Geographic comparison
      • Exhibit 78: Data Table on Geographic comparison
    • 9.3 North America - Market size and forecast 2023-2028
      • Exhibit 79: Chart on North America - Market size and forecast 2023-2028 ($ million)
      • Exhibit 80: Data Table on North America - Market size and forecast 2023-2028 ($ million)
      • Exhibit 81: Chart on North America - Year-over-year growth 2023-2028 (%)
      • Exhibit 82: Data Table on North America - Year-over-year growth 2023-2028 (%)
    • 9.4 Europe - Market size and forecast 2023-2028
      • Exhibit 83: Chart on Europe - Market size and forecast 2023-2028 ($ million)
      • Exhibit 84: Data Table on Europe - Market size and forecast 2023-2028 ($ million)
      • Exhibit 85: Chart on Europe - Year-over-year growth 2023-2028 (%)
      • Exhibit 86: Data Table on Europe - Year-over-year growth 2023-2028 (%)
    • 9.5 Asia - Market size and forecast 2023-2028
      • Exhibit 87: Chart on Asia - Market size and forecast 2023-2028 ($ million)
      • Exhibit 88: Data Table on Asia - Market size and forecast 2023-2028 ($ million)
      • Exhibit 89: Chart on Asia - Year-over-year growth 2023-2028 (%)
      • Exhibit 90: Data Table on Asia - Year-over-year growth 2023-2028 (%)
    • 9.6 Rest of World (ROW) - Market size and forecast 2023-2028
      • Exhibit 91: Chart on Rest of World (ROW) - Market size and forecast 2023-2028 ($ million)
      • Exhibit 92: Data Table on Rest of World (ROW) - Market size and forecast 2023-2028 ($ million)
      • Exhibit 93: Chart on Rest of World (ROW) - Year-over-year growth 2023-2028 (%)
      • Exhibit 94: Data Table on Rest of World (ROW) - Year-over-year growth 2023-2028 (%)
    • 9.7 US - Market size and forecast 2023-2028
      • Exhibit 95: Chart on US - Market size and forecast 2023-2028 ($ million)
      • Exhibit 96: Data Table on US - Market size and forecast 2023-2028 ($ million)
      • Exhibit 97: Chart on US - Year-over-year growth 2023-2028 (%)
      • Exhibit 98: Data Table on US - Year-over-year growth 2023-2028 (%)
    • 9.8 Germany - Market size and forecast 2023-2028
      • Exhibit 99: Chart on Germany - Market size and forecast 2023-2028 ($ million)
      • Exhibit 100: Data Table on Germany - Market size and forecast 2023-2028 ($ million)
      • Exhibit 101: Chart on Germany - Year-over-year growth 2023-2028 (%)
      • Exhibit 102: Data Table on Germany - Year-over-year growth 2023-2028 (%)
    • 9.9 UK - Market size and forecast 2023-2028
      • Exhibit 103: Chart on UK - Market size and forecast 2023-2028 ($ million)
      • Exhibit 104: Data Table on UK - Market size and forecast 2023-2028 ($ million)
      • Exhibit 105: Chart on UK - Year-over-year growth 2023-2028 (%)
      • Exhibit 106: Data Table on UK - Year-over-year growth 2023-2028 (%)
    • 9.10 China - Market size and forecast 2023-2028
      • Exhibit 107: Chart on China - Market size and forecast 2023-2028 ($ million)
      • Exhibit 108: Data Table on China - Market size and forecast 2023-2028 ($ million)
      • Exhibit 109: Chart on China - Year-over-year growth 2023-2028 (%)
      • Exhibit 110: Data Table on China - Year-over-year growth 2023-2028 (%)
    • 9.11 France - Market size and forecast 2023-2028
      • Exhibit 111: Chart on France - Market size and forecast 2023-2028 ($ million)
      • Exhibit 112: Data Table on France - Market size and forecast 2023-2028 ($ million)
      • Exhibit 113: Chart on France - Year-over-year growth 2023-2028 (%)
      • Exhibit 114: Data Table on France - Year-over-year growth 2023-2028 (%)
    • 9.12 Market opportunity by geography
      • Exhibit 115: Market opportunity by geography ($ million)
      • Exhibit 116: Data Tables on Market opportunity by geography ($ million)

    10 Drivers, Challenges, and Trends

    • 10.1 Market drivers
      • 10.2 Market challenges
        • 10.3 Impact of drivers and challenges
          • Exhibit 117: Impact of drivers and challenges in 2023 and 2028
        • 10.4 Market trends

          11 Vendor Landscape

          • 11.1 Overview
            • 11.2 Vendor landscape
              • Exhibit 118: Overview on Criticality of inputs and Factors of differentiation
            • 11.3 Landscape disruption
              • Exhibit 119: Overview on factors of disruption
            • 11.4 Industry risks
              • Exhibit 120: Impact of key risks on business

            12 Vendor Analysis

            • 12.1 Vendors covered
              • Exhibit 121: Vendors covered
            • 12.2 Market positioning of vendors
              • Exhibit 122: Matrix on vendor position and classification
            • 12.3 Abbott Laboratories
              • Exhibit 123: Abbott Laboratories - Overview
              • Exhibit 124: Abbott Laboratories - Business segments
              • Exhibit 125: Abbott Laboratories - Key news
              • Exhibit 126: Abbott Laboratories - Key offerings
              • Exhibit 127: Abbott Laboratories - Segment focus
            • 12.4 ACROBIOSYSTEMS INC.
              • Exhibit 128: ACROBIOSYSTEMS INC. - Overview
              • Exhibit 129: ACROBIOSYSTEMS INC. - Product / Service
              • Exhibit 130: ACROBIOSYSTEMS INC. - Key offerings
            • 12.5 Alseres Pharmaceuticals Inc
              • Exhibit 131: Alseres Pharmaceuticals Inc - Overview
              • Exhibit 132: Alseres Pharmaceuticals Inc - Product / Service
              • Exhibit 133: Alseres Pharmaceuticals Inc - Key offerings
            • 12.6 Bio Rad Laboratories Inc.
              • Exhibit 134: Bio Rad Laboratories Inc. - Overview
              • Exhibit 135: Bio Rad Laboratories Inc. - Business segments
              • Exhibit 136: Bio Rad Laboratories Inc. - Key news
              • Exhibit 137: Bio Rad Laboratories Inc. - Key offerings
              • Exhibit 138: Bio Rad Laboratories Inc. - Segment focus
            • 12.7 bioMerieux SA
              • Exhibit 139: bioMerieux SA - Overview
              • Exhibit 140: bioMerieux SA - Product / Service
              • Exhibit 141: bioMerieux SA - Key news
              • Exhibit 142: bioMerieux SA - Key offerings
            • 12.8 Eli Lilly and Co.
              • Exhibit 143: Eli Lilly and Co. - Overview
              • Exhibit 144: Eli Lilly and Co. - Product / Service
              • Exhibit 145: Eli Lilly and Co. - Key news
              • Exhibit 146: Eli Lilly and Co. - Key offerings
            • 12.9 F. Hoffmann La Roche Ltd.
              • Exhibit 147: F. Hoffmann La Roche Ltd. - Overview
              • Exhibit 148: F. Hoffmann La Roche Ltd. - Business segments
              • Exhibit 149: F. Hoffmann La Roche Ltd. - Key news
              • Exhibit 150: F. Hoffmann La Roche Ltd. - Key offerings
              • Exhibit 151: F. Hoffmann La Roche Ltd. - Segment focus
            • 12.10 IQVIA Holdings Inc.
              • Exhibit 152: IQVIA Holdings Inc. - Overview
              • Exhibit 153: IQVIA Holdings Inc. - Business segments
              • Exhibit 154: IQVIA Holdings Inc. - Key news
              • Exhibit 155: IQVIA Holdings Inc. - Key offerings
              • Exhibit 156: IQVIA Holdings Inc. - Segment focus
            • 12.11 Merck KGaA
              • Exhibit 157: Merck KGaA - Overview
              • Exhibit 158: Merck KGaA - Business segments
              • Exhibit 159: Merck KGaA - Key news
              • Exhibit 160: Merck KGaA - Key offerings
              • Exhibit 161: Merck KGaA - Segment focus
            • 12.12 Metabolon Inc.
              • Exhibit 162: Metabolon Inc. - Overview
              • Exhibit 163: Metabolon Inc. - Product / Service
              • Exhibit 164: Metabolon Inc. - Key offerings
            • 12.13 PerkinElmer Inc
              • Exhibit 165: PerkinElmer Inc - Overview
              • Exhibit 166: PerkinElmer Inc - Business segments
              • Exhibit 167: PerkinElmer Inc - Key news
              • Exhibit 168: PerkinElmer Inc - Key offerings
              • Exhibit 169: PerkinElmer Inc - Segment focus
            • 12.14 Proteome Sciences plc
              • Exhibit 170: Proteome Sciences plc - Overview
              • Exhibit 171: Proteome Sciences plc - Product / Service
              • Exhibit 172: Proteome Sciences plc - Key offerings
            • 12.15 QIAGEN NV
              • Exhibit 173: QIAGEN NV - Overview
              • Exhibit 174: QIAGEN NV - Product / Service
              • Exhibit 175: QIAGEN NV - Key news
              • Exhibit 176: QIAGEN NV - Key offerings
            • 12.16 Quanterix Corp.
              • Exhibit 177: Quanterix Corp. - Overview
              • Exhibit 178: Quanterix Corp. - Product / Service
              • Exhibit 179: Quanterix Corp. - Key offerings
            • 12.17 Thermo Fisher Scientific Inc.
              • Exhibit 180: Thermo Fisher Scientific Inc. - Overview
              • Exhibit 181: Thermo Fisher Scientific Inc. - Business segments
              • Exhibit 182: Thermo Fisher Scientific Inc. - Key news
              • Exhibit 183: Thermo Fisher Scientific Inc. - Key offerings
              • Exhibit 184: Thermo Fisher Scientific Inc. - Segment focus

            13 Appendix

            • 13.1 Scope of the report
              • 13.2 Inclusions and exclusions checklist
                • Exhibit 185: Inclusions checklist
                • Exhibit 186: Exclusions checklist
              • 13.3 Currency conversion rates for US$
                • Exhibit 187: Currency conversion rates for US$
              • 13.4 Research methodology
                • Exhibit 188: Research methodology
                • Exhibit 189: Validation techniques employed for market sizing
                • Exhibit 190: Information sources
              • 13.5 List of abbreviations
                • Exhibit 191: List of abbreviations

              Research Methodology

              Technavio presents a detailed picture of the market by way of study, synthesis, and summation of data from multiple sources. The analysts have presented the various facets of the market with a particular focus on identifying the key industry influencers. The data thus presented is comprehensive, reliable, and the result of extensive research, both primary and secondary.

              INFORMATION SOURCES

              Primary sources

              • Manufacturers and suppliers
              • Channel partners
              • Industry experts
              • Strategic decision makers

              Secondary sources

              • Industry journals and periodicals
              • Government data
              • Financial reports of key industry players
              • Historical data
              • Press releases

              DATA ANALYSIS

              Data Synthesis

              • Collation of data
              • Estimation of key figures
              • Analysis of derived insights

              Data Validation

              • Triangulation with data models
              • Reference against proprietary databases
              • Corroboration with industry experts

              REPORT WRITING

              Qualitative

              • Market drivers
              • Market challenges
              • Market trends
              • Five forces analysis

              Quantitative

              • Market size and forecast
              • Market segmentation
              • Geographical insights
              • Competitive landscape

              Interested in this report?

              Get your sample now to see our research methodology and insights!

              Download Now

              Frequently Asked Questions

              Neurological Biomarkers market growth will increase by $ 7.82 bn during 2024-2028.

              The Neurological Biomarkers market is expected to grow at a CAGR of 13.01% during 2024-2028.

              Neurological Biomarkers market is segmented by End-user( Hospitals, Clinical diagnostic centers, Research organizations and others, MS, Others) Indication( AD, PD, ASD, MS, Others)

              Abbott Laboratories, ACROBIOSYSTEMS INC., Advanced Brain Monitoring Inc., Alseres Pharmaceuticals Inc, Bio Rad Laboratories Inc., bioMerieux SA, Charles River Laboratories International Inc., EATRIS ERIC, Eli Lilly and Co., Enzo Biochem Inc., F. Hoffmann La Roche Ltd., Fujirebio Holdings Inc., IQVIA Holdings Inc., Merck KGaA, Metabolon Inc., PerkinElmer Inc, Proteome Sciences plc, QIAGEN NV, Quanterix Corp., Thermo Fisher Scientific Inc. are a few of the key vendors in the Neurological Biomarkers market.

              North America will register the highest growth rate of 40% among the other regions. Therefore, the Neurological Biomarkers market in North America is expected to garner significant business opportunities for the vendors during the forecast period.

              US, Germany, UK, France, China

              • Rising incidence of neurological disordersPatients with a comprehensive range of neurological disorders is the driving factor this market.
              • including epilepsy is the driving factor this market.
              • stroke is the driving factor this market.
              • Parkinsons disease is the driving factor this market.
              • and brain tumors is the driving factor this market.
              • have a high risk of developing a disability such as complete or partial paralysis. These disorders may also be fatal. These neurological disorders develop due to various factors such as bacterial and viral infections is the driving factor this market.
              • genetic factors is the driving factor this market.
              • and the lack of immune response. Parkinsons disease is one of the most common types of neurological diseases that affect the population. For instance is the driving factor this market.
              • in an article in Medical News Today is the driving factor this market.
              • published in August 2023 is the driving factor this market.
              • according to the Centers for Disease Control and Prevention (CDC) is the driving factor this market.
              • the prevalence of Parkinsons disease increased from 1% to 4% in the aging population of 60 years to 80 years. The prevalence of the disease is more common among the geriatric population. Moreover is the driving factor this market.
              • as per The Lancet Global Health Report 2021 is the driving factor this market.
              • the burden of non-communicable neurological disorders is increasing in India is the driving factor this market.
              • mainly due to the aging of the population. Stroke is the driving factor this market.
              • headache disorders is the driving factor this market.
              • and epilepsy are the leading contributors to neurological disorders burden in India. Therefore is the driving factor this market.
              • factors such as the increasing incidence and prevalence of various neurological disorders and the growing demand for the treatment of such disorders to save the lives of patients will contribute to the growth of the global neurological biomarkers market during the forecast period. The treatment of brain hemorrhage is the driving factor this market.
              • which occurs due to stroke and brain tumors is the driving factor this market.
              • is boosting the demand for neurological biomarkers. In September 2021 is the driving factor this market.
              • the CDC reported that 798 is the driving factor this market.
              • 000 people are affected by strokes in the US every year. A stroke can lead to malignant cerebral edema is the driving factor this market.
              • which leads to inadequate blood flow. This increases intracranial pressure and brain shift is the driving factor this market.
              • causing herniation syndrome and leading to brain death. These cases add to the demand for diagnosis of brain injuries. Thus is the driving factor this market.
              • the increase in the number of stroke cases and neurological disorders is expected to boost the growth of the global neurological biomarkers market during the forecast period. is the driving factor this market.

              The Neurological Biomarkers market vendors should focus on grabbing business opportunities from the Hospitals segment as it accounted for the largest market share in the base year.