Non-Gmo Animal Feed Market Analysis, Size, and Forecast 2024-2028: North America (US and Canada), Europe (France, Germany, Italy, and UK), Middle East and Africa (Egypt, KSA, Oman, and UAE), APAC (China, India, and Japan), South America (Argentina and Brazil), and Rest of World (ROW)

Non-Gmo Animal Feed Market Analysis, Size, and Forecast 2024-2028:
North America (US and Canada), Europe (France, Germany, Italy, and UK), Middle East and Africa (Egypt, KSA, Oman, and UAE), APAC (China, India, and Japan), South America (Argentina and Brazil), and Rest of World (ROW)

Published: Aug 2024 178 Pages SKU: IRTNTR45167

Market Overview at a Glance

$18.4 B
Market Opportunity
8.13%
CAGR
7.27
YoY growth 2023-2024(%)

Non-GMO Animal Feed Market Size 2024-2028

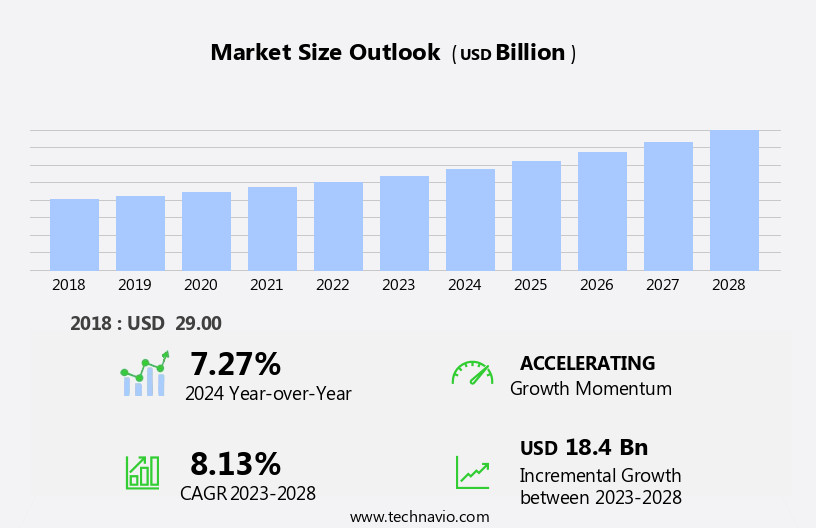
The non-GMO animal feed market size is forecast to increase by USD 18.4 billion, at a CAGR of 8.13% between 2023 and 2028.

  • The market is experiencing significant growth, driven by the increasing demand for non-genetically modified (GMO) products in animal feed. This trend is particularly noticeable in the sector focusing on sustainable alternatives to GM soy animal feed. The premium pricing of non-GMO feed, however, presents a notable challenge for market participants. Producers must carefully balance the potential for higher profit margins with the need to offer competitive pricing to remain attractive to customers. The market's dynamics are shaped by the growing consumer awareness and preference for non-GMO food products, which extends to the animal products they consume. Companies seeking to capitalize on this trend should focus on securing reliable sources for non-GMO feed ingredients and implementing efficient production processes to maintain profitability.
  • Additionally, collaborations and partnerships with farmers and suppliers can help ensure a steady supply chain and strengthen market position. The market offers substantial opportunities for growth, particularly for those able to navigate the challenges of premium pricing and supply chain management effectively.

What will be the Size of the Non-Gmo Animal Feed Market during the forecast period?

Non-Gmo Animal Feed Market Size

Explore in-depth regional segment analysis with market size data - historical 2018-2022 and forecasts 2024-2028 - in the full report.  
Request Free Sample

The market continues to evolve, driven by shifting consumer preferences and regulatory requirements. Animal feed formulation plays a crucial role in optimizing animal performance and ensuring product quality. Feed additives, with their composition carefully curated, support efficient nutrient utilization and enhance animal health. Non-GMO verification protocols are a priority, with rigorous testing and certification processes in place to maintain transparency and integrity. Egg production optimization and ingredient sourcing verification are essential components, ensuring traceability and sustainability. Protein source identification and feed formulation optimization are ongoing processes, with a focus on maximizing feed efficiency and improving milk production. Feed palatability testing and mycotoxin contamination levels are closely monitored to maintain animal health and safety.

Feed handling practices and storage conditions are critical for preserving feed quality and preventing antibiotic residue detection. Feed safety regulations are continually evolving, requiring feed manufacturers to adapt and innovate. Disease resistance assessment and sustainable feed production are increasingly important, with a growing emphasis on animal health indicators and organic feed certification. Digestibility testing and feed manufacturing process optimization are essential to ensure optimal nutritional value and meet the evolving needs of the industry.

How is this Non-Gmo Animal Feed Industry segmented?

The non-gmo animal feed industry research report provides comprehensive data (region-wise segment analysis), with forecasts and estimates in "USD billion" for the period 2024-2028, as well as historical data from 2018-2022 for the following segments.

  • Distribution Channel
    • Offline
    • Online
  • Product
    • Poultry
    • Swine
    • Ruminant
    • Aquaculture
    • Others
  • Form
    • Pellets
    • Mash
    • Crumbles
    • Powder
    • Liquids
  • Ingredient Type
    • Corn
    • Soybean Meal
    • Alfalfa
    • Barley
    • Oats
    • Wheat
    • Minerals
    • Vitamins
    • Amino Acids
    • Other Grains & Proteins
  • Nature
    • Organic Non-GMO
    • Conventional Non-GMO
  • Geography
    • North America
      • US
      • Canada
    • Europe
      • France
      • Germany
      • Italy
      • UK
    • Middle East and Africa
      • Egypt
      • KSA
      • Oman
      • UAE
    • APAC
      • China
      • India
      • Japan
    • South America
      • Argentina
      • Brazil
    • Rest of World (ROW)

By Distribution Channel Insights

The offline segment is estimated to witness significant growth during the forecast period.

Non-GMO animal feed distribution relies heavily on offline channels, catering to farmers and livestock owners preferring personal interactions or facing limited Internet connectivity. Traditional agricultural supply stores serve as primary distributors, offering a range of feed options and acting as one-stop shops for farmers' needs. Independent feed wholesalers and dealers specialize in non-GMO supplies, providing expert advice based on specific animal and dietary requirements. Bulk purchases are common among agricultural cooperatives and buying groups, enabling them to distribute non-GMO feed to their members efficiently. Feed efficiency analysis and precision livestock feeding are essential elements of non-GMO animal feed formulation.

Feed conversion ratio plays a significant role in milk production improvement, ensuring optimal use of resources. Feed preservation techniques extend the shelf life of non-GMO feed, reducing waste and maintaining nutritional value. Antibiotic residue detection and meat quality parameters are crucial for maintaining animal health and producing high-quality meat. Feed ingredient traceability is essential for ensuring the authenticity and safety of non-GMO feed sources. Feed additive composition and non-GMO verification protocols are critical for maintaining the integrity of non-GMO feed. Egg production optimization and ingredient sourcing verification are essential for poultry farmers. Protein source identification and feed formulation optimization ensure balanced diets for animals.

Feed palatability testing, mycotoxin contamination levels, growth rate measurement, and nutritional value assessment are essential for maintaining animal health and productivity. Supply chain transparency, feed handling practices, and animal performance metrics are crucial for ensuring the sustainability and efficiency of non-GMO animal feed production. Feed safety regulations, disease resistance assessment, and organic feed certification are essential for maintaining animal health and producing high-quality meat and eggs. Digestibility testing, feed storage conditions, and GMO testing methods ensure the nutritional value and purity of non-GMO feed.

Non-Gmo Animal Feed Market Size

Request Free Sample

The Offline segment was valued at USD 17.10 billion in 2018 and showed a gradual increase during the forecast period.

Regional Analysis

North America is estimated to contribute 38% to the growth of the global market during the forecast period.Technavio’s analysts have elaborately explained the regional trends and drivers that shape the market during the forecast period.

Non-Gmo Animal Feed Market Share by Geography

 Request Free Sample

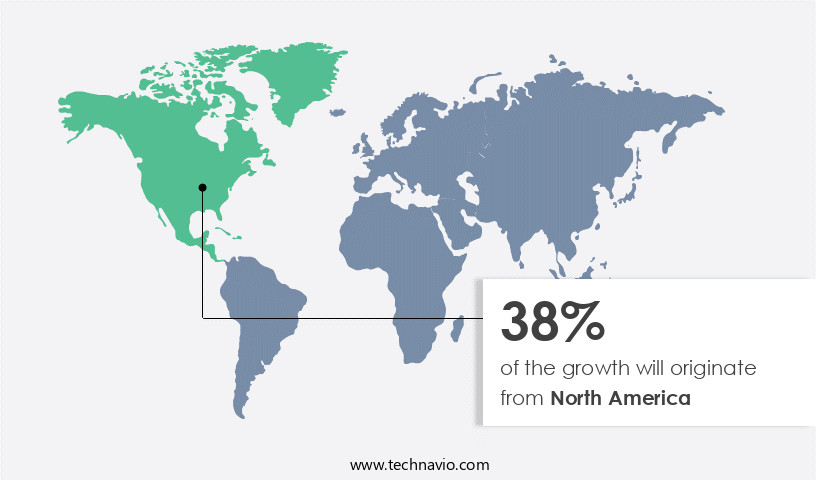
In North America, the animal feed market is experiencing a trend towards healthier and non-GMO feed products, driven by rising awareness of their benefits for livestock performance and health. The region's relatively lower animal feed prices, due to high production of feed crops like soy and corn, significantly impact the market. The US, as a leading producer of these crops, plays a crucial role. The increasing demand and consumption of meat products further fuel the market. Feed efficiency analysis and precision livestock feeding are essential for optimizing feed conversion ratio and milk production improvement. Feed preservation techniques ensure feed quality and longevity.

Antibiotic residue detection and meat quality parameters are critical for consumer safety and animal health. Feed ingredient traceability, animal feed formulation, and quality control measures ensure transparency and safety. Feed additive composition, non-GMO verification protocols, and protein source identification are key considerations for feed formulation optimization. Feed palatability testing, mycotoxin contamination levels, growth rate measurement, and nutritional value assessment are vital for animal performance metrics. Sustainable feed production, disease resistance assessment, and animal health indicators are essential for maintaining animal welfare and reducing production costs. Organic feed certification, feed manufacturing process, digestibility testing, feed storage conditions, and gmo testing methods further ensure feed safety and regulatory compliance.

Market Dynamics

The Non-GMO Animal Feed Market is expanding rapidly as farmers and pet owners prioritize sustainable, healthy options like Non-GMO poultry feed, Non-GMO cattle feed, and Non-GMO pet food. These products support Non-GMO feed for organic livestock and Non-GMO feed for animal health, meeting consumer demand for Non-GMO feed for consumer trust. Innovations such as Non-GMO feed sustainability and Non-GMO feed nutrient optimization enhance Non-GMO feed for animal performance, while Non-GMO feed processing equipment and Non-GMO feed quality control ensure consistent quality. Non-GMO feed for sustainable farming appeals to eco-conscious farmers, and Non-GMO feed for organic certification supports Non-GMO feed for ethical farming. Non-GMO feed traceability systems and Non-GMO feed clean label further boost market trust and growth.

Our researchers analyzed the data with 2023 as the base year, along with the key drivers, trends, and challenges. A holistic analysis of drivers will help companies refine their marketing strategies to gain a competitive advantage.

What are the key market drivers leading to the rise in the adoption of Non-Gmo Animal Feed Industry?

  • The increasing preference for non-Genetically Modified Organisms (GMO) products serves as the primary market catalyst. 
  • The market is experiencing significant growth due to increasing consumer demand for healthier alternatives to genetically modified (GM) feed products. companies are capitalizing on this trend to earn higher profits, with some profit margins reaching up to 40-50%. Consumers are concerned about the potential health and environmental risks associated with GM crops and animal-derived produce from GM-fed animals. As a result, many meat, egg, and dairy producers in various countries, including Germany and Italy, are transitioning to non-GMO feed to meet consumer demands. To enhance feed efficiency and optimize livestock feeding, precision feeding techniques are being adopted.
  • Feed conversion ratio is a critical metric used to evaluate the efficiency of feed utilization. Feed preservation techniques, such as the use of antioxidants and improved storage methods, are also essential to maintain feed quality and reduce waste. Milk production improvement is another key benefit of non-GMO feed. It is believed that non-GMO feed can lead to better milk quality parameters, such as improved taste, texture, and nutritional value. Antibiotic residue detection is also a significant concern in the livestock industry. Non-GMO feed can help reduce the use of antibiotics in livestock production, which can lead to better meat quality and consumer trust.
  • Feed ingredient traceability is also crucial in the market. companies are implementing strict supply chain management practices to ensure that all feed ingredients are sourced from non-GMO sources. This transparency builds trust with consumers and helps companies meet regulatory requirements.

What are the market trends shaping the Non-Gmo Animal Feed Industry?

  • The increasing prioritization of sustainable alternatives to genetically modified soy for use in animal feed represents a significant market trend. This shift towards more eco-friendly options reflects growing consumer awareness and concern for the environment.
  • Animal feed formulations play a crucial role in the agricultural industry, accounting for approximately 40-50% of global crop production. Major feed ingredients include soy, maize, cotton seeds, and oilseeds, with soy being the leading source due to its high protein content. However, genetically modified (GM) soybeans dominate global production, despite consumer concerns regarding GM crops in human food. To address this issue, non-GM animal feed has gained traction. Quality control measures and non-GM verification protocols are essential for feed formulation optimization and egg production enhancement. Ingredient sourcing verification and protein source identification are crucial components of non-GM feed production.
  • Feed additive composition must also adhere to non-GM standards to ensure product integrity. The demand for non-GM animal feed is driven by consumer preferences for non-GM food products, which has led to increased emphasis on the use of non-GM feed in livestock production. As a result, optimizing feed formulation and ensuring the highest quality standards are essential for animal health and productivity. By focusing on non-GM feed production, the industry can cater to the evolving needs of consumers and maintain the sustainability and integrity of the food chain.

What challenges does the Non-Gmo Animal Feed Industry face during its growth?

  • The premium pricing of non-GMO animal feed poses a significant challenge to the industry's growth trajectory. This cost factor, driven by the demand for non-genetically modified feed, represents a key obstacle that industry players must navigate to expand and thrive. 
  • Non-GMO animal feed is in high demand due to increasing consumer preference for healthier alternatives to genetically modified feed. This trend presents a lucrative opportunity for feed suppliers, with profit margins reaching up to 50% on non-GMO feed products. To meet this demand, suppliers pay farmers a premium of USD1.50 to USD2.00 per bushel above commodity prices for growing non-GMO crops. However, ensuring the authenticity of these claims requires rigorous testing for feed palatability, mycotoxin contamination levels, growth rate measurement, and nutritional value assessment.
  • Supply chain transparency and adherence to feed handling practices are also crucial to maintain animal performance metrics and feed safety regulations. These tests and practices add to the production costs, but they are essential to meet the expectations of health-conscious consumers and regulatory bodies.

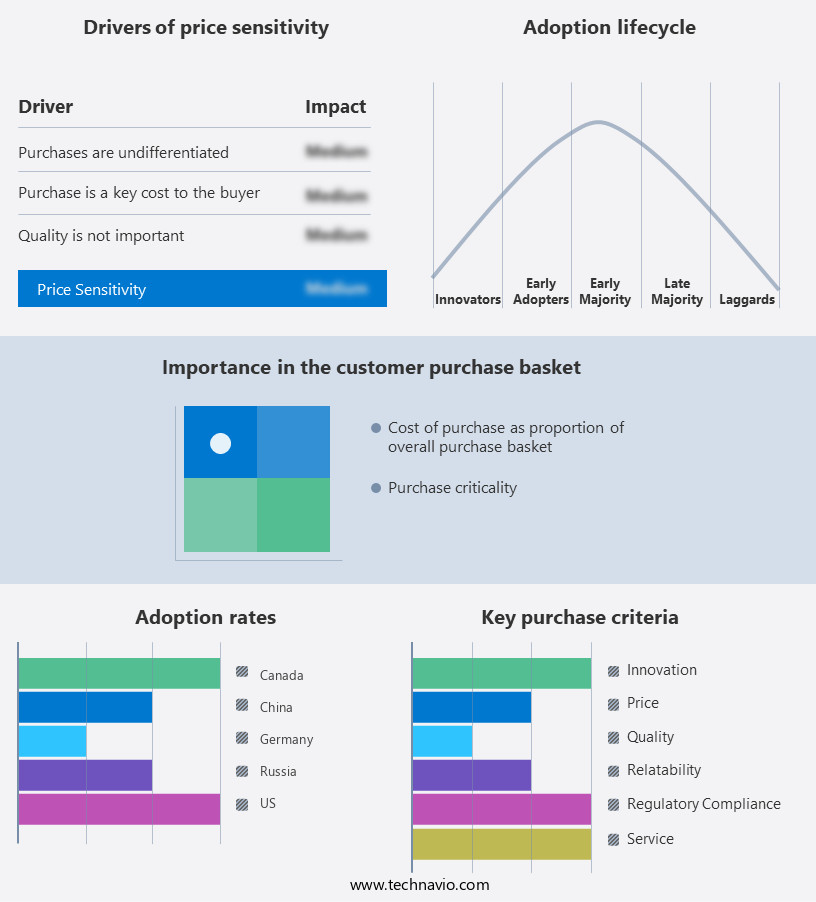
Exclusive Customer Landscape

The non-gmo animal feed market forecasting report includes the adoption lifecycle of the market, covering from the innovator’s stage to the laggard’s stage. It focuses on adoption rates in different regions based on penetration. Furthermore, the non-gmo animal feed market report also includes key purchase criteria and drivers of price sensitivity to help companies evaluate and develop their market growth analysis strategies.

Non-Gmo Animal Feed Market Share by Geography

 Customer Landscape

Key Companies & Market Insights

Companies are implementing various strategies, such as strategic alliances, non-gmo animal feed market forecast, partnerships, mergers and acquisitions, geographical expansion, and product/service launches, to enhance their presence in the industry.

Advanced Biological Concepts - This company specializes in providing non-GMO animal feed solutions, enhancing livestock production with advanced nutritional technology and innovative formulations. These offerings ensure optimal animal health, resulting in the creation of drug- and hormone-free meat and milk products. The company's focus on nutritional excellence drives industry innovation.

The industry research and growth report includes detailed analyses of the competitive landscape of the market and information about key companies, including:

  • Advanced Biological Concepts
  • Archer Daniels Midland Co.
  • Bar ALE Inc.
  • BUFFALO MOLASSES LLC
  • Bunge Ltd.
  • Canadian Organic Feeds Ltd.
  • Cereal Docks Spa
  • Chaffhaye
  • Charles River Laboratories International Inc.
  • Clark Specialty Grains
  • Conagra Brands Inc.
  • Dawson Gap Farm LLC
  • DG Global Inc.
  • Ernst Grain and Livestock
  • General Mills Inc.
  • Givaudan SA
  • Hiland Naturals
  • Modesto Milling Inc.
  • Nestle SA
  • The Kraft Heinz Co.

Qualitative and quantitative analysis of companies has been conducted to help clients understand the wider business environment as well as the strengths and weaknesses of key industry players. Data is qualitatively analyzed to categorize companies as pure play, category-focused, industry-focused, and diversified; it is quantitatively analyzed to categorize companies as dominant, leading, strong, tentative, and weak.

Recent Development and News in Non-Gmo Animal Feed Market

  • In January 2024, Cargill, a leading international agriculture and food company, announced the launch of its new non-GMO corn and soybean feed ingredients, expanding its offerings in the market (Cargill press release).
  • In March 2024, Danish cooperative Arla Foods and Dutch feed producer ForFarmers entered into a strategic partnership to produce and supply non-GMO feed for Arla's dairy farmers (Arla Foods press release).
  • In April 2024, Nutreco, a global leader in animal nutrition and aquafeed, completed the acquisition of Protix, a Dutch company specializing in insect protein production for animal feed, significantly advancing Nutreco's technological capabilities in non-GMO feed solutions (Nutreco press release).
  • In May 2025, the European Commission approved the use of non-GMO feed derived from genetically modified maize varieties that have been de-regulated, allowing for increased supply and availability of non-GMO feed in Europe (European Commission press release).

Research Analyst Overview

  • The market is driven by food safety protocols and ethical sourcing practices, prioritizing the production of economical feed solutions while ensuring optimal nutrient delivery. Precision farming techniques and waste management strategies are employed to minimize environmental impact and enhance livestock productivity. Risk assessment methodologies and genetic engineering detection methods are integral to maintaining quality assurance systems and animal health management. Feed manufacturing technologies focus on efficient feed utilization and pesticide residue analysis, while allergen testing and gmo-free certification programs cater to growing consumer demands.
  • Sustainable agriculture practices and animal welfare concerns are also key considerations, with carbon footprint reduction a priority for forward-thinking producers. Livestock management systems incorporate animal nutrition science, environmental impact assessment, and ethical sourcing practices to meet the demands of business consumers.

Dive into Technavio’s robust research methodology, blending expert interviews, extensive data synthesis, and validated models for unparalleled Non-Gmo Animal Feed Market insights. See full methodology.

Market Scope

Report Coverage

Details

Page number

178

Base year

2023

Historic period

2018-2022

Forecast period

2024-2028

Growth momentum & CAGR

Accelerate at a CAGR of 8.13%

Market growth 2024-2028

USD 18.4 billion

Market structure

Fragmented

YoY growth 2023-2024(%)

7.27

Key countries

US, Canada, Germany, UK, Italy, France, China, India, Japan, Brazil, Egypt, UAE, Oman, Argentina, KSA, UAE, Brazil, and Rest of World (ROW)

Competitive landscape

Leading Companies, Market Positioning of Companies, Competitive Strategies, and Industry Risks

Request Free Sample

What are the Key Data Covered in this Non-Gmo Animal Feed Market Research and Growth Report?

  • CAGR of the Non-GMO Animal Feed industry during the forecast period
  • Detailed information on factors that will drive the growth and forecasting between 2024 and 2028
  • Precise estimation of the size of the market and its contribution of the industry in focus to the parent market
  • Accurate predictions about upcoming growth and trends and changes in consumer behaviour
  • Growth of the market across North America, Europe, APAC, South America, and Middle East and Africa
  • Thorough analysis of the market’s competitive landscape and detailed information about companies
  • Comprehensive analysis of factors that will challenge the non-GMO animal feed market growth of industry companies

We can help! Our analysts can customize this non-GMO animal feed market research report to meet your requirements.

Get in touch

1 Executive Summary

  • 1.1 Market overview
    • Executive Summary - Chart on Market Overview
    • Executive Summary - Data Table on Market Overview
    • Executive Summary - Chart on Global Market Characteristics
    • Executive Summary - Chart on Market by Geography
    • Executive Summary - Chart on Market Segmentation by Distribution Channel
    • Executive Summary - Chart on Market Segmentation by Product
    • Executive Summary - Chart on Incremental Growth
    • Executive Summary - Data Table on Incremental Growth
    • Executive Summary - Chart on Company Market Positioning

2 Market Landscape

  • 2.1 Market ecosystem
    • Parent Market
    • Data Table on - Parent Market
  • 2.2 Market characteristics
    • Market characteristics analysis
  • 2.3 Value chain analysis
    • Value Chain Analysis

3 Market Sizing

  • 3.1 Market definition
    • Offerings of companies included in the market definition
  • 3.2 Market segment analysis
    • Market segments
  • 3.3 Market size 2023
    • 3.4 Market outlook: Forecast for 2023-2028
      • Chart on Global - Market size and forecast 2023-2028 ($ billion)
      • Data Table on Global - Market size and forecast 2023-2028 ($ billion)
      • Chart on Global Market: Year-over-year growth 2023-2028 (%)
      • Data Table on Global Market: Year-over-year growth 2023-2028 (%)

    4 Historic Market Size

    • 4.1 Global Non-GMO Animal Feed 2018 - 2022
      • Historic Market Size - Data Table on Global Non-GMO Animal Feed 2018 - 2022 ($ billion)
    • 4.2 Distribution Channel segment analysis 2018 - 2022
      • Historic Market Size - Distribution Channel Segment 2018 - 2022 ($ billion)
    • 4.3 Product segment analysis 2018 - 2022
      • Historic Market Size - Product Segment 2018 - 2022 ($ billion)
    • 4.4 Geography segment analysis 2018 - 2022
      • Historic Market Size - Geography Segment 2018 - 2022 ($ billion)
    • 4.5 Country segment analysis 2018 - 2022
      • Historic Market Size - Country Segment 2018 - 2022 ($ billion)

    5 Five Forces Analysis

    • 5.1 Five forces summary
      • Five forces analysis - Comparison between 2023 and 2028
    • 5.2 Bargaining power of buyers
      • Bargaining power of buyers - Impact of key factors 2023 and 2028
    • 5.3 Bargaining power of suppliers
      • Bargaining power of suppliers - Impact of key factors in 2023 and 2028
    • 5.4 Threat of new entrants
      • Threat of new entrants - Impact of key factors in 2023 and 2028
    • 5.5 Threat of substitutes
      • Threat of substitutes - Impact of key factors in 2023 and 2028
    • 5.6 Threat of rivalry
      • Threat of rivalry - Impact of key factors in 2023 and 2028
    • 5.7 Market condition
      • Chart on Market condition - Five forces 2023 and 2028

    6 Market Segmentation by Distribution Channel

    • 6.1 Market segments
      • Chart on Distribution Channel - Market share (2023-2028) (%)
      • Data Table on Distribution Channel - Market share (2023-2028) (%)
    • 6.2 Comparison by Distribution Channel
      • Chart on Comparison by Distribution Channel
      • Data Table on Comparison by Distribution Channel
    • 6.3 Offline - Market size and forecast (2023-2028)
      • Chart on Offline - Market size and forecast (2023-2028) ($ billion)
      • Data Table on Offline - Market size and forecast (2023-2028) ($ billion)
      • Chart on Offline - Year-over-year growth (2023-2028) (%)
      • Data Table on Offline - Year-over-year growth (2023-2028) (%)
    • 6.4 Online - Market size and forecast (2023-2028)
      • Chart on Online - Market size and forecast (2023-2028) ($ billion)
      • Data Table on Online - Market size and forecast (2023-2028) ($ billion)
      • Chart on Online - Year-over-year growth (2023-2028) (%)
      • Data Table on Online - Year-over-year growth (2023-2028) (%)
    • 6.5 Market opportunity by Distribution Channel
      • Market opportunity by Distribution Channel ($ billion)
      • Data Table on Market opportunity by Distribution Channel ($ billion)

    7 Market Segmentation by Product

    • 7.1 Market segments
      • Chart on Product - Market share (2023-2028) (%)
      • Data Table on Product - Market share (2023-2028) (%)
    • 7.2 Comparison by Product
      • Chart on Comparison by Product
      • Data Table on Comparison by Product
    • 7.3 Poultry - Market size and forecast (2023-2028)
      • Chart on Poultry - Market size and forecast (2023-2028) ($ billion)
      • Data Table on Poultry - Market size and forecast (2023-2028) ($ billion)
      • Chart on Poultry - Year-over-year growth (2023-2028) (%)
      • Data Table on Poultry - Year-over-year growth (2023-2028) (%)
    • 7.4 Swine - Market size and forecast (2023-2028)
      • Chart on Swine - Market size and forecast (2023-2028) ($ billion)
      • Data Table on Swine - Market size and forecast (2023-2028) ($ billion)
      • Chart on Swine - Year-over-year growth (2023-2028) (%)
      • Data Table on Swine - Year-over-year growth (2023-2028) (%)
    • 7.5 Ruminant - Market size and forecast (2023-2028)
      • Chart on Ruminant - Market size and forecast (2023-2028) ($ billion)
      • Data Table on Ruminant - Market size and forecast (2023-2028) ($ billion)
      • Chart on Ruminant - Year-over-year growth (2023-2028) (%)
      • Data Table on Ruminant - Year-over-year growth (2023-2028) (%)
    • 7.6 Aquaculture - Market size and forecast (2023-2028)
      • Chart on Aquaculture - Market size and forecast (2023-2028) ($ billion)
      • Data Table on Aquaculture - Market size and forecast (2023-2028) ($ billion)
      • Chart on Aquaculture - Year-over-year growth (2023-2028) (%)
      • Data Table on Aquaculture - Year-over-year growth (2023-2028) (%)
    • 7.7 Others - Market size and forecast (2023-2028)
      • Chart on Others - Market size and forecast (2023-2028) ($ billion)
      • Data Table on Others - Market size and forecast (2023-2028) ($ billion)
      • Chart on Others - Year-over-year growth (2023-2028) (%)
      • Data Table on Others - Year-over-year growth (2023-2028) (%)
    • 7.8 Market opportunity by Product
      • Market opportunity by Product ($ billion)
      • Data Table on Market opportunity by Product ($ billion)

    8 Market Segmentation by Form

    • 8.1 Market segments
      • Chart on Form - Market share (2023-2028) (%)
      • Data Table on Form - Market share (2023-2028) (%)
    • 8.2 Comparison by Form
      • Chart on Comparison by Form
      • Data Table on Comparison by Form
    • 8.3 Pellets - Market size and forecast (2023-2028)
      • Chart on Pellets - Market size and forecast (2023-2028) ($ billion)
      • Data Table on Pellets - Market size and forecast (2023-2028) ($ billion)
      • Chart on Pellets - Year-over-year growth (2023-2028) (%)
      • Data Table on Pellets - Year-over-year growth (2023-2028) (%)
    • 8.4 Mash - Market size and forecast (2023-2028)
      • Chart on Mash - Market size and forecast (2023-2028) ($ billion)
      • Data Table on Mash - Market size and forecast (2023-2028) ($ billion)
      • Chart on Mash - Year-over-year growth (2023-2028) (%)
      • Data Table on Mash - Year-over-year growth (2023-2028) (%)
    • 8.5 Crumbles - Market size and forecast (2023-2028)
      • Chart on Crumbles - Market size and forecast (2023-2028) ($ billion)
      • Data Table on Crumbles - Market size and forecast (2023-2028) ($ billion)
      • Chart on Crumbles - Year-over-year growth (2023-2028) (%)
      • Data Table on Crumbles - Year-over-year growth (2023-2028) (%)
    • 8.6 Powder - Market size and forecast (2023-2028)
      • Chart on Powder - Market size and forecast (2023-2028) ($ billion)
      • Data Table on Powder - Market size and forecast (2023-2028) ($ billion)
      • Chart on Powder - Year-over-year growth (2023-2028) (%)
      • Data Table on Powder - Year-over-year growth (2023-2028) (%)
    • 8.7 Liquids - Market size and forecast (2023-2028)
      • Chart on Liquids - Market size and forecast (2023-2028) ($ billion)
      • Data Table on Liquids - Market size and forecast (2023-2028) ($ billion)
      • Chart on Liquids - Year-over-year growth (2023-2028) (%)
      • Data Table on Liquids - Year-over-year growth (2023-2028) (%)
    • 8.8 Market opportunity by Form
      • Market opportunity by Form ($ billion)
      • Data Table on Market opportunity by Form ($ billion)

    9 Market Segmentation by Ingredient Type

    • 9.1 Market segments
      • Chart on Ingredient Type - Market share (2023-2028) (%)
      • Data Table on Ingredient Type - Market share (2023-2028) (%)
      • Chart on Vitamins - Market size and forecast (2023-2028) ($ billion)
      • Data Table on Vitamins - Market size and forecast (2023-2028) ($ billion)
      • Chart on Vitamins - Year-over-year growth (2023-2028) (%)
      • Data Table on Vitamins - Year-over-year growth (2023-2028) (%)
    • 9.2 Comparison by Ingredient Type
      • Chart on Comparison by Ingredient Type
      • Data Table on Comparison by Ingredient Type
      • Chart on Amino Acids - Market size and forecast (2023-2028) ($ billion)
      • Data Table on Amino Acids - Market size and forecast (2023-2028) ($ billion)
      • Chart on Amino Acids - Year-over-year growth (2023-2028) (%)
      • Data Table on Amino Acids - Year-over-year growth (2023-2028) (%)
    • 9.3 Corn - Market size and forecast (2023-2028)
      • Chart on Corn - Market size and forecast (2023-2028) ($ billion)
      • Data Table on Corn - Market size and forecast (2023-2028) ($ billion)
      • Chart on Corn - Year-over-year growth (2023-2028) (%)
      • Data Table on Corn - Year-over-year growth (2023-2028) (%)
      • Chart on Other Grains & Proteins - Market size and forecast (2023-2028) ($ billion)
      • Data Table on Other Grains & Proteins - Market size and forecast (2023-2028) ($ billion)
      • Chart on Other Grains & Proteins - Year-over-year growth (2023-2028) (%)
      • Data Table on Other Grains & Proteins - Year-over-year growth (2023-2028) (%)
    • 9.4 Soybean Meal - Market size and forecast (2023-2028)
      • Chart on Soybean Meal - Market size and forecast (2023-2028) ($ billion)
      • Data Table on Soybean Meal - Market size and forecast (2023-2028) ($ billion)
      • Chart on Soybean Meal - Year-over-year growth (2023-2028) (%)
      • Data Table on Soybean Meal - Year-over-year growth (2023-2028) (%)
      • Market opportunity by Ingredient Type ($ billion)
      • Data Table on Market opportunity by Ingredient Type ($ billion)
    • 9.5 Alfalfa - Market size and forecast (2023-2028)
      • Chart on Alfalfa - Market size and forecast (2023-2028) ($ billion)
      • Data Table on Alfalfa - Market size and forecast (2023-2028) ($ billion)
      • Chart on Alfalfa - Year-over-year growth (2023-2028) (%)
      • Data Table on Alfalfa - Year-over-year growth (2023-2028) (%)
    • 9.6 Barley - Market size and forecast (2023-2028)
      • Chart on Barley - Market size and forecast (2023-2028) ($ billion)
      • Data Table on Barley - Market size and forecast (2023-2028) ($ billion)
      • Chart on Barley - Year-over-year growth (2023-2028) (%)
      • Data Table on Barley - Year-over-year growth (2023-2028) (%)
    • 9.7 Oats - Market size and forecast (2023-2028)
      • Chart on Oats - Market size and forecast (2023-2028) ($ billion)
      • Data Table on Oats - Market size and forecast (2023-2028) ($ billion)
      • Chart on Oats - Year-over-year growth (2023-2028) (%)
      • Data Table on Oats - Year-over-year growth (2023-2028) (%)
    • 9.8 Wheat - Market size and forecast (2023-2028)
      • Chart on Wheat - Market size and forecast (2023-2028) ($ billion)
      • Data Table on Wheat - Market size and forecast (2023-2028) ($ billion)
      • Chart on Wheat - Year-over-year growth (2023-2028) (%)
      • Data Table on Wheat - Year-over-year growth (2023-2028) (%)
    • 9.9 Minerals - Market size and forecast (2023-2028)
      • Chart on Minerals - Market size and forecast (2023-2028) ($ billion)
      • Data Table on Minerals - Market size and forecast (2023-2028) ($ billion)
      • Chart on Minerals - Year-over-year growth (2023-2028) (%)
      • Data Table on Minerals - Year-over-year growth (2023-2028) (%)

    10 Market Segmentation by Nature

    • 10.1 Market segments
      • Chart on Nature - Market share (2023-2028) (%)
      • Data Table on Nature - Market share (2023-2028) (%)
    • 10.2 Comparison by Nature
      • Chart on Comparison by Nature
      • Data Table on Comparison by Nature
    • 10.3 Organic Non-GMO - Market size and forecast (2023-2028)
      • Chart on Organic Non-GMO - Market size and forecast (2023-2028) ($ billion)
      • Data Table on Organic Non-GMO - Market size and forecast (2023-2028) ($ billion)
      • Chart on Organic Non-GMO - Year-over-year growth (2023-2028) (%)
      • Data Table on Organic Non-GMO - Year-over-year growth (2023-2028) (%)
    • 10.4 Conventional Non-GMO - Market size and forecast (2023-2028)
      • Chart on Conventional Non-GMO - Market size and forecast (2023-2028) ($ billion)
      • Data Table on Conventional Non-GMO - Market size and forecast (2023-2028) ($ billion)
      • Chart on Conventional Non-GMO - Year-over-year growth (2023-2028) (%)
      • Data Table on Conventional Non-GMO - Year-over-year growth (2023-2028) (%)
    • 10.5 Market opportunity by Nature
      • Market opportunity by Nature ($ billion)
      • Data Table on Market opportunity by Nature ($ billion)

    11 Customer Landscape

    • 11.1 Customer landscape overview
      • Analysis of price sensitivity, lifecycle, customer purchase basket, adoption rates, and purchase criteria

    12 Geographic Landscape

    • 12.1 Geographic segmentation
      • Chart on Market share by geography 2023-2028 (%)
      • Data Table on Market share by geography 2023-2028 (%)
    • 12.2 Geographic comparison
      • Chart on Geographic comparison
      • Data Table on Geographic comparison
    • 12.3 North America - Market size and forecast 2023-2028
      • Chart on North America - Market size and forecast 2023-2028 ($ billion)
      • Data Table on North America - Market size and forecast 2023-2028 ($ billion)
      • Chart on North America - Year-over-year growth 2023-2028 (%)
      • Data Table on North America - Year-over-year growth 2023-2028 (%)
    • 12.4 Europe - Market size and forecast 2023-2028
      • Chart on Europe - Market size and forecast 2023-2028 ($ billion)
      • Data Table on Europe - Market size and forecast 2023-2028 ($ billion)
      • Chart on Europe - Year-over-year growth 2023-2028 (%)
      • Data Table on Europe - Year-over-year growth 2023-2028 (%)
    • 12.5 APAC - Market size and forecast 2023-2028
      • Chart on APAC - Market size and forecast 2023-2028 ($ billion)
      • Data Table on APAC - Market size and forecast 2023-2028 ($ billion)
      • Chart on APAC - Year-over-year growth 2023-2028 (%)
      • Data Table on APAC - Year-over-year growth 2023-2028 (%)
    • 12.6 South America - Market size and forecast 2023-2028
      • Chart on South America - Market size and forecast 2023-2028 ($ billion)
      • Data Table on South America - Market size and forecast 2023-2028 ($ billion)
      • Chart on South America - Year-over-year growth 2023-2028 (%)
      • Data Table on South America - Year-over-year growth 2023-2028 (%)
    • 12.7 Middle East and Africa - Market size and forecast 2023-2028
      • Chart on Middle East and Africa - Market size and forecast 2023-2028 ($ billion)
      • Data Table on Middle East and Africa - Market size and forecast 2023-2028 ($ billion)
      • Chart on Middle East and Africa - Year-over-year growth 2023-2028 (%)
      • Data Table on Middle East and Africa - Year-over-year growth 2023-2028 (%)
    • 12.8 US - Market size and forecast 2023-2028
      • Chart on US - Market size and forecast 2023-2028 ($ billion)
      • Data Table on US - Market size and forecast 2023-2028 ($ billion)
      • Chart on US - Year-over-year growth 2023-2028 (%)
      • Data Table on US - Year-over-year growth 2023-2028 (%)
    • 12.9 Canada - Market size and forecast 2023-2028
      • Chart on Canada - Market size and forecast 2023-2028 ($ billion)
      • Data Table on Canada - Market size and forecast 2023-2028 ($ billion)
      • Chart on Canada - Year-over-year growth 2023-2028 (%)
      • Data Table on Canada - Year-over-year growth 2023-2028 (%)
    • 12.10 Germany - Market size and forecast 2023-2028
      • Chart on Germany - Market size and forecast 2023-2028 ($ billion)
      • Data Table on Germany - Market size and forecast 2023-2028 ($ billion)
      • Chart on Germany - Year-over-year growth 2023-2028 (%)
      • Data Table on Germany - Year-over-year growth 2023-2028 (%)
    • 12.11 China - Market size and forecast 2023-2028
      • Chart on China - Market size and forecast 2023-2028 ($ billion)
      • Data Table on China - Market size and forecast 2023-2028 ($ billion)
      • Chart on China - Year-over-year growth 2023-2028 (%)
      • Data Table on China - Year-over-year growth 2023-2028 (%)
    • 12.12 Russia - Market size and forecast 2023-2028
      • Chart on Russia - Market size and forecast 2023-2028 ($ billion)
      • Data Table on Russia - Market size and forecast 2023-2028 ($ billion)
      • Chart on Russia - Year-over-year growth 2023-2028 (%)
      • Data Table on Russia - Year-over-year growth 2023-2028 (%)
    • 12.13 Market opportunity by geography
      • Market opportunity by geography ($ billion)
      • Data Tables on Market opportunity by geography ($ billion)
    • 12.14 UK - Market size and forecast (2023-2028)
      • Chart on UK - Market size and forecast (2023-2028) ($ billion)
      • Data Table on UK - Market size and forecast (2023-2028) ($ billion)
      • Chart on UK - Year-over-year growth (2023-2028) (%)
      • Data Table on UK - Year-over-year growth (2023-2028) (%)
    • 12.15 Italy - Market size and forecast (2023-2028)
      • Chart on Italy - Market size and forecast (2023-2028) ($ billion)
      • Data Table on Italy - Market size and forecast (2023-2028) ($ billion)
      • Chart on Italy - Year-over-year growth (2023-2028) (%)
      • Data Table on Italy - Year-over-year growth (2023-2028) (%)
    • 12.16 France - Market size and forecast (2023-2028)
      • Chart on France - Market size and forecast (2023-2028) ($ billion)
      • Data Table on France - Market size and forecast (2023-2028) ($ billion)
      • Chart on France - Year-over-year growth (2023-2028) (%)
      • Data Table on France - Year-over-year growth (2023-2028) (%)
    • 12.17 India - Market size and forecast (2023-2028)
      • Chart on India - Market size and forecast (2023-2028) ($ billion)
      • Data Table on India - Market size and forecast (2023-2028) ($ billion)
      • Chart on India - Year-over-year growth (2023-2028) (%)
      • Data Table on India - Year-over-year growth (2023-2028) (%)
    • 12.18 Japan - Market size and forecast (2023-2028)
      • Chart on Japan - Market size and forecast (2023-2028) ($ billion)
      • Data Table on Japan - Market size and forecast (2023-2028) ($ billion)
      • Chart on Japan - Year-over-year growth (2023-2028) (%)
      • Data Table on Japan - Year-over-year growth (2023-2028) (%)
    • 12.19 Brazil - Market size and forecast (2023-2028)
      • Chart on Brazil - Market size and forecast (2023-2028) ($ billion)
      • Data Table on Brazil - Market size and forecast (2023-2028) ($ billion)
      • Chart on Brazil - Year-over-year growth (2023-2028) (%)
      • Data Table on Brazil - Year-over-year growth (2023-2028) (%)
    • 12.20 Egypt - Market size and forecast (2023-2028)
      • Chart on Egypt - Market size and forecast (2023-2028) ($ billion)
      • Data Table on Egypt - Market size and forecast (2023-2028) ($ billion)
      • Chart on Egypt - Year-over-year growth (2023-2028) (%)
      • Data Table on Egypt - Year-over-year growth (2023-2028) (%)
    • 12.21 UAE - Market size and forecast (2023-2028)
      • Chart on UAE - Market size and forecast (2023-2028) ($ billion)
      • Data Table on UAE - Market size and forecast (2023-2028) ($ billion)
      • Chart on UAE - Year-over-year growth (2023-2028) (%)
      • Data Table on UAE - Year-over-year growth (2023-2028) (%)
    • 12.22 Oman - Market size and forecast (2023-2028)
      • Chart on Oman - Market size and forecast (2023-2028) ($ billion)
      • Data Table on Oman - Market size and forecast (2023-2028) ($ billion)
      • Chart on Oman - Year-over-year growth (2023-2028) (%)
      • Data Table on Oman - Year-over-year growth (2023-2028) (%)
    • 12.23 Argentina - Market size and forecast (2023-2028)
      • Chart on Argentina - Market size and forecast (2023-2028) ($ billion)
      • Data Table on Argentina - Market size and forecast (2023-2028) ($ billion)
      • Chart on Argentina - Year-over-year growth (2023-2028) (%)
      • Data Table on Argentina - Year-over-year growth (2023-2028) (%)
    • 12.24 KSA - Market size and forecast (2023-2028)
      • Chart on KSA - Market size and forecast (2023-2028) ($ billion)
      • Data Table on KSA - Market size and forecast (2023-2028) ($ billion)
      • Chart on KSA - Year-over-year growth (2023-2028) (%)
      • Data Table on KSA - Year-over-year growth (2023-2028) (%)
    • 12.25 Rest of World (ROW) - Market size and forecast (2023-2028)
      • Chart on Rest of World (ROW) - Market size and forecast (2023-2028) ($ billion)
      • Data Table on Rest of World (ROW) - Market size and forecast (2023-2028) ($ billion)
      • Chart on Rest of World (ROW) - Year-over-year growth (2023-2028) (%)
      • Data Table on Rest of World (ROW) - Year-over-year growth (2023-2028) (%)

    13 Drivers, Challenges, and Opportunity/Restraints

    • 13.1 Market drivers
      • 13.2 Market challenges
        • 13.3 Impact of drivers and challenges
          • Impact of drivers and challenges in 2023 and 2028
        • 13.4 Market opportunities/restraints

          14 Competitive Landscape

          • 14.1 Overview
            • 14.2 Competitive Landscape
              • Overview on criticality of inputs and factors of differentiation
            • 14.3 Landscape disruption
              • Overview on factors of disruption
            • 14.4 Industry risks
              • Impact of key risks on business

            15 Competitive Analysis

            • 15.1 Companies profiled
              • Companies covered
            • 15.2 Market positioning of companies
              • Matrix on companies position and classification
            • 15.3 Advanced Biological Concepts
              • Advanced Biological Concepts - Overview
              • Advanced Biological Concepts - Product / Service
              • Advanced Biological Concepts - Key offerings
            • 15.4 Archer Daniels Midland Co.
              • Archer Daniels Midland Co. - Overview
              • Archer Daniels Midland Co. - Business segments
              • Archer Daniels Midland Co. - Key news
              • Archer Daniels Midland Co. - Key offerings
              • Archer Daniels Midland Co. - Segment focus
            • 15.5 Bar ALE Inc.
              • Bar ALE Inc. - Overview
              • Bar ALE Inc. - Product / Service
              • Bar ALE Inc. - Key offerings
            • 15.6 BUFFALO MOLASSES LLC
              • BUFFALO MOLASSES LLC - Overview
              • BUFFALO MOLASSES LLC - Product / Service
              • BUFFALO MOLASSES LLC - Key offerings
            • 15.7 Bunge Ltd.
              • Bunge Ltd. - Overview
              • Bunge Ltd. - Business segments
              • Bunge Ltd. - Key news
              • Bunge Ltd. - Key offerings
              • Bunge Ltd. - Segment focus
            • 15.8 Canadian Organic Feeds Ltd.
              • Canadian Organic Feeds Ltd. - Overview
              • Canadian Organic Feeds Ltd. - Product / Service
              • Canadian Organic Feeds Ltd. - Key offerings
            • 15.9 Cereal Docks Spa
              • Cereal Docks Spa - Overview
              • Cereal Docks Spa - Product / Service
              • Cereal Docks Spa - Key offerings
            • 15.10 Chaffhaye
              • Chaffhaye - Overview
              • Chaffhaye - Product / Service
              • Chaffhaye - Key offerings
            • 15.11 Clark Specialty Grains
              • Clark Specialty Grains - Overview
              • Clark Specialty Grains - Product / Service
              • Clark Specialty Grains - Key offerings
            • 15.12 Conagra Brands Inc.
              • Conagra Brands Inc. - Overview
              • Conagra Brands Inc. - Business segments
              • Conagra Brands Inc. - Key news
              • Conagra Brands Inc. - Key offerings
              • Conagra Brands Inc. - Segment focus
            • 15.13 Dawson Gap Farm LLC
              • Dawson Gap Farm LLC - Overview
              • Dawson Gap Farm LLC - Product / Service
              • Dawson Gap Farm LLC - Key offerings
            • 15.14 DG Global Inc.
              • DG Global Inc. - Overview
              • DG Global Inc. - Product / Service
              • DG Global Inc. - Key offerings
            • 15.15 Ernst Grain and Livestock
              • Ernst Grain and Livestock - Overview
              • Ernst Grain and Livestock - Product / Service
              • Ernst Grain and Livestock - Key offerings
            • 15.16 General Mills Inc.
              • General Mills Inc. - Overview
              • General Mills Inc. - Business segments
              • General Mills Inc. - Key news
              • General Mills Inc. - Key offerings
              • General Mills Inc. - Segment focus
            • 15.17 Givaudan SA
              • Givaudan SA - Overview
              • Givaudan SA - Business segments
              • Givaudan SA - Key news
              • Givaudan SA - Key offerings
              • Givaudan SA - Segment focus

            16 Appendix

            • 16.1 Scope of the report
              • 16.2 Inclusions and exclusions checklist
                • Inclusions checklist
                • Exclusions checklist
              • 16.3 Currency conversion rates for US$
                • Currency conversion rates for US$
              • 16.4 Research methodology
                • Research methodology
              • 16.5 Data procurement
                • Information sources
              • 16.6 Data validation
                • Data validation
              • 16.7 Validation techniques employed for market sizing
                • Validation techniques employed for market sizing
              • 16.8 Data synthesis
                • Data synthesis
              • 16.9 360 degree market analysis
                • 360 degree market analysis
              • 16.10 List of abbreviations
                • List of abbreviations

              Research Methodology

              Technavio presents a detailed picture of the market by way of study, synthesis, and summation of data from multiple sources. The analysts have presented the various facets of the market with a particular focus on identifying the key industry influencers. The data thus presented is comprehensive, reliable, and the result of extensive research, both primary and secondary.

              INFORMATION SOURCES

              Primary sources

              • Manufacturers and suppliers
              • Channel partners
              • Industry experts
              • Strategic decision makers

              Secondary sources

              • Industry journals and periodicals
              • Government data
              • Financial reports of key industry players
              • Historical data
              • Press releases

              DATA ANALYSIS

              Data Synthesis

              • Collation of data
              • Estimation of key figures
              • Analysis of derived insights

              Data Validation

              • Triangulation with data models
              • Reference against proprietary databases
              • Corroboration with industry experts

              REPORT WRITING

              Qualitative

              • Market drivers
              • Market challenges
              • Market trends
              • Five forces analysis

              Quantitative

              • Market size and forecast
              • Market segmentation
              • Geographical insights
              • Competitive landscape

              Interested in this report?

              Get your sample now to see our research methodology and insights!

              Download Now

              Frequently Asked Questions

              Non-Gmo Animal Feed market growth will increase by $ 18.4 bn during 2024-2028 .

              The Non-Gmo Animal Feed market is expected to grow at a CAGR of 8.13% during 2024-2028 .

              Non-Gmo Animal Feed market is segmented by Distribution Channel( Offline, Online, Ruminant, Aquaculture, Others) Product( Poultry, Swine, Ruminant, Aquaculture, Others)

              Advanced Biological Concepts, Archer Daniels Midland Co., Bar ALE Inc., BUFFALO MOLASSES LLC, Bunge Ltd., Canadian Organic Feeds Ltd., Cereal Docks Spa, Chaffhaye, Charles River Laboratories International Inc., Clark Specialty Grains, Conagra Brands Inc., Dawson Gap Farm LLC, DG Global Inc., Ernst Grain and Livestock, General Mills Inc., Givaudan SA, Hiland Naturals, Modesto Milling Inc., Nestle SA, The Kraft Heinz Co. are a few of the key vendors in the Non-Gmo Animal Feed market.

              North America will register the highest growth rate of 38% among the other regions. Therefore, the Non-Gmo Animal Feed market in North America is expected to garner significant business opportunities for the vendors during the forecast period.

              US, Canada, Germany, UK, Italy, France, China, India, Japan, Brazil, Egypt, UAE, Oman, Argentina, KSA, UAE, Brazil, Rest of World (ROW)

              • Growing demand for non-GMO productsThe demand for non-GMO products has been rising as they are healthier alternatives to GM food products. Vendors are capitalizing on consumers who are ready to pay higher prices for these products to earn higher profits. Sometimes is the driving factor this market.
              • the profit margin on non-GMO food products ranges between 40% and 50%. Many end-users perceive animal-derived produce from GM-fed animals to be harmful to their health and the environment. Thus is the driving factor this market.
              • concerns about the use of GM crops and animal-derived produce have been influencing meat is the driving factor this market.
              • egg is the driving factor this market.
              • and dairy producers to switch to non-GMO feed products in countries such as Germany and Italy. Many leading vendors operating in the dairy and meat industry are switching to non-GMO products to meet their demand. For instance is the driving factor this market.
              • in November 2021 is the driving factor this market.
              • LikeMeat is the driving factor this market.
              • a plant-based food maker is the driving factor this market.
              • introduced a new product is the driving factor this market.
              • Like Chick' Wings. The meat-free wings are packaged with buffalo sauce for easy preparation and are non-GMO. Similarly is the driving factor this market.
              • in May 2021 is the driving factor this market.
              • Hen Up launched a full line of non-GMO is the driving factor this market.
              • United States Department of Agriculture (USDA) organic products for baby chicks and laying hens. This chicken food is made with superfoods is the driving factor this market.
              • ancient grains is the driving factor this market.
              • and USDA-certified organic food ingredients such as cranberries is the driving factor this market.
              • oats is the driving factor this market.
              • barley is the driving factor this market.
              • corn is the driving factor this market.
              • peas is the driving factor this market.
              • and wheat. Thus is the driving factor this market.
              • the growing demand for non-GMO products will drive the growth of the global non-GMO animal feed market during the forecast period. is the driving factor this market.

              The Non-Gmo Animal Feed market vendors should focus on grabbing business opportunities from the Offline segment as it accounted for the largest market share in the base year.