North America Seismic Survey Market by Type and End-user - Forecast and Analysis 2024-2028

North America Seismic Survey Market by Type and End-user - Forecast and Analysis 2024-2028

Published: Feb 2024 137 Pages SKU: IRTNTR77564

Market Overview at a Glance

$2.34 B
Market Opportunity
4.46%
CAGR
4.32
YoY growth 2023-2024(%)

North America Seismic Survey Market Size 2024-2028 

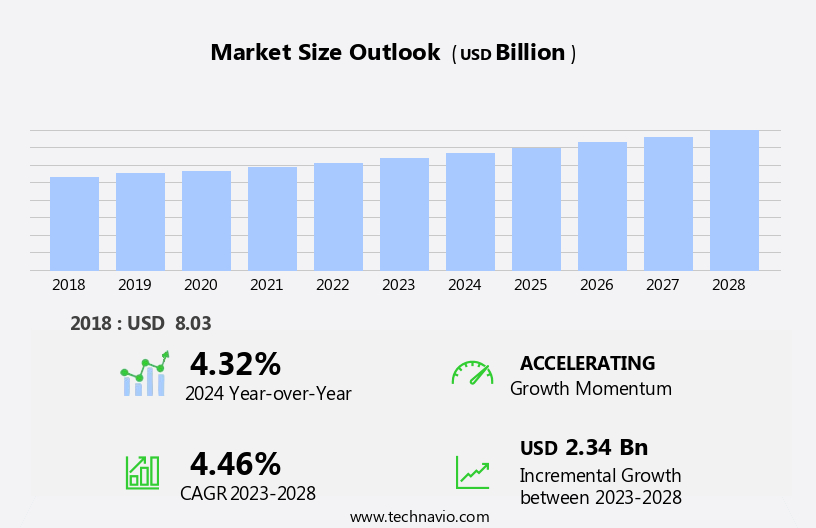
The north america seismic survey market size is forecast to increase by USD 2.34 billion at a CAGR of 4.46% between 2023 and 2028.

  • The market is experiencing significant growth due to the increase in deepwater and ultra-deepwater Exploration and Production (E and P) projects. This trend is driven by the vast potential of these waters for oil and gas reserves. Additionally, there is a growing shift towards advanced technologies such as Artificial Intelligence (AI) and machine learning for interpreting seismic data. These technologies enable more accurate and efficient analysis of large datasets. However, the market faces challenges from environmental scrutiny and regulatory hurdles associated with seismic surveys. Stringent regulations and increasing public awareness of the potential environmental impact of seismic surveys may hinder market growth.
  • Despite these challenges, the market is expected to continue expanding due to the high demand for accurate geological data for E and P projects. The integration of advanced technologies is also expected to mitigate the environmental concerns and improve the overall efficiency of seismic surveys.
  • What will be the size of the North America Seismic Survey Market during the forecast period?

    Seismic Survey Market in North America Size

     Request Free Sample

  • The North American seismic survey market is a dynamic and evolving industry, driven by the ongoing pursuit of hydrocarbon resources, particularly unconventional ones. Seismic surveys play a crucial role in exploration and production, providing valuable subsurface data for reservoir monitoring, optimization, and hydrocarbon recovery. Technological advancements continue to shape the market, with high-performance computing, broadband seismic sensors, and advanced imaging algorithms enhancing imaging resolution and interpretation capabilities. Despite these innovations, market competition remains fierce, with smaller companies vying for market share. Exploration budgets and project delays pose challenges, necessitating cost-effective and efficient seismic services. Environmental regulations, permitting requirements, indigenous land rights, and seismic protection concerns add complexity to the market.
  • Seismic protection devices, earthquake-resistant structures, and sensors, streamers, and data processing software are essential components of the industry's response to these challenges. Ultimately, the market is characterized by its commitment to safety, innovation, and the responsible exploration and production of hydrocarbon resources.
  • How is this market segmented and which is the largest segment?

    The market research report provides comprehensive data (region-wise segment analysis), with forecasts and estimates in "USD billion" for the period 2024-2028, as well as historical data from 2018-2022 for the following segments.

    • Type
      • Data acquisition
      • Data processing
      • Data interpretation
    • End-user
      • Oil
      • gas
      • Others
    • Geography
      • North America
        • Canada
        • Mexico
        • US

    By Type Insights

    • The data acquisition segment is estimated to witness significant growth during the forecast period.

    The market is driven by the data acquisition segment, which focuses on gathering subsurface data for geological analysis and interpretation. Technological innovations, including high-resolution 3D and 4D seismic imaging, have revolutionized seismic survey technology. Advanced imaging algorithms, broadband seismic sensors, and high-performance computing facilitate more accurate and detailed subsurface data. This data is essential for the oil and gas industry, which uses it extensively for exploration and production activities. As energy demand continues to rise, the need for precise data to locate and assess potential hydrocarbon reservoirs drives market growth. Additionally, the expansion of renewable energy projects, such as offshore wind farms and geothermal energy, requires subsurface site characterization and geotechnical assessments, further fueling market demand.

    Seismic survey services, including processing, interpretation, permitting requirements, and seismic protection devices, are integral components of the data acquisition process. Ensuring the protection of human life, property, and the environment during seismic events is a critical priority. Seismic survey equipment, including sensors, streamers, and data processing software, are continually evolving to meet the industry's demands for subsurface insights.

    Seismic Survey Market in North America Size

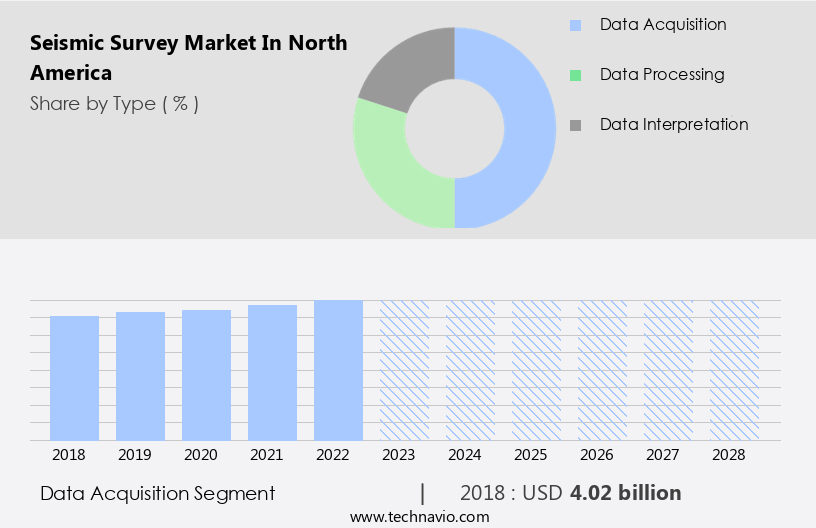
    Get a glance at the market share of various segments Request Free Sample

    The Data acquisition segment was valued at  USD 4.02 billion in 2018 and showed a gradual increase during the forecast period.

    Market Dynamics

    Our researchers analyzed the data with 2023 as the base year, along with the key drivers, trends, and challenges. A holistic analysis of drivers will help companies refine their marketing strategies to gain a competitive advantage.

    What are the key market drivers leading to the rise in adoption of North America Seismic Survey Market?

    Rise in deepwater and ultra-deepwater E and P projects is the key driver of the market.

  • In the North American seismic survey market, the demand for advanced imaging resolution and subsurface interpretation is driving the adoption of cutting-edge equipment and techniques. Broadband seismic sensors and high-performance computing are key technologies enabling the industry to obtain more accurate subsurface insights. Seismic protection devices and earthquake-resistant structures are essential to mitigate seismic events and safeguard human life and property. The exploration and production (E and P) industry's focus on reservoir monitoring, optimization, and hydrocarbon recovery, especially from unconventional resources, is increasing the need for seismic services, processing, and interpretation. Permitting requirements and indigenous land rights are crucial considerations in seismic survey projects, necessitating effective communication and collaboration.
  • Seismic survey equipment, including sensors, streamers, and data processing software, is undergoing technological innovation, with advanced imaging algorithms and reservoir monitoring techniques enhancing decision-making in exploration, development, and production activities. Renewable energy projects, such as offshore wind farms and geothermal energy projects, are also utilizing seismic imaging technology for site characterization and geotechnical assessments. The North American seismic survey market is experiencing growth due to the increasing demand for hydrocarbon reservoirs' exploration and development. The market dynamics are influenced by factors like exploration budgets, project delays, and the need for efficient data processing. Seismic protection and the integration of seismic data into various applications are essential for ensuring the success of seismic survey projects.
  • What are the market trends shaping the North America Seismic Survey Market?

    Growing shift toward AI-powered analytics and machine learning for interpreting seismic data is the upcoming trend In the market.

  • Seismic surveys are a crucial aspect of the North American energy industry, providing subsurface insights into hydrocarbon reservoirs and unconventional resources. Traditional interpretation methods, relying on human expertise, can be time-consuming and subjective. However, the integration of advanced imaging algorithms, broadband seismic sensors, and high-performance computing is revolutionizing the industry. These technologies enable more accurate seismic imaging and faster data processing, reducing project delays and exploration budgets. AI and machine learning algorithms play a significant role in this transformation. They objectively analyze vast datasets, extracting subtle patterns and anomalies that might be missed by manual interpretation. This leads to improved reservoir characterization, optimized well placement, and higher exploration success rates.
  • Furthermore, these solutions significantly reduce turnaround time, enabling faster decision-making and streamlining exploration workflows. Moreover, seismic surveys are essential for reservoir monitoring, hydrocarbon recovery, and optimization. Seismic protection devices and earthquake-resistant structures ensure the safety of human life, property, and the environment during seismic events. Seismic survey equipment, including sensors and streamers, is continually evolving, with cutting-edge technology and techniques being developed to enhance data quality and efficiency. The seismic services market in North America is also expanding to include applications beyond traditional oil and gas exploration. Seismic imaging technology is being used for site characterization, geotechnical assessments, and renewable energy projects, such as offshore wind farms and geothermal energy projects.
  • Technological innovation continues to drive advancements in data processing software, reservoir monitoring techniques, and decision-making processes for exploration, development, and production activities.
  • What challenges does North America Seismic Survey Market face during the growth?

    Environmental scrutiny and regulatory hurdles associated with seismic survey is a key challenge affecting the market growth.

  • Seismic surveys are a crucial aspect of the hydrocarbon industry, providing subsurface insights into hydrocarbon reservoirs through advanced imaging technologies. However, the use of broadband seismic sensors and high-performance computing in seismic data processing and interpretation can raise concerns regarding their impact on the environment, particularly marine life. The deployment of air guns, which emit intense sound waves, can disrupt marine species, leading to potential harm and disruption of migratory patterns and feeding behaviors. Strict environmental assessments and public opposition can result in lengthy permitting processes, causing significant project delays and increased costs. For instance, a recent report by the Center for Biological Diversity revealed permitting delays of up to six years for some seismic surveys in sensitive ecosystems.
  • Indigenous land rights and seismic protection devices are also essential considerations in seismic survey planning. Moreover, technological innovation continues to shape the seismic survey market, with advanced imaging algorithms, seismic protection devices, and earthquake-resistant structures enhancing seismic imaging technology. The industry is also expanding beyond traditional hydrocarbon exploration to include renewable energy projects such as offshore wind farms and geothermal energy projects. Reservoir monitoring and optimization techniques are essential for maximizing hydrocarbon recovery from unconventional resources, and seismic surveys play a vital role in this process. Seismic services, including data processing, interpretation, and permitting requirements, are crucial to the exploration, development, and production activities of the hydrocarbon industry.
  • Seismic survey equipment, including sensors, streamers, and data processing software, continue to evolve to meet the demands of the industry. In conclusion, the market is a dynamic and evolving industry that faces challenges related to environmental concerns, regulatory requirements, and technological innovation. Despite these challenges, the industry continues to provide valuable subsurface insights into hydrocarbon reservoirs and expand into new areas such as renewable energy projects.
  • Exclusive North America Seismic Survey Market Customer Landscape

    The market forecasting report includes the adoption lifecycle of the market, covering from the innovator’s stage to the laggard’s stage. It focuses on adoption rates in different regions based on penetration. Furthermore, the report also includes key purchase criteria and drivers of price sensitivity to help companies evaluate and develop their market growth analysis strategies.
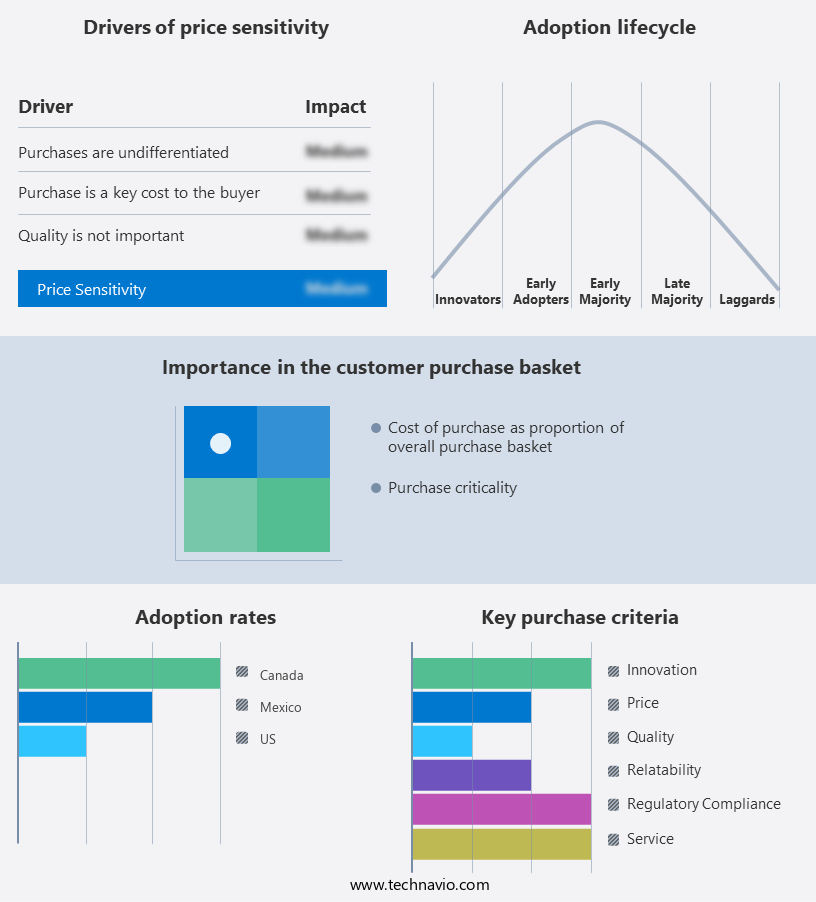
    Seismic Survey Market in North America Share by Geography

     Customer Landscape

    Key Companies & Market Insights

    Companies are implementing various strategies, such as strategic alliances, market forecast partnerships, mergers and acquisitions, geographical expansion, and product/service launches, to enhance their presence In the market.

    The market research and growth report includes detailed analyses of the competitive landscape of the market and information about key companies, including:

    • Agile Seismic LLC
    • Amerapex Corp.
    • CGG SA
    • China National Petroleum Corp.
    • Earth Signal Processing Ltd.
    • Echo Seismic Ltd.
    • Fairfield Geotechnologies
    • Fugro NV
    • Halliburton Co.
    • PGS ASA
    • PT Pertamina Persero
    • Pulse Seismic Inc.
    • SAExploration Holdings Inc.
    • Schlumberger Ltd.
    • Seitel Inc.
    • Terrex Seismic
    • TGS NOPEC Geophysical Co ASA
    • Shearwater GeoServices

    Qualitative and quantitative analysis of companies has been conducted to help clients understand the wider business environment as well as the strengths and weaknesses of key market players. Data is qualitatively analyzed to categorize companies as pure play, category-focused, industry-focused, and diversified; it is quantitatively analyzed to categorize companies as dominant, leading, strong, tentative, and weak.

    Research Analyst Overview

    The market is characterized by the ongoing quest for enhanced subsurface imaging and interpretation to optimize hydrocarbon recovery from both conventional and unconventional resources. This market is driven by the need for accurate and detailed subsurface insights to inform exploration, development, and production activities. Imaging resolution plays a crucial role In the effectiveness of seismic surveys. Advanced imaging algorithms and high-performance computing enable the processing of vast amounts of data, leading to improved subsurface characterization. Broadband seismic sensors, which capture a wider range of frequencies than traditional sensors, provide more detailed images of the subsurface. Seismic services companies offer a range of processing and interpretation services to help clients make informed decisions about their hydrocarbon reservoirs.

    These services include data processing, optimization, and reservoir monitoring. Seismic protection devices are also essential to ensure the safety of human life, property, and the environment during seismic surveys. The use of seismic technology extends beyond the oil and gas industry. In the renewable energy sector, seismic surveys are employed for site characterization and geotechnical assessments for offshore wind farms and geothermal energy projects. Technological innovation continues to drive advancements in seismic imaging technology, with cutting-edge equipment and techniques being developed to improve efficiency and accuracy. Seismic surveys involve the deployment of sensors, such as streamers and sensors, to collect data.

    Data processing software is then used to analyze the data and extract valuable subsurface insights. Seismic protection measures, including earthquake-resistant structures, are essential to ensure the safety and reliability of seismic survey equipment during seismic events. The market is subject to various market dynamics, including exploration budgets, project delays, permitting requirements, and indigenous land rights. Navigating these complexities requires a deep understanding of the regulatory landscape and stakeholder engagement. In conclusion, the market is a dynamic and evolving industry that plays a critical role In the exploration, development, and production of hydrocarbon resources. The use of advanced imaging algorithms, high-performance computing, and cutting-edge equipment enables more accurate subsurface characterization, leading to improved decision-making and optimized hydrocarbon recovery.

    The market also extends to the renewable energy sector, where seismic surveys are employed for site characterization and geotechnical assessments. The ongoing quest for technological innovation and regulatory compliance will continue to shape the market In the coming years.

    Market Scope

    Report Coverage

    Details

    Page number

    137

    Base year

    2023

    Historic period

    2018-2022

    Forecast period

    2024-2028

    Growth momentum & CAGR

    Accelerate at a CAGR of 4.46%

    Market growth 2024-2028

    USD 2.34 billion

    Market structure

    Fragmented

    YoY growth 2023-2024(%)

    4.32

    Competitive landscape

    Leading Companies, Market Positioning of Companies, Competitive Strategies, and Industry Risks

    Request Free Sample

    What are the Key Data Covered in this Market Research Report?

    • CAGR of the market during the forecast period
    • Detailed information on factors that will drive the market growth and forecasting between 2024 and 2028
    • Precise estimation of the size of the market  and its contribution of the market in focus to the parent market
    • Accurate predictions about upcoming market growth and trends and changes in consumer behaviour
    • Growth of the market across North America
    • Thorough analysis of the market’s competitive landscape and detailed information about companies
    • Comprehensive analysis of factors that will challenge the growth of market companies

    We can help! Our analysts can customize this market research report to meet your requirements Get in touch


    1 Executive Summary

    • 1.1 Market overview
      • Exhibit 01: Executive Summary – Chart on Market Overview
      • Exhibit 02: Executive Summary – Data Table on Market Overview
      • Exhibit 03: Executive Summary – Chart on Country Market Characteristics
      • Exhibit 04: Executive Summary – Chart on Market by Geography
      • Exhibit 05: Executive Summary – Chart on Market Segmentation by Type
      • Exhibit 06: Executive Summary – Chart on Market Segmentation by End-user
      • Exhibit 07: Executive Summary – Chart on Incremental Growth
      • Exhibit 08: Executive Summary – Data Table on Incremental Growth
      • Exhibit 09: Executive Summary – Chart on Vendor Market Positioning

    2 Market Landscape

    • 2.1 Market ecosystem
      • Exhibit 10: Parent market
      • Exhibit 11: Market Characteristics

    3 Market Sizing

    • 3.1 Market definition
      • Exhibit 12: Offerings of vendors included in the market definition
    • 3.2 Market segment analysis
      • Exhibit 13: Market segments
    • 3.3 Market size 2023
      • 3.4 Market outlook: Forecast for 2023-2028
        • Exhibit 14: Chart on North America - Market size and forecast 2023-2028 ($ billion)
        • Exhibit 15: Data Table on Regional - Market size and forecast 2023-2028 ($ billion)
        • Exhibit 16: Chart on North America: Year-over-year growth 2023-2028 (%)
        • Exhibit 17: Data Table on Regional - Market size and forecast 2023-2028 ($ billion)

      4 Historic Market Size

      • 4.1 Seismic survey market in North America 2018 - 2022
        • Exhibit 18: Historic Market Size – Data Table on seismic survey market in north America 2018 - 2022 ($ billion)
      • 4.2 Type Segment Analysis 2018 - 2022
        • Exhibit 19: Historic Market Size – Type Segment 2018 - 2022 ($ billion)
      • 4.3 End-User Segment Analysis 2018 - 2022
        • Exhibit 20: Historic Market Size – End-User Segment 2018 - 2022 ($ billion)
      • 4.4 Geography Segment Analysis 2018 - 2022
        • Exhibit 21: Historic Market Size – Geography Segment 2018 - 2022 ($ billion)

      5 Five Forces Analysis

      • 5.1 Five forces summary
        • Exhibit 22: Five forces analysis - Comparison between 2023 and 2028
      • 5.2 Bargaining power of buyers
        • Exhibit 23: Chart on Bargaining power of buyers – Impact of key factors 2023 and 2028
      • 5.3 Bargaining power of suppliers
        • Exhibit 24: Bargaining power of suppliers – Impact of key factors in 2023 and 2028
      • 5.4 Threat of new entrants
        • Exhibit 25: Threat of new entrants – Impact of key factors in 2023 and 2028
      • 5.5 Threat of substitutes
        • Exhibit 26: Threat of substitutes – Impact of key factors in 2023 and 2028
      • 5.6 Threat of rivalry
        • Exhibit 27: Threat of rivalry – Impact of key factors in 2023 and 2028
      • 5.7 Market condition
        • Exhibit 28: Chart on Market condition - Five forces 2023 and 2028

      6 Market Segmentation by Type

      • 6.1 Market segments
        • Exhibit 29: Chart on Type - Market share 2023-2028 (%)
        • Exhibit 30: Data Table on Type - Market share 2023-2028 (%)
      • 6.2 Comparison by Type
        • Exhibit 31: Chart on Comparison by Type
        • Exhibit 32: Data Table on Comparison by Type
      • 6.3 Data acquisition - Market size and forecast 2023-2028
        • Exhibit 33: Chart on Data acquisition - Market size and forecast 2023-2028 ($ billion)
        • Exhibit 34: Data Table on Data acquisition - Market size and forecast 2023-2028 ($ billion)
        • Exhibit 35: Chart on Data acquisition - Year-over-year growth 2023-2028 (%)
        • Exhibit 36: Data Table on Data acquisition - Year-over-year growth 2023-2028 (%)
      • 6.4 Data processing - Market size and forecast 2023-2028
        • Exhibit 37: Chart on Data processing - Market size and forecast 2023-2028 ($ billion)
        • Exhibit 38: Data Table on Data processing - Market size and forecast 2023-2028 ($ billion)
        • Exhibit 39: Chart on Data processing - Year-over-year growth 2023-2028 (%)
        • Exhibit 40: Data Table on Data processing - Year-over-year growth 2023-2028 (%)
      • 6.5 Data interpretation - Market size and forecast 2023-2028
        • Exhibit 41: Chart on Data interpretation - Market size and forecast 2023-2028 ($ billion)
        • Exhibit 42: Data Table on Data interpretation - Market size and forecast 2023-2028 ($ billion)
        • Exhibit 43: Chart on Data interpretation - Year-over-year growth 2023-2028 (%)
        • Exhibit 44: Data Table on Data interpretation - Year-over-year growth 2023-2028 (%)
      • 6.6 Market opportunity by Type
        • Exhibit 45: Market opportunity by Type ($ billion)
        • Exhibit 46: Data Table on Market opportunity by Type ($ billion)

      7 Market Segmentation by End-user

      • 7.1 Market segments
        • Exhibit 47: Chart on End-user - Market share 2023-2028 (%)
        • Exhibit 48: Data Table on End-user - Market share 2023-2028 (%)
      • 7.2 Comparison by End-user
        • Exhibit 49: Chart on Comparison by End-user
        • Exhibit 50: Data Table on Comparison by End-user
      • 7.3 Oil and gas - Market size and forecast 2023-2028
        • Exhibit 51: Chart on Oil and gas - Market size and forecast 2023-2028 ($ billion)
        • Exhibit 52: Data Table on Oil and gas - Market size and forecast 2023-2028 ($ billion)
        • Exhibit 53: Chart on Oil and gas - Year-over-year growth 2023-2028 (%)
        • Exhibit 54: Data Table on Oil and gas - Year-over-year growth 2023-2028 (%)
      • 7.4 Others - Market size and forecast 2023-2028
        • Exhibit 55: Chart on Others - Market size and forecast 2023-2028 ($ billion)
        • Exhibit 56: Data Table on Others - Market size and forecast 2023-2028 ($ billion)
        • Exhibit 57: Chart on Others - Year-over-year growth 2023-2028 (%)
        • Exhibit 58: Data Table on Others - Year-over-year growth 2023-2028 (%)
      • 7.5 Market opportunity by End-user
        • Exhibit 59: Market opportunity by End-user ($ billion)
        • Exhibit 60: Data Table on Market opportunity by End-user ($ billion)

      8 Customer Landscape

      • 8.1 Customer landscape overview
        • Exhibit 61: Analysis of price sensitivity, lifecycle, customer purchase basket, adoption rates, and purchase criteria

      9 Geographic Landscape

      • 9.1 Geographic segmentation
        • Exhibit 62: Chart on Market share by geography - 2023-2028 (%)
        • Exhibit 63: Data Table on Market share by geography - 2023-2028 (%)
      • 9.2 Geographic comparison
        • Exhibit 64: Chart on Geographic comparison
        • Exhibit 65: Data Table on Geographic comparison
      • 9.3 US - Market size and forecast 2023-2028
        • Exhibit 66: Chart on US - Market size and forecast 2023-2028 ($ billion)
        • Exhibit 67: Data Table on US - Market size and forecast 2023-2028 ($ billion)
        • Exhibit 68: Chart on US - Year-over-year growth 2023-2028 (%)
        • Exhibit 69: Data Table on US - Year-over-year growth 2023-2028 (%)
      • 9.4 Canada - Market size and forecast 2023-2028
        • Exhibit 70: Chart on Canada - Market size and forecast 2023-2028 ($ billion)
        • Exhibit 71: Data Table on Canada - Market size and forecast 2023-2028 ($ billion)
        • Exhibit 72: Chart on Canada - Year-over-year growth 2023-2028 (%)
        • Exhibit 73: Data Table on Canada - Year-over-year growth 2023-2028 (%)
      • 9.5 Mexico - Market size and forecast 2023-2028
        • Exhibit 74: Chart on Mexico - Market size and forecast 2023-2028 ($ billion)
        • Exhibit 75: Data Table on Mexico - Market size and forecast 2023-2028 ($ billion)
        • Exhibit 76: Chart on Mexico - Year-over-year growth 2023-2028 (%)
        • Exhibit 77: Data Table on Mexico - Year-over-year growth 2023-2028 (%)
      • 9.6 Market opportunity by geography
        • Exhibit 78: Market opportunity by geography ($ billion)
        • Exhibit 79: Data Table on Market opportunity by geography ($ billion)

      10 Drivers, Challenges, and Trends

      • 10.1 Market drivers
        • 10.2 Market challenges
          • 10.3 Impact of drivers and challenges
            • Exhibit 80: Impact of drivers and challenges in 2023 and 2028
          • 10.4 Market trends

            11 Vendor Landscape

            • 11.1 Overview
              • 11.2 Vendor landscape
                • Exhibit 81: Overview on Criticality of inputs and Factors of differentiation
              • 11.3 Landscape disruption
                • Exhibit 82: Overview on factors of disruption
              • 11.4 Industry risks
                • Exhibit 83: Impact of key risks on business

              12 Vendor Analysis

              • 12.1 Vendors covered
                • Exhibit 84: Vendors covered
              • 12.2 Market positioning of vendors
                • Exhibit 85: Matrix on vendor position and classification
              • 12.3 Agile Seismic LLC
                • Exhibit 86: Agile Seismic LLC - Overview
                • Exhibit 87: Agile Seismic LLC - Product / Service
                • Exhibit 88: Agile Seismic LLC - Key offerings
              • 12.4 Amerapex Corp.
                • Exhibit 89: Amerapex Corp. - Overview
                • Exhibit 90: Amerapex Corp. - Product / Service
                • Exhibit 91: Amerapex Corp. - Key offerings
              • 12.5 CGG SA
                • Exhibit 92: CGG SA - Overview
                • Exhibit 93: CGG SA - Business segments
                • Exhibit 94: CGG SA - Key offerings
                • Exhibit 95: CGG SA - Segment focus
              • 12.6 China National Petroleum Corp.
                • Exhibit 96: China National Petroleum Corp. - Overview
                • Exhibit 97: China National Petroleum Corp. - Product / Service
                • Exhibit 98: China National Petroleum Corp. - Key offerings
              • 12.7 Earth Signal Processing Ltd.
                • Exhibit 99: Earth Signal Processing Ltd. - Overview
                • Exhibit 100: Earth Signal Processing Ltd. - Product / Service
                • Exhibit 101: Earth Signal Processing Ltd. - Key offerings
              • 12.8 Echo Seismic Ltd.
                • Exhibit 102: Echo Seismic Ltd. - Overview
                • Exhibit 103: Echo Seismic Ltd. - Product / Service
                • Exhibit 104: Echo Seismic Ltd. - Key offerings
              • 12.9 Fairfield Geotechnologies
                • Exhibit 105: Fairfield Geotechnologies - Overview
                • Exhibit 106: Fairfield Geotechnologies - Product / Service
                • Exhibit 107: Fairfield Geotechnologies - Key offerings
              • 12.10 Halliburton Co.
                • Exhibit 108: Halliburton Co. - Overview
                • Exhibit 109: Halliburton Co. - Business segments
                • Exhibit 110: Halliburton Co. - Key news
                • Exhibit 111: Halliburton Co. - Key offerings
                • Exhibit 112: Halliburton Co. - Segment focus
              • 12.11 PGS ASA
                • Exhibit 113: PGS ASA - Overview
                • Exhibit 114: PGS ASA - Product / Service
                • Exhibit 115: PGS ASA - Key offerings
              • 12.12 Pulse Seismic Inc.
                • Exhibit 116: Pulse Seismic Inc. - Overview
                • Exhibit 117: Pulse Seismic Inc. - Product / Service
                • Exhibit 118: Pulse Seismic Inc. - Key offerings
              • 12.13 Schlumberger Ltd.
                • Exhibit 119: Schlumberger Ltd. - Overview
                • Exhibit 120: Schlumberger Ltd. - Business segments
                • Exhibit 121: Schlumberger Ltd. - Key news
                • Exhibit 122: Schlumberger Ltd. - Key offerings
                • Exhibit 123: Schlumberger Ltd. - Segment focus
              • 12.14 Seitel Inc.
                • Exhibit 124: Seitel Inc. - Overview
                • Exhibit 125: Seitel Inc. - Product / Service
                • Exhibit 126: Seitel Inc. - Key offerings
              • 12.15 Shearwater GeoServices
                • Exhibit 127: Shearwater GeoServices - Overview
                • Exhibit 128: Shearwater GeoServices - Product / Service
                • Exhibit 129: Shearwater GeoServices - Key offerings
              • 12.16 Terrex Seismic
                • Exhibit 130: Terrex Seismic - Overview
                • Exhibit 131: Terrex Seismic - Product / Service
                • Exhibit 132: Terrex Seismic - Key offerings
              • 12.17 TGS NOPEC Geophysical Co ASA
                • Exhibit 133: TGS NOPEC Geophysical Co ASA - Overview
                • Exhibit 134: TGS NOPEC Geophysical Co ASA - Business segments
                • Exhibit 135: TGS NOPEC Geophysical Co ASA - Key offerings
                • Exhibit 136: TGS NOPEC Geophysical Co ASA - Segment focus

              13 Appendix

              • 13.1 Scope of the report
                • 13.2 Inclusions and exclusions checklist
                  • Exhibit 137: Inclusions checklist
                  • Exhibit 138: Exclusions checklist
                • 13.3 Currency conversion rates for US$
                  • Exhibit 139: Currency conversion rates for US$
                • 13.4 Research methodology
                  • Exhibit 140: Research methodology
                  • Exhibit 141: Validation techniques employed for market sizing
                  • Exhibit 142: Information sources
                • 13.5 List of abbreviations
                  • Exhibit 143: List of abbreviations

                Research Methodology

                Technavio presents a detailed picture of the market by way of study, synthesis, and summation of data from multiple sources. The analysts have presented the various facets of the market with a particular focus on identifying the key industry influencers. The data thus presented is comprehensive, reliable, and the result of extensive research, both primary and secondary.

                INFORMATION SOURCES

                Primary sources

                • Manufacturers and suppliers
                • Channel partners
                • Industry experts
                • Strategic decision makers

                Secondary sources

                • Industry journals and periodicals
                • Government data
                • Financial reports of key industry players
                • Historical data
                • Press releases

                DATA ANALYSIS

                Data Synthesis

                • Collation of data
                • Estimation of key figures
                • Analysis of derived insights

                Data Validation

                • Triangulation with data models
                • Reference against proprietary databases
                • Corroboration with industry experts

                REPORT WRITING

                Qualitative

                • Market drivers
                • Market challenges
                • Market trends
                • Five forces analysis

                Quantitative

                • Market size and forecast
                • Market segmentation
                • Geographical insights
                • Competitive landscape

                Interested in this report?

                Get your sample now to see our research methodology and insights!

                Download Now

                Frequently Asked Questions

                Seismic Surveyin North America market growth will increase by $ 2.34 bn during 2024-2028.

                The Seismic Surveyin North America market is expected to grow at a CAGR of 4.46% during 2024-2028.

                Seismic Surveyin North America market is segmented by Type( Data acquisition, Data processing, Data interpretation) End-user( Oil, gas, Others)

                Agile Seismic LLC, Amerapex Corp., CGG SA, China National Petroleum Corp., Earth Signal Processing Ltd., Echo Seismic Ltd., Fairfield Geotechnologies, Fugro NV, Halliburton Co., PGS ASA, PT Pertamina Persero, Pulse Seismic Inc., SAExploration Holdings Inc., Schlumberger Ltd., Seitel Inc., Terrex Seismic, TGS NOPEC Geophysical Co ASA, Shearwater GeoServices are a few of the key vendors in the Seismic Surveyin North America market.

                North America will register the highest growth rate of 100% among the other regions. Therefore, the Seismic Surveyin North America market in North America is expected to garner significant business opportunities for the vendors during the forecast period.

                US, Canada, Mexico

                • Rise in deepwater and ultra-deepwater E and P projectsVendors in oil and gas upstream sectors have been extracting oil and natural gas from onshore wells for many years. Offshore wells are also popular sources of oil and gas E and P. In offshore E and P is the driving factor this market.
                • oil and gas companies are shifting their focus from shallow waters to deepwater and ultra-deepwater resources due to the presence of large is the driving factor this market.
                • untapped reserves. The production of oil is the driving factor this market.
                • particularly in the subsea environment is the driving factor this market.
                • is more expensive than in the conventional offshore environment. Furthermore is the driving factor this market.
                • data acquisition and drilling in offshore locations is also more challenging than in onshore locations owing to the harsh environment. The depletion of easy-to-extract oil resources has resulted in an increase in the cost of hydrocarbon acquisition is the driving factor this market.
                • along with the geographical displacement of drilling operations. Thus is the driving factor this market.
                • with the depletion of resources in easily accessible locations is the driving factor this market.
                • such as onshore wells is the driving factor this market.
                • E and P companies are looking for less explored areas. As a result is the driving factor this market.
                • the number of offshore drilling projects is increasing. In addition is the driving factor this market.
                • the economics of offshore drilling is becoming feasible with the increase in crude oil prices. As per the US EIA is the driving factor this market.
                • global offshore deepwater oil production will increase by 2.7 mbpd between 2017 and 2040. is the driving factor this market.
                • owing to the rising demand for oil and gas across North America. Offshore investments have reached approximately $155 billion in 2022 from $145 billion in 2021. Offshore projects will also provide ample opportunities for contractors. For instance is the driving factor this market.
                • the North Platte project of TotalEnergies entered the final stage of its tender process in 2023. Similarly is the driving factor this market.
                • in June 2023 is the driving factor this market.
                • Woodside announced an investment of $7.2 billion in the development of Mexicos deepwater oil project. Mexican deepwater offshore oil production will begin with the Trion oil field in 2024 is the driving factor this market.
                • a joint venture with the state-owned Petroleos Mexicanos oil business. Due to the increase in the number of deepwater and ultra-deepwater projects is the driving factor this market.
                • an increase in investment is expected to be directed toward offshore E and P activities is the driving factor this market.
                • which will drive the demand for seismic surveys and is the driving factor this market.
                • in turn is the driving factor this market.
                • will drive the growth of the seismic survey market in North America market during the forecast period. is the driving factor this market.

                The Seismic Surveyin North America market vendors should focus on grabbing business opportunities from the Data acquisition segment as it accounted for the largest market share in the base year.
                RIA - Research AI Assistant
                Ask RIA