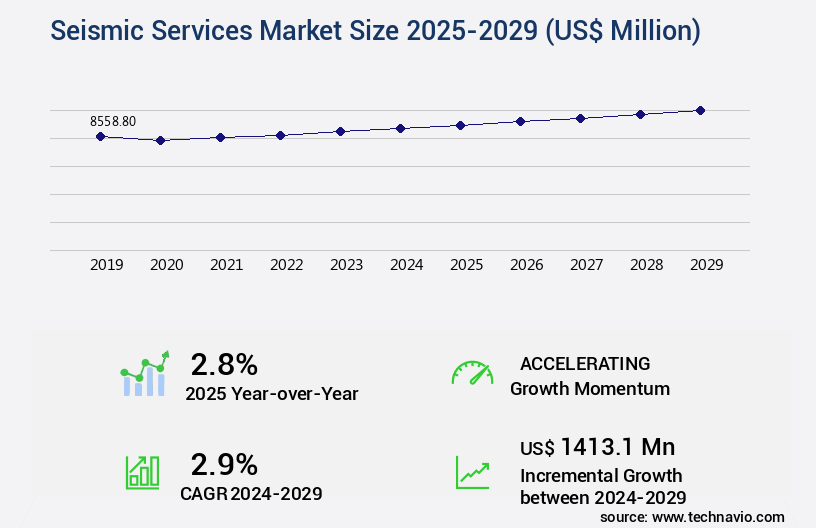
Seismic Services Market Size 2025-2029
The seismic services market size is valued to increase USD 1.41 billion, at a CAGR of 2.9% from 2024 to 2029. Rising multi-client survey as well as geophysical services approach in seismic services will drive the seismic services market.
Major Market Trends & Insights
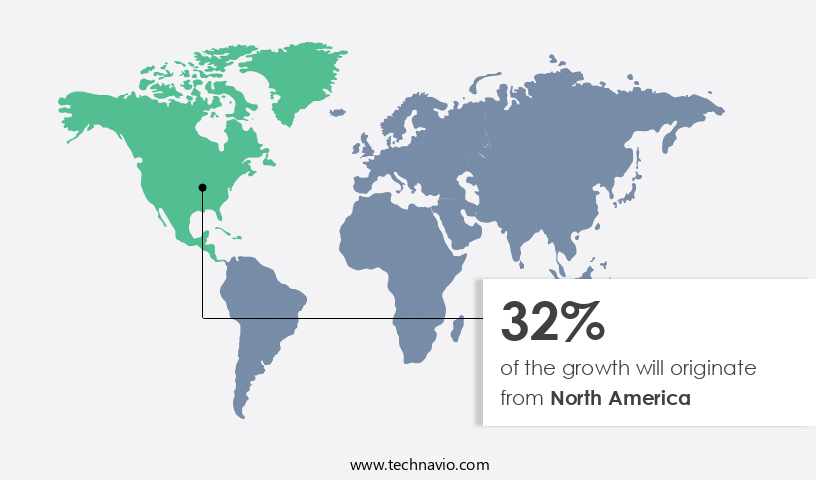
- North America dominated the market and accounted for a 32% growth during the forecast period.
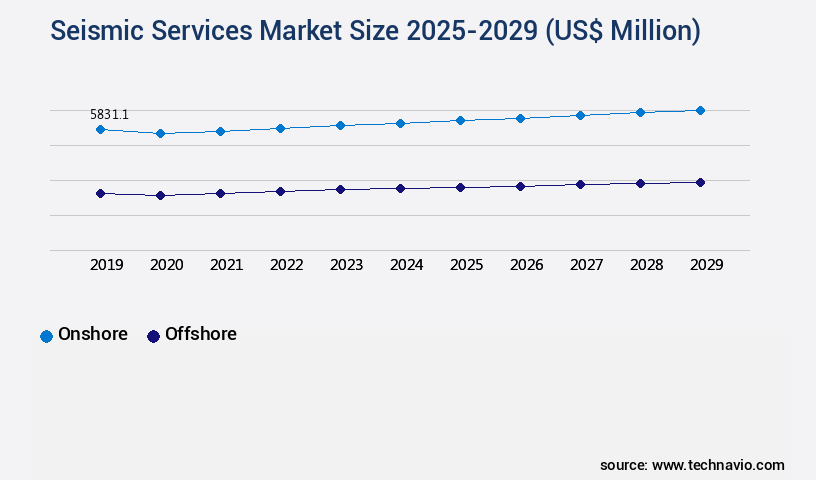
- By Deployment - Onshore segment was valued at USD 5.83 billion in 2023
- By Service - Data acquisition segment accounted for the largest market revenue share in 2023
Market Size & Forecast
- Market Opportunities: USD 23.68 million
- Market Future Opportunities: USD 1413.10 million
- CAGR : 2.9%
- North America: Largest market in 2023
Market Summary
- The market encompasses a dynamic and continually evolving industry, driven by advancements in core technologies and applications. Notably, the rising multi-client survey approach and increasing adoption of 4D seismic survey technology are key market trends. However, the market faces challenges such as overcapacity with regard to seismic survey vessel fleets. According to a recent report, the 4D seismic survey technology market is projected to reach a 30% market share by 2025, underscoring its growing importance. Seismic services play a critical role in optimizing rigless intervention services by providing precise subsurface data.
- This evolving landscape presents significant opportunities for service providers and technology innovators in the seismic services sector.
What will be the Size of the Seismic Services Market during the forecast period?
Get Key Insights on Market Forecast (PDF) Request Free Sample
How is the Seismic Services Market Segmented and what are the key trends of market segmentation?
The seismic services industry research report provides comprehensive data (region-wise segment analysis), with forecasts and estimates in "USD million" for the period 2025-2029, as well as historical data from 2019-2023 for the following segments.
- Deployment
- Onshore
- Offshore
- Service
- Data acquisition
- Data processing and interpretation
- End-user
- Oil and gas companies
- Mining companies
- Government and research institutions
- Environmental agencies
- Utility and infrastructure developers
- Geography
- North America
- US
- Canada
- Europe
- Germany
- Norway
- Russia
- UK
- APAC
- Australia
- China
- India
- Rest of World (ROW)
- North America
By Deployment Insights
The onshore segment is estimated to witness significant growth during the forecast period.
Seismic services play a pivotal role in the hydrocarbon exploration industry, with seismic reflection data serving as the foundation for reservoir characterization and structural geology analysis. Seismic velocity analysis, a critical component of seismic data processing, aids in understanding the wave propagation characteristics of the subsurface. This data is then subjected to various seismic inversion methods and interpretation techniques to extract valuable insights. Seismic data acquisition employs various technologies, including 2D, 3D, and 4D seismic surveys. While 2D surveys are cost-effective and suitable for surface-level surveys, they yield lower quality data compared to their sub-surface counterparts. Conversely, 3D and 4D seismic surveys provide more comprehensive data sets, enabling better reservoir characterization and structural understanding.
Advanced seismic imaging methods, such as pre-stack depth migration and post-stack migration, offer improved subsurface imaging. Seismic modeling and geophysical interpretation are essential for understanding the acquired data and making informed decisions. Furthermore, seismic monitoring and attribute analysis contribute to identifying hydrocarbon reservoirs and assessing their productivity. Geophysical data acquisition and processing are integral parts of the market. Seismic hazard assessment, induced seismicity, and time-lapse seismic are essential applications in this context. Seismic tomography and microseismic monitoring provide valuable insights into the subsurface, enhancing the overall efficiency of exploration activities. The market is experiencing significant growth, with reservoir simulation, AVO analysis, and full waveform inversion being key drivers.
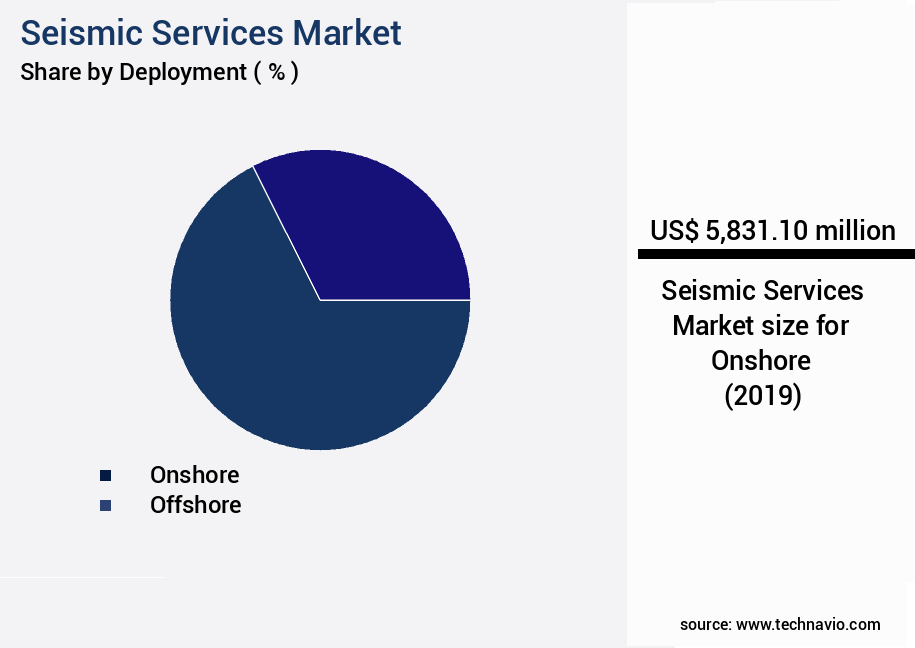
The Onshore segment was valued at USD 5.83 billion in 2019 and showed a gradual increase during the forecast period.
According to recent studies, the market for seismic services is projected to expand by 15% in the next two years. Additionally, the adoption of advanced seismic technologies, such as ground penetrating radar and 4D seismic, is expected to fuel further growth. Despite the high initial investment, the use of advanced seismic technologies provides substantial benefits, including improved reservoir characterization, enhanced hydrocarbon recovery, and reduced drilling risks. As the energy industry continues to evolve, the role of seismic services in hydrocarbon exploration will remain indispensable.
Regional Analysis
North America is estimated to contribute 32% to the growth of the global market during the forecast period. Technavio's analysts have elaborately explained the regional trends and drivers that shape the market during the forecast period.
See How Seismic Services Market Demand is Rising in North America Request Free Sample
In 2024, North America emerged as a significant contributor to the market, with the US and Canada leading the charge. These countries, known for their extensive oil and gas reserves, are among the world's largest producers. Unconventional exploration and production (E&P) activities, such as shale drilling in the US and oil sands development in Canada, have driven a notable increase in oil and gas production. By December 2024, Canada had become one of the top five crude oil producers worldwide, supplying a substantial amount of reliable crude oil to international markets.
The country's crude oil and equivalent products production saw a 2% growth that year. As a professional, it's essential to acknowledge the market's dynamics, with the US and Canada's contributions being a testament to the industry's resilience and growth.
Market Dynamics
Our researchers analyzed the data with 2024 as the base year, along with the key drivers, trends, and challenges. A holistic analysis of drivers will help companies refine their marketing strategies to gain a competitive advantage.
The market encompasses a range of technologies and techniques used to explore and characterize subsurface geology for various energy and resource applications. Seismic data acquisition employs advanced techniques for deepwater exploration, capturing data essential for understanding complex geological structures. Subsequently, sophisticated seismic processing workflows refine this data, enabling accurate interpretation using machine learning algorithms and seismic inversion for reservoir characterization. Time-lapse seismic monitoring plays a crucial role in enhanced oil recovery, while microseismic monitoring informs hydraulic fracturing operations. Seismic hazard assessment is vital for safeguarding critical infrastructure, and integrating seismic data with other geophysical datasets enhances exploration efforts. Seismic attributes are used for reservoir prediction, and high-resolution seismic imaging techniques provide detailed insights into subsurface structures.
Seismic methods are increasingly applied for geothermal energy exploration, with advanced interpretation techniques uncovering unconventional resources. Full waveform inversion and pre-stack depth migration offer improved imaging capabilities beneath complex structures, while seismic velocity analysis impacts hydrocarbon exploration. AVO analysis identifies hydrocarbon reservoirs, and seismic reflection data processing enhances image quality. Seismic refraction data acquisition targets shallow subsurface imaging, and seismic modeling aids in understanding wave propagation. The industrial application segment dominates the market, accounting for a significantly larger share compared to the academic segment. This can be attributed to the high demand for seismic data in the oil and gas industry, which drives innovation and investment in seismic technologies. Despite the industrial focus, academic research continues to contribute valuable insights, fostering advancements in seismic exploration and interpretation techniques.
The seismic services market is evolving rapidly with a focus on improving subsurface imaging and risk assessment. Innovations in seismic data acquisition techniques for deepwater exploration are enabling better resolution in challenging offshore environments. Advanced seismic processing workflows for complex geology help extract clearer signals in structurally intricate regions. Seismic interpretation using machine learning algorithms is enhancing the accuracy and speed of data analysis, while the application of seismic inversion for reservoir characterization is providing more detailed rock and fluid property estimations. Time-lapse seismic monitoring for enhanced oil recovery allows operators to track fluid movement over time, and microseismic monitoring of hydraulic fracturing operations is key for understanding fracture dynamics. Seismic hazard assessment for critical infrastructure supports safer construction practices, and integration of seismic data with other geophysical datasets is driving more holistic subsurface models. Additionally, the use of seismic attributes for reservoir prediction and the development of high-resolution seismic imaging techniques continue to improve exploration and production outcomes.
What are the key market drivers leading to the rise in the adoption of Seismic Services Industry?
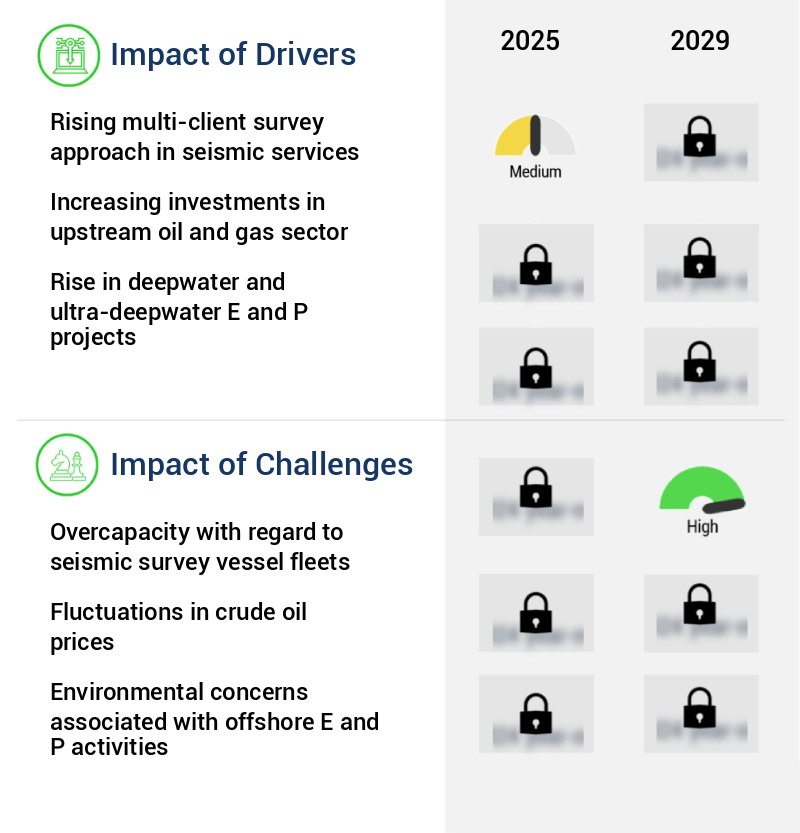
- The rising adoption of the multi-client survey approach in seismic services is the primary catalyst driving market growth in this sector.
- Seismic survey data, essential for the oil and gas industry, is collected over extensive land areas by seismic service providers. Instead of owning the data exclusively, many companies opt for a multi-client approach, where the provider licenses the data to multiple entities. This strategy reduces per-unit-area costs for clients. However, the cost of data ownership has led to a market shift, with interpretation becoming more valuable than sole possession. In this model, seismic service providers tailor surveys based on E and P companies' specifications.
- They assume all risks and expenses, making it a cost-effective solution for industry participants. The multi-client approach's popularity stems from its ability to provide access to high-quality data at a lower cost, fostering collaboration and innovation within the sector.
What are the market trends shaping the Seismic Services Industry?
- The increasing adoption of 4D seismic survey technology is becoming a prominent trend in the market. This advanced technology is gaining significant traction in the industry.
- The identification of oil reserves has historically relied on 2D and 3D seismic techniques for acquiring marine seismic data. Traditional 2D seismic methods employ reflected acoustic waves to generate seismic images of geological structures using air guns. Despite only imaging a cross-section of the underlying geology, the 2D seismic method has been a vital tool in the industry. However, the 3D seismic method has gained traction due to its ability to produce a three-dimensional representation of the geology using multiple seismic cables and sources.
- In recent years, the 4D seismic method has emerged as a significant advancement. This technique offers enhanced data quality for E and P activities by monitoring reservoir changes over time. The adoption of 4D seismic methods represents a notable shift in the industry, providing a more comprehensive understanding of geological structures and hydrocarbon reserves.
What challenges does the Seismic Services Industry face during its growth?
- Seismic survey vessel fleets facing overcapacity is a significant challenge impeding the growth of the industry. Overcapacity refers to a situation where the available capacity in the fleet exceeds the current demand, resulting in reduced utilization rates and increased competition among operators. This issue not only affects the financial performance of individual companies but also hampers the industry's expansion and innovation. To mitigate this challenge, industry players are exploring various strategies, such as collaboration, fleet optimization, and diversification into new markets and technologies.
- The offshore seismic services sector experienced turbulence prior to the 2014 crude oil price decline. Overcapacity was a significant contributor to instability, with the number of crews and vessels exceeding the demand for new seismic survey projects. This situation was further compounded by the adoption of advanced techniques, which increased competition and reduced the demand for traditional seismic services. The oil price crash in 2014 exacerbated the sector's challenges, as investments in exploration and production (E and P) projects dwindled, leading to a decrease in offshore activities. Despite the industry's struggles, it remained resilient, with companies continuing to invest in research and development to adapt to the evolving market landscape.
- The sector's ongoing transformation was evident in the increasing prevalence of digital technologies and the integration of machine learning algorithms into seismic data processing. The future of offshore seismic services lies in their ability to innovate and adapt to the changing market dynamics.
Exclusive Technavio Analysis on Customer Landscape
The seismic services market forecasting report includes the adoption lifecycle of the market, covering from the innovator's stage to the laggard's stage. It focuses on adoption rates in different regions based on penetration. Furthermore, the seismic services market report also includes key purchase criteria and drivers of price sensitivity to help companies evaluate and develop their market growth analysis strategies.
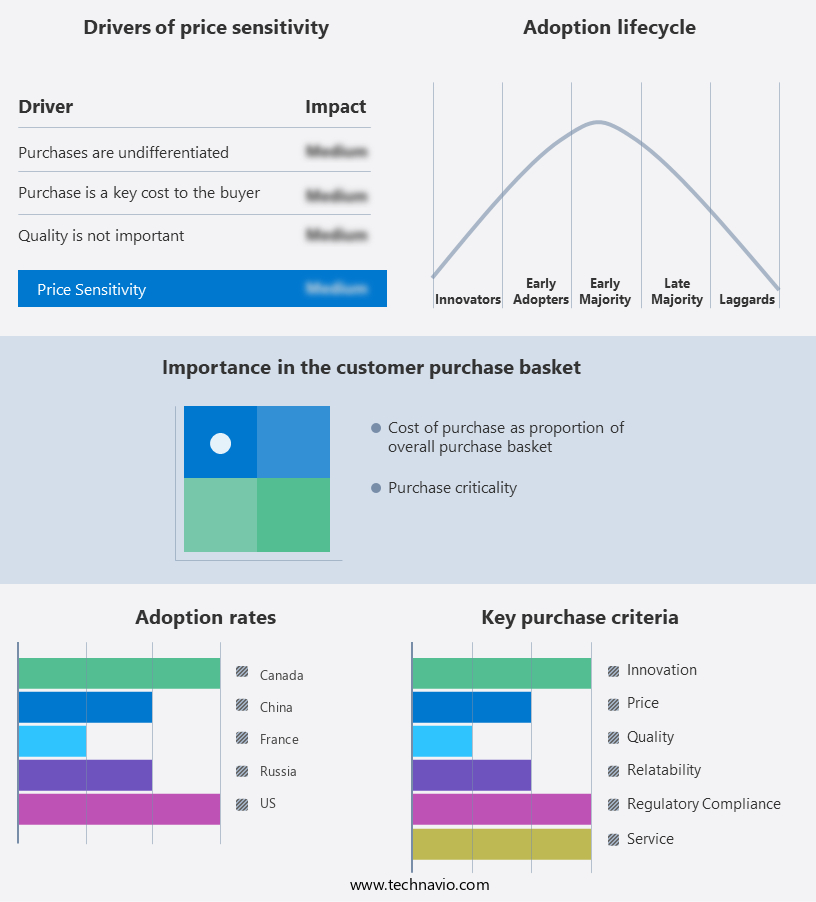
Customer Landscape of Seismic Services Industry
Competitive Landscape
Companies are implementing various strategies, such as strategic alliances, seismic services market forecast, partnerships, mergers and acquisitions, geographical expansion, and product/service launches, to enhance their presence in the industry.
Agile Seismic LLC - The company specializes in providing seismic services, encompassing 2D and 3D data acquisition, processing, and imaging for various industries including oil, gas, mining, and environmental sectors.
The industry research and growth report includes detailed analyses of the competitive landscape of the market and information about key companies, including:
- Agile Seismic LLC
- Alphageo India Ltd.
- Amerapex Corp.
- Asian Energy Services Ltd
- BGP Inc.
- China Oilfield Services Ltd.
- Dawson Geophysical Co.
- Echo Seismic Ltd.
- Fairfield Geotechnologies
- Fugro NV
- GeoKinetics
- Halliburton Co.
- PGS ASA
- Pulse Seismic Inc.
- Schlumberger Ltd.
- SeaBird Exploration Plc
- Shearwater GeoServices AS
- Sinopec Shanghai Petrochemical Co. Ltd.
- TGS ASA
- Viridien SA
Qualitative and quantitative analysis of companies has been conducted to help clients understand the wider business environment as well as the strengths and weaknesses of key industry players. Data is qualitatively analyzed to categorize companies as pure play, category-focused, industry-focused, and diversified; it is quantitatively analyzed to categorize companies as dominant, leading, strong, tentative, and weak.
Recent Development and News in Seismic Services Market
- In January 2024, Schlumberger Limited, a leading provider of technology for the global energy industry, announced the launch of its new 3D seismic imaging technology, "WesternGeco's Falcon Data Processing System," which significantly reduces data processing time and increases survey efficiency (Schlumberger press release, 2024).
- In March 2024, Halliburton Company, another major player in the market, entered into a strategic partnership with GeoPark Limited, a leading independent Latin American oil and gas exploration and production company, to provide seismic data processing services for GeoPark's exploration projects in Colombia and Brazil (Halliburton press release, 2024).
- In May 2024, TGS, a leading global provider of multi-client geoscience data, completed the acquisition of PGS's seismic data library, expanding its multi-client data library by approximately 300,000 square kilometers, making it the largest multi-client data library in the world (TGS press release, 2024).
- In April 2025, the United States Bureau of Ocean Energy Management (BOEM) approved Shell Oil Company's seismic survey plan for the Arctic Outer Continental Shelf, allowing Shell to conduct seismic surveys for potential oil and gas exploration in the Chukchi and Beaufort Seas (BOEM press release, 2025).
Dive into Technavio's robust research methodology, blending expert interviews, extensive data synthesis, and validated models for unparalleled Seismic Services Market insights. See full methodology.
|
Market Scope |
|
|
Report Coverage |
Details |
|
Page number |
225 |
|
Base year |
2024 |
|
Historic period |
2019-2023 |
|
Forecast period |
2025-2029 |
|
Growth momentum & CAGR |
Accelerate at a CAGR of 2.9% |
|
Market growth 2025-2029 |
USD 1413.1 million |
|
Market structure |
Fragmented |
|
YoY growth 2024-2025(%) |
2.8 |
|
Key countries |
US, China, Russia, Canada, Norway, UK, India, Saudi Arabia, Australia, and Germany |
|
Competitive landscape |
Leading Companies, Market Positioning of Companies, Competitive Strategies, and Industry Risks |
Research Analyst Overview
- In the dynamic and evolving realm of geophysical exploration, seismic services continue to play a pivotal role in hydrocarbon discovery and reservoir characterization. Seismic reflection data, a cornerstone of this industry, is meticulously analyzed through seismic velocity analysis to delve deeper into the subsurface. This process aids in the identification of reservoir structures and the assessment of their properties. Seismic data processing techniques, such as wave propagation and seismic refraction data analysis, are employed to enhance the quality of the data. Seismic inversion methods and interpretation techniques are then applied to extract valuable insights from the processed data.
- Seismic data acquisition methods, including 3D and 2D surveys, are continually refined to capture increasingly detailed information. Fault interpretation, a critical aspect of structural geology, is facilitated by seismic imaging methods like seismic tomography. These advanced techniques enable a more nuanced understanding of the subsurface, contributing to more accurate reservoir simulations and time-lapse seismic studies. Seismic modeling and geophysical interpretation are integral components of the seismic workflow, providing insights into the subsurface structure and hydrocarbon potential. Microseismic monitoring and seismic hazard assessment further enhance the value of seismic services by offering real-time data on seismic activity and potential risks.
- Geophysical data acquisition and processing are undergoing constant innovation, with techniques like pre-stack depth migration and post-stack migration improving the accuracy and resolution of seismic data. Additionally, the integration of seismic attribute analysis and ground penetrating radar offers new avenues for exploration and reservoir characterization. The ongoing evolution of seismic services is driven by advancements in technology and the increasing demand for more detailed and accurate subsurface information. This market's continuous unfolding reflects the dynamic nature of the hydrocarbon exploration industry and the relentless pursuit of knowledge beneath the Earth's surface.
What are the Key Data Covered in this Seismic Services Market Research and Growth Report?
-
What is the expected growth of the Seismic Services Market between 2025 and 2029?
-
USD 1.41 billion, at a CAGR of 2.9%
-
-
What segmentation does the market report cover?
-
The report segmented by Deployment (Onshore and Offshore), Service (Data acquisition and Data processing and interpretation), End-user (Oil and gas companies, Mining companies, Government and research institutions, Environmental agencies, and Utility and infrastructure developers), and Geography (North America, Europe, APAC, Middle East and Africa, and South America)
-
-
Which regions are analyzed in the report?
-
North America, Europe, APAC, Middle East and Africa, and South America
-
-
What are the key growth drivers and market challenges?
-
Rising multi-client survey approach in seismic services, Overcapacity with regard to seismic survey vessel fleets
-
-
Who are the major players in the Seismic Services Market?
-
Key Companies Agile Seismic LLC, Alphageo India Ltd., Amerapex Corp., Asian Energy Services Ltd, BGP Inc., China Oilfield Services Ltd., Dawson Geophysical Co., Echo Seismic Ltd., Fairfield Geotechnologies, Fugro NV, GeoKinetics, Halliburton Co., PGS ASA, Pulse Seismic Inc., Schlumberger Ltd., SeaBird Exploration Plc, Shearwater GeoServices AS, Sinopec Shanghai Petrochemical Co. Ltd., TGS ASA, and Viridien SA
-
Market Research Insights
- The market encompasses a range of specialized solutions for exploring and understanding subsurface geology, with a focus on seismic data acquisition, processing, and interpretation. Two key areas of growth in this market are structural mapping and earthquake early warning. Structural mapping utilizes seismic data to create detailed models of the Earth's subsurface, enabling accurate assessment of reservoir properties and improved production optimization. In contrast, earthquake early warning systems leverage advanced seismic instrumentation and real-time data processing to detect and alert of imminent seismic activity, reducing potential damage and risk. Seismic tomography, porosity prediction, and permeability prediction are additional applications that contribute to the market's continuous evolution.
- Seismic attenuation and noise attenuation techniques enhance data quality, while seismic design and seismic hazard maps ensure structural safety. Rock physics, interpretation workflows, and seismic anisotropy are essential components of the data analysis process. Hardware systems and field operations support efficient data collection, while seismic risk assessment, fault detection, and velocity model building are critical for accurate hazard evaluation. Wavelet processing and reflection seismology enable advanced data analysis, and depth conversion and seismic instrumentation facilitate accurate subsurface imaging. Overall, the market demonstrates a dynamic and innovative landscape, driven by ongoing technological advancements and the growing demand for reliable subsurface information.
We can help! Our analysts can customize this seismic services market research report to meet your requirements.
 RIA -
RIA - 
