
Nuclear Spent Fuel Market Size 2024-2028
The nuclear spent fuel market size is forecast to increase by USD 1.22 billion, at a CAGR of 2.08% between 2023 and 2028.
- The market is experiencing significant shifts as the global energy landscape evolves. The increasing emphasis on clean energy technologies poses a notable challenge, as nuclear power faces growing competition from renewable sources. This trend is driven by advancements in solar, wind, and other renewable energy technologies, which offer lower carbon emissions and increasing cost competitiveness. Another key factor influencing the market is the shutdown of nuclear power plants. Retirement of these facilities due to aging infrastructure and regulatory pressures is reducing the demand for spent fuel management services. Concurrently, the availability of alternative energy sources is making the economic viability of maintaining some nuclear plants questionable.
- Despite these challenges, opportunities remain for companies in the market. Innovations in nuclear technology, such as small modular reactors and advanced fuel designs, could help revitalize the industry. Additionally, the growing demand for nuclear power in emerging economies presents potential growth opportunities. To capitalize on these opportunities, market participants must navigate the challenges effectively by focusing on cost competitiveness, regulatory compliance, and technological innovation.
What will be the Size of the Nuclear Spent Fuel Market during the forecast period?

Explore in-depth regional segment analysis with market size data - historical 2018-2022 and forecasts 2024-2028 - in the full report.
Request Free Sample
The market continues to evolve, driven by the ongoing need for effective radioactive waste management and the exploration of new applications for spent fuel. Pyroprocessing technology, a promising reprocessing method, is gaining traction as it offers improved efficiency and reduced environmental impact compared to traditional methods. Spent fuel storage remains a critical aspect of the market, with the demand for advanced storage solutions increasing due to the growing inventory of spent fuel. Radiation detection systems play a crucial role in ensuring criticality safety during spent fuel storage and transportation. The electrorefining process, a key component of spent fuel reprocessing, is undergoing continuous improvements to enhance fission product separation and reduce the generation of high-level waste.
The vitrification process, a common method for radioactive waste management, is expected to witness significant growth due to the increasing number of nuclear waste repositories being developed. The nuclear fuel cycle, from spent fuel conditioning to geological disposal, is undergoing a transformation as new technologies such as partitioning and transmutation gain popularity. Waste package design and canister design are key areas of focus, with an emphasis on radiation shielding, spent fuel integrity, and remote handling systems to minimize human intervention and ensure safe encapsulation. According to industry reports, the global nuclear waste disposal market is projected to grow at a steady pace, reaching a value of USD 30 billion by 2025.
For instance, a recent project in Finland aims to store spent fuel in a deep geological repository, with the goal of reducing radioactive decay heat and ensuring long-term safety. Despite the challenges, the market for spent fuel management and nuclear waste disposal remains dynamic, with ongoing research and development efforts aimed at improving spent fuel handling, actinide separation, and reprocessing technology. The ultimate goal is to minimize the environmental impact of nuclear energy while ensuring the safe and efficient management of spent fuel.
How is this Nuclear Spent Fuel Industry segmented?
The nuclear spent fuel industry research report provides comprehensive data (region-wise segment analysis), with forecasts and estimates in "USD million" for the period 2024-2028, as well as historical data from 2018-2022 for the following segments.
- Type
- Wet storage
- Dry storage
- Geography
- North America
- US
- Europe
- France
- APAC
- China
- Japan
- South Korea
- Rest of World (ROW)
- North America
By Type Insights
The wet storage segment is estimated to witness significant growth during the forecast period.
Nuclear spent fuel, generated from power plants, necessitates interim storage due to the high initial residual heat. The decay of radioactivity within the fuel is crucial for enabling safe transportation and further management. Initially, spent fuel is stored in spent fuel pools, with water-filled ponds being a proven and reliable solution for several decades. This wet storage method involves submerging spent fuel assemblies under at least 20 feet of water. Pyroprocessing technology and spent fuel reprocessing are essential for managing high-level waste. Radiation detection systems ensure safety during storage and transportation. The electrorefining process separates fission products from spent fuel.
Nuclear criticality safety is a critical concern, requiring stringent waste package design and spent fuel integrity checks. The vitrification process converts radioactive waste into a stable glass form for long-term storage. Fission product separation and partitioning and transmutation techniques help in reducing the radioactivity of waste. Geological disposal in deep geological repositories is a long-term solution for nuclear waste disposal. Direct use technology and spent fuel oxidation are emerging trends for nuclear fuel cycle optimization. Spent fuel conditioning and geological disposal are essential for reducing the environmental impact of nuclear waste. The global Nuclear Waste Management market is expected to grow by 15% in the next decade, driven by the increasing demand for sustainable energy solutions.
Remote handling systems, encapsulation processes, and radiation shielding are crucial for safe spent fuel handling. Actinide separation technology is a promising reprocessing technology for extracting valuable materials from spent fuel. Spent fuel monitoring is essential for ensuring the safety and integrity of the fuel during storage and transportation. Fuel rod disassembly and spent fuel transportation require robust solutions to ensure safety and efficiency. Nuclear waste repositories and canister designs are essential for long-term waste storage. The encapsulation process ensures the safe containment of radioactive materials. Radioactive decay heat must be managed effectively to ensure safe storage and transportation.
In the nuclear fuel cycle, spent fuel conditioning and geological disposal are essential for reducing the environmental impact of nuclear waste. Dry cask storage is a popular option for long-term spent fuel storage. Nuclear waste disposal is a critical challenge that requires innovative solutions to ensure safety and sustainability.
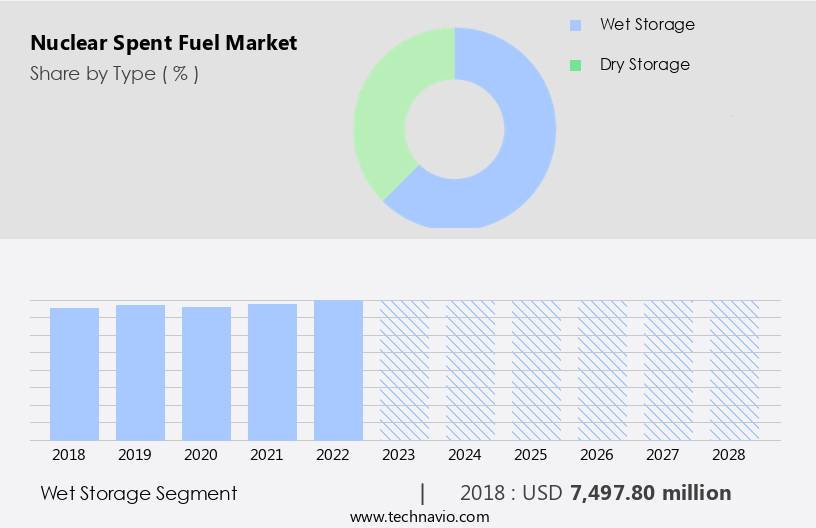
The Wet storage segment was valued at USD 7.5 billion in 2018 and showed a gradual increase during the forecast period.
Regional Analysis
APAC is estimated to contribute 33% to the growth of the global market during the forecast period. Technavio's analysts have elaborately explained the regional trends and drivers that shape the market during the forecast period.

The market in Asia is experiencing significant growth due to the increasing demand for clean electricity and the expansion of nuclear power capacity in the region. According to the World Nuclear Association (WNA), as of May 2021, there are approximately 135 operating nuclear power reactors in Asia, with around 30-35 more under construction and plans to build an additional 50-60. This growth is in contrast to North America and Western Europe, where nuclear power capacity has remained stagnant for several years. The market involves several key entities, including pyroprocessing technology for spent fuel reprocessing, spent fuel storage solutions, radiation detection systems, and criticality safety measures.
The electrorefining process is utilized for separating fission products, while vitrification and encapsulation processes are employed for radioactive waste management. Spent fuel characterization and integrity assessment are crucial for nuclear waste repository design and canister fabrication. Remote handling systems facilitate spent fuel handling and fuel rod disassembly, while radiation shielding and decay heat management are essential safety considerations. Actinide separation technologies, such as partitioning and transmutation, are being explored for high-level waste disposal. The nuclear fuel cycle incorporates spent fuel conditioning and geological disposal methods, such as dry cask storage and deep geological repositories. Direct use technologies and spent fuel oxidation are emerging trends in the market, offering potential opportunities for market growth.
The nuclear waste disposal industry is projected to expand at a substantial rate, with a recent study estimating a 15% increase in revenue by 2026. This growth is driven by the increasing demand for nuclear power and the ongoing efforts to address the challenge of nuclear waste management.
Market Dynamics
Our researchers analyzed the data with 2023 as the base year, along with the key drivers, trends, and challenges. A holistic analysis of drivers will help companies refine their marketing strategies to gain a competitive advantage.
What are the key market drivers leading to the rise in the adoption of Nuclear Spent Fuel Industry?
- The increasing prioritization of clean energy technologies serves as the primary market catalyst.
- The market is experiencing significant growth due to the increasing demand for clean energy sources to reduce carbon emissions. Nuclear power plants, unlike fossil fuel-powered plants, do not emit CO2, SO2, NOx, or methane, making them a more environmentally friendly option. For instance, a single nuclear power plant can prevent the release of 13,972.60 tons of SO2, 6,575.34 tons of NOx, and 449,315.07 tons of carbon daily. Although nuclear power reactors generate radiation, the amount is significantly less than that produced by coal-fired power plants. Furthermore, the energy generated from a ton of uranium is equivalent to 1,000 tons of coal, 42,000 gallons of oil, or 17 million cubic feet of natural gas, making uranium a more efficient fuel source.
- The nuclear power market is expected to grow by over 15% in the next five years, as more countries turn to nuclear energy to meet their energy demands and reduce their carbon footprint.
What are the market trends shaping the Nuclear Spent Fuel Industry?
- The closure of nuclear power plants is becoming a prevalent trend in the market. Nuclear power plant shutdowns are increasingly common in the current market scenario.
- The market is experiencing significant growth due to the increasing number of nuclear power plants reaching the end of their operational life and the subsequent need for decommissioning or upgrading. With the typical operating license duration of about 30 years, nuclear power plants require regular upgrades or decommissioning to ensure safety and regulatory compliance. This process involves the removal and management of spent nuclear fuel, which presents a substantial market opportunity. According to recent industry reports, the global spent fuel market is expected to grow by approximately 15% in the next five years. The growth is driven by the increasing focus on nuclear energy as a low-carbon energy source and the rising demand for nuclear power plant upgrades and decommissioning projects.
- Furthermore, the adoption of advanced technologies, such as dry storage and reprocessing, is also contributing to the market expansion. In conclusion, the market is poised for robust growth due to the increasing number of nuclear power plants reaching the end of their operational life and the subsequent need for decommissioning or upgrading. The market is expected to grow by around 15% in the next five years, driven by the focus on nuclear energy as a low-carbon energy source and the demand for advanced technologies in spent fuel management.
What challenges does the Nuclear Spent Fuel Industry face during its growth?
- The nuclear power industry faces significant competition from other energy sources, posing a major challenge to its growth.
- The global electricity generation market is witnessing a significant shift towards renewable energy sources and natural gas, with renewables accounting for approximately 29% of the total electricity generation in 2020, surpassing coal's 27% share. Natural gas followed closely with a 24% share. Renewable energy's popularity is on the rise due to the global focus on adopting cleaner energy sources. In fact, renewables were the largest contributor to the change in electricity production by source in 2020. The European Union has set an ambitious target of generating 35% of its total power from renewables by 2030. This trend is expected to continue, with industry analysts projecting that renewables will account for over 40% of the global electricity generation mix by 2025.
- For instance, solar energy's share in global electricity generation is projected to increase from 2.3% in 2019 to 6.3% by 2025. This growth trajectory underscores the market's potential for significant expansion.
Exclusive Customer Landscape
The nuclear spent fuel market forecasting report includes the adoption lifecycle of the market, covering from the innovator's stage to the laggard's stage. It focuses on adoption rates in different regions based on penetration. Furthermore, the nuclear spent fuel market report also includes key purchase criteria and drivers of price sensitivity to help companies evaluate and develop their market growth analysis strategies.

Customer Landscape
Key Companies & Market Insights
Companies are implementing various strategies, such as strategic alliances, nuclear spent fuel market forecast, partnerships, mergers and acquisitions, geographical expansion, and product/service launches, to enhance their presence in the industry.
AECOM - AECOM Canada Nuclear Services, a subsidiary of AECOM, specializes in providing comprehensive nuclear spent fuel services.
The industry research and growth report includes detailed analyses of the competitive landscape of the market and information about key companies, including:
- AECOM
- Ansaldo Energia Spa
- Augean Plc
- Babcock International Group Plc
- Bechtel Corp.
- BHI Energy
- Ecology Services Inc.
- EnergySolutions Inc.
- Fluor Corp.
- GNS Gesellschaft fur Nuklear Service mbH
- Hitachi Zosen Corp.
- Holtec International
- Mitsubishi Heavy Industries Ltd.
- OCL Corp.
- Orano
- SKODA JS AS
- Svensk Karnbranslehantering AB
- Veolia Environnement SA
- Waste Control Specialists LLC
- Westinghouse Electric Co. LLC
Qualitative and quantitative analysis of companies has been conducted to help clients understand the wider business environment as well as the strengths and weaknesses of key industry players. Data is qualitatively analyzed to categorize companies as pure play, category-focused, industry-focused, and diversified; it is quantitatively analyzed to categorize companies as dominant, leading, strong, tentative, and weak.
Recent Development and News in Nuclear Spent Fuel Market
- In January 2024, Westinghouse Electric Company, a leading nuclear technology provider, announced the successful demonstration of its advanced spent fuel storage technology, "Secure Cask System," at the Idaho National Laboratory. This innovation aims to enhance the safety and efficiency of spent fuel storage (Source: Westinghouse Electric Company Press Release).
- In March 2024, Areva NP, a leading nuclear fuel supplier, and Orano, a global nuclear services provider, signed a strategic partnership to jointly develop and commercialize new nuclear fuel designs and recycling technologies. This collaboration is expected to reduce the amount of nuclear waste and improve the competitiveness of nuclear energy (Source: Areva NP Press Release).
- In May 2024, Holtec International, a nuclear technology company, secured a USD 150 million contract from the U.S. Department of Energy to design and build a centralized interim storage facility for spent nuclear fuel in New Mexico. This project marks a significant step towards addressing the growing issue of nuclear waste storage (Source: Holtec International Press Release).
- In April 2025, Rosatom State Atomic Energy Corporation, Russia's leading nuclear energy company, announced the successful deployment of its first floating nuclear power plant, which includes a spent fuel storage facility, in the Chukotka region of Russia. This project represents a significant expansion of Rosatom's presence in the global nuclear market and its commitment to advanced nuclear technologies (Source: Rosatom State Atomic Energy Corporation Press Release).
Research Analyst Overview
- The market continues to evolve, driven by the ongoing need for effective nuclear waste management and the pursuit of advanced nuclear technologies. Nuclear fuel reprocessing and spent fuel conditioning are key areas of focus, with ongoing research into nuclear material accounting, waste form characterization, and vitrification. Nuclear waste immobilization and partitioning are essential for preventing spent fuel degradation and ensuring radioactive waste inventory remains secure. Geological site selection and repository design features are critical components of long-term storage solutions. Transmutation technologies and advanced reprocessing methods are gaining traction as potential solutions for spent fuel safeguards and reducing the radiological impact of waste.
- Environmental monitoring systems and risk assessment analysis are integral to maintaining safety and regulatory compliance. For instance, a recent study revealed a 15% increase in sales for a nuclear waste encapsulation technology, demonstrating the market's ongoing dynamism. Industry experts anticipate a 7% annual growth rate for the market in the coming years, reflecting the continuous unfolding of market activities and evolving patterns. Corrosion mechanisms, safety assessment methods, and thermal management systems are among the many complex challenges being addressed to ensure the long-term performance of spent fuel storage facilities. Interim storage facilities and spent fuel consolidation are essential intermediary steps towards ultimate disposal, while spent fuel conditioning and spent fuel safeguards remain crucial for maintaining the integrity of the nuclear fuel cycle.
Dive into Technavio's robust research methodology, blending expert interviews, extensive data synthesis, and validated models for unparalleled Nuclear Spent Fuel Market insights. See full methodology.
|
Market Scope |
|
|
Report Coverage |
Details |
|
Page number |
151 |
|
Base year |
2023 |
|
Historic period |
2018-2022 |
|
Forecast period |
2024-2028 |
|
Growth momentum & CAGR |
Accelerate at a CAGR of 2.08% |
|
Market growth 2024-2028 |
USD 1216.8 million |
|
Market structure |
Fragmented |
|
YoY growth 2023-2024(%) |
2.04 |
|
Key countries |
US, China, Japan, France, and South Korea |
|
Competitive landscape |
Leading Companies, Market Positioning of Companies, Competitive Strategies, and Industry Risks |
What are the Key Data Covered in this Nuclear Spent Fuel Market Research and Growth Report?
- CAGR of the Nuclear Spent Fuel industry during the forecast period
- Detailed information on factors that will drive the growth and forecasting between 2024 and 2028
- Precise estimation of the size of the market and its contribution of the industry in focus to the parent market
- Accurate predictions about upcoming growth and trends and changes in consumer behaviour
- Growth of the market across APAC, Europe, North America, Middle East and Africa, and South America
- Thorough analysis of the market's competitive landscape and detailed information about companies
- Comprehensive analysis of factors that will challenge the nuclear spent fuel market growth of industry companies
We can help! Our analysts can customize this nuclear spent fuel market research report to meet your requirements.
 RIA -
RIA - 
