Occupational Therapy Software Market Analysis North America, Europe, APAC, South America, Middle East and Africa - US, Germany, UK, China, Canada - Size and Forecast 2024-2028

Occupational Therapy Software Market Analysis North America, Europe, APAC, South America, Middle East and Africa - US, Germany, UK, China, Canada - Size and Forecast 2024-2028

Published: Jul 2024 153 Pages SKU: IRTNTR75416

Market Overview at a Glance

$103.327 K
Market Opportunity
11.53%
CAGR
10.45
YoY growth 2023-2024(%)

Occupational Therapy Software Market Size 2024-2028

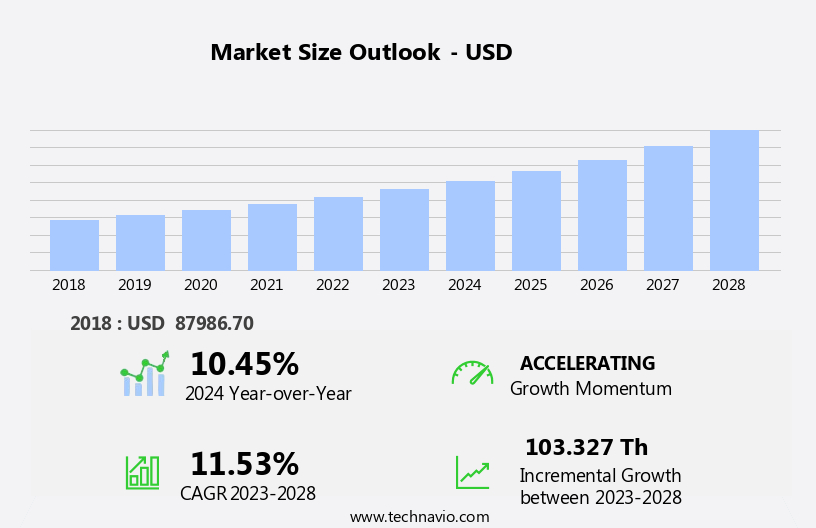
The occupational therapy software market size is forecast to increase by USD 103.327 th at a CAGR of 11.53% between 2023 and 2028.

  • The market is experiencing significant growth, driven by the rising prevalence of mental health disorders and the increasing popularity of online health services. Mental health disorders, such as anxiety and depression, have become a major health concern worldwide, leading to an increased demand for effective and efficient therapeutic interventions. Occupational therapy software solutions offer a viable option, enabling practitioners to deliver personalized treatment plans and track patient progress remotely. Moreover, the shift towards online health services, fueled by the COVID-19 pandemic, has accelerated market growth. Telehealth platforms, including occupational therapy software, have become essential tools for healthcare providers to maintain continuity of care while adhering to social distancing guidelines.
  • However, concerns related to low privacy and data security remain a significant challenge for market players. Ensuring data protection measures and complying with regulatory frameworks will be crucial for companies seeking to capitalize on market opportunities and navigate challenges effectively. Overall, the market presents a promising landscape for growth, with continued innovation and strategic partnerships expected to shape the competitive landscape.

What will be the Size of the Occupational Therapy Software Market during the forecast period?

Occupational Therapy Software Market Size

 Request Free Sample

  • The occupational therapy market encompasses various segments, including sensory issues, amputations, developmental disorders, and mental and physical problems. Health care equipment plays a crucial role in addressing these challenges, with standardized documentation facilitating efficient patient care and billing. Alzheimer's disease and dementia, which often require specialized attention, are driving the adoption of cloud-based and telehealth solutions. Tablets and interfaces have become essential tools for therapists, enabling remote sessions and improving patient outcomes. Health care technology continues to evolve, with web-based platforms streamlining daily living activities for patients dealing with cognitive and physical issues.
  • Hospital settings are increasingly leveraging health care technology to manage workload and enhance patient care. Overall, the market for occupational therapy solutions is experiencing significant growth, with an increasing focus on improving patient outcomes and addressing the unique needs of diverse patient populations.

How is this Occupational Therapy Software Industry segmented?

The occupational therapy software industry research report provides comprehensive data (region-wise segment analysis), with forecasts and estimates in "USD thousand" for the period 2024-2028, as well as historical data from 2018-2022 for the following segments.

  • End-user
    • Hospitals
    • Clinics
    • Research institutes
  • Type
    • Cloud-based
    • Services
  • Geography
    • North America
      • US
      • Canada
    • Europe
      • Germany
      • UK
    • APAC
      • China
    • South America
      • Middle East and Africa

      By End-user Insights

      The hospitals segment is estimated to witness significant growth during the forecast period.

      Occupational therapy plays a vital role in helping patients regain independence and avoid hospitalization, particularly for those dealing with physical and mental illnesses. As healthcare evolves, so does occupational therapy, adapting to meet the growing demands of primary care. With the implementation of the Affordable Care Act, the need for occupational therapy services has grown exponentially. Integrating technology into occupational therapy has become essential, with smartphones and tablets increasingly used for telehealth services and cloud-based care plans. Neuromuscular rehabilitation, disability assessment, and orthopedic care are just a few areas where digital solutions have made a significant impact.

      The geriatric population and elderly population, in particular, benefit from these advancements, as they often require task management for chronic diseases and daily living activities. Cloud-based services enable real-time data access, making it easier for therapists to monitor patient progress and collaborate with other healthcare professionals. Electronic health records (EHRs) and standardized documentation have streamlined data management and improved documentation, ensuring accurate billing services. Telecommunication technologies have also opened up new opportunities for pediatric care, mental health issues, and disability evaluation. The integration of technology in occupational therapy has been a game-changer, particularly in the hospital segment and outpatient facilities.

      Patient outcomes have improved, and therapists can now provide care more efficiently, reducing workload. Telehealth services have been especially beneficial for patients with sensory issues, cognitive problems, and developmental dysfunctions. Incorporating automation and telecommunication technology into orthopedics treatment and health care equipment has led to significant advancements in patient care. The tablet segment and web-based services have made therapy more accessible to a larger population, including those with disabilities and Alzheimer's disease or dementia. In summary, occupational therapy's integration with technology has revolutionized the way healthcare is delivered, making it more accessible, efficient, and effective for patients.

      From smartphones to cloud-based services, occupational therapy is at the forefront of digital health solutions, improving patient outcomes and enhancing the overall healthcare experience.

      Occupational Therapy Software Market Size

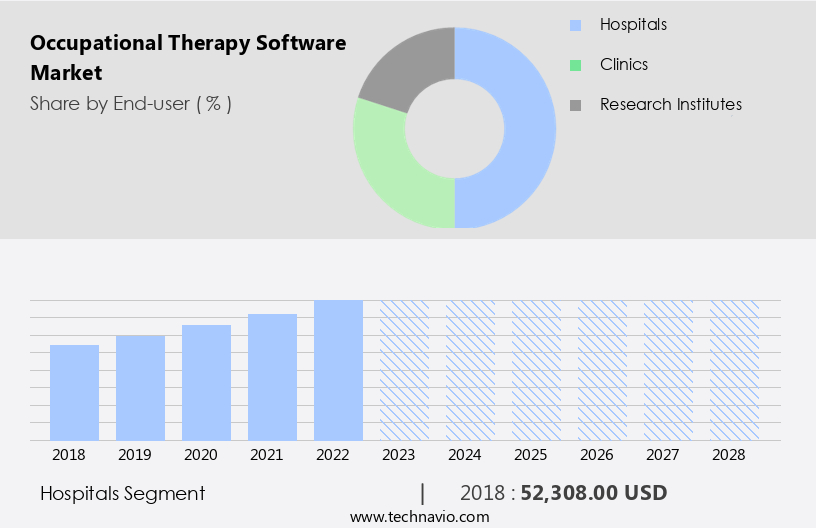
      Get a glance at the market report of share of various segments Request Free Sample

      The Hospitals segment was valued at USD 52308.00 th in 2018 and showed a gradual increase during the forecast period.

      Regional Analysis

      North America is estimated to contribute 35% to the growth of the global market during the forecast period.Technavio’s analysts have elaborately explained the regional trends and drivers that shape the market during the forecast period.

      Occupational Therapy Software Market Share by Geography

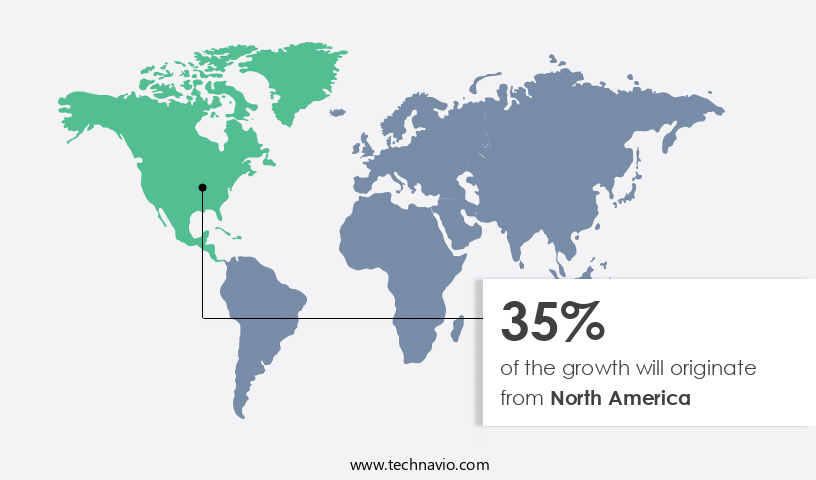
      For more insights on the market size of various regions, Request Free Sample

      The market in the US is witnessing significant growth due to several factors. Integration of digital solutions, such as Electronic Health Records (EHRs) and telehealth services, into healthcare facilities is driving the demand for occupational therapy software. The Hospital segment and Outpatient facilities are major contributors to this market, as they require efficient care planning, task management, and documentation for managing chronic diseases and pediatric care. The geriatric population and elderly population, with sensory issues and cognitive problems, are increasingly turning to cloud-based services for accessibility and standardized documentation. Smartphone users and tablet segment are also adopting occupational therapy software for real-time data access and automation of daily living activities.

      Cloud-based services are gaining popularity due to their convenience and affordability, particularly in the Cloud based segment. Neuromuscular rehabilitation, disability assessment, and billing services are some of the key applications of occupational therapy software. The rise in mental issues, such as Alzheimer's disease and dementia, is also fueling the demand for occupational therapy software for sensory problems and care plans. The integration of telecommunication technologies, including smartphones and tablets, is revolutionizing occupational therapy, enabling therapists to reach patients in remote areas and reducing workload. The market is further expected to grow due to the increasing awareness of the importance of occupational therapy software in managing physical and developmental dysfunctions, orthopedic care, and disability evaluation.

      In , the market in the US is experiencing significant growth due to the integration of digital solutions, increasing awareness, and the adoption of cloud-based services. The market is expected to continue its upward trajectory as it addresses the needs of various healthcare segments, including hospitals, clinics, and individual patients.

      Market Dynamics

      Our researchers analyzed the data with 2023 as the base year, along with the key drivers, trends, and challenges. A holistic analysis of drivers will help companies refine their marketing strategies to gain a competitive advantage.

      What are the key market drivers leading to the rise in the adoption of Occupational Therapy Software Industry?

      • Rising prevalence of mental health disorders is the key driver of the market. 

      • The increasing adoption of online services, including occupational therapy, is driven by the widespread availability of broadband and the benefits of remote therapy sessions. Occupational therapy software enables patients to consult with healthcare professionals without the need for in-person visits, resulting in cost savings and time efficiency. The proliferation of smartphones and tablets, as well as growing consumer demand for personalized occupational therapy solutions, have heightened the significance of this software.
      • Global companies, such as WebPT Inc., are capitalizing on these trends to offer innovative and customized occupational therapy software solutions.

      What are the market trends shaping the Occupational Therapy Software Industry?

      • Growing popularity of online health services is the upcoming market trend. 

      • Occupational therapy services can now be delivered digitally through telephone or the Internet, expanding access to care for individuals with health challenges, particularly those residing in remote areas or underserved communities. Patients with mobility issues, emergencies, or those unable to leave their homes due to illness can benefit significantly from these services. The market is an evolving and competitive landscape, with established and emerging players. Digital applications and video calls enable physicians to conduct therapy sessions similar to in-person sessions, offering convenience and flexibility to both patients and healthcare providers.
      • These solutions bridge the gap between scheduled visits, ensuring continuous support and care. The market's growth is driven by the increasing demand for remote healthcare services and the need to cater to diverse patient populations.

      What challenges does the Occupational Therapy Software Industry face during its growth?

      • Concerns related to low privacy is a key challenge affecting the industry growth. 

      • Occupational therapy software has gained significant traction in the healthcare sector due to the digital transformation in recent years. However, market expansion is not without challenges. One major concern is consumer privacy. Active services, which require direct patient input, such as mood diaries and symptom assessments, necessitate patient and provider knowledge to ensure data security. Passive services, which collect data using smartphone features like GPS, can access information without the patient's awareness, raising privacy concerns. These issues may hinder the growth of the market during the projection period. The healthcare sector's increasing reliance on digital technology since the 2000s has led to a in the number of digital devices and software in use.
      • To operate digitally, occupational therapy centers, clinics, and hospitals must register using secure credentials, including personal information and payment details. Despite these challenges, the benefits of occupational therapy software, such as improved patient outcomes and enhanced efficiency, continue to drive market growth.

      Exclusive Customer Landscape

      The occupational therapy software market forecasting report includes the adoption lifecycle of the market, covering from the innovator’s stage to the laggard’s stage. It focuses on adoption rates in different regions based on penetration. Furthermore, the occupational therapy software market report also includes key purchase criteria and drivers of price sensitivity to help companies evaluate and develop their market growth analysis strategies.
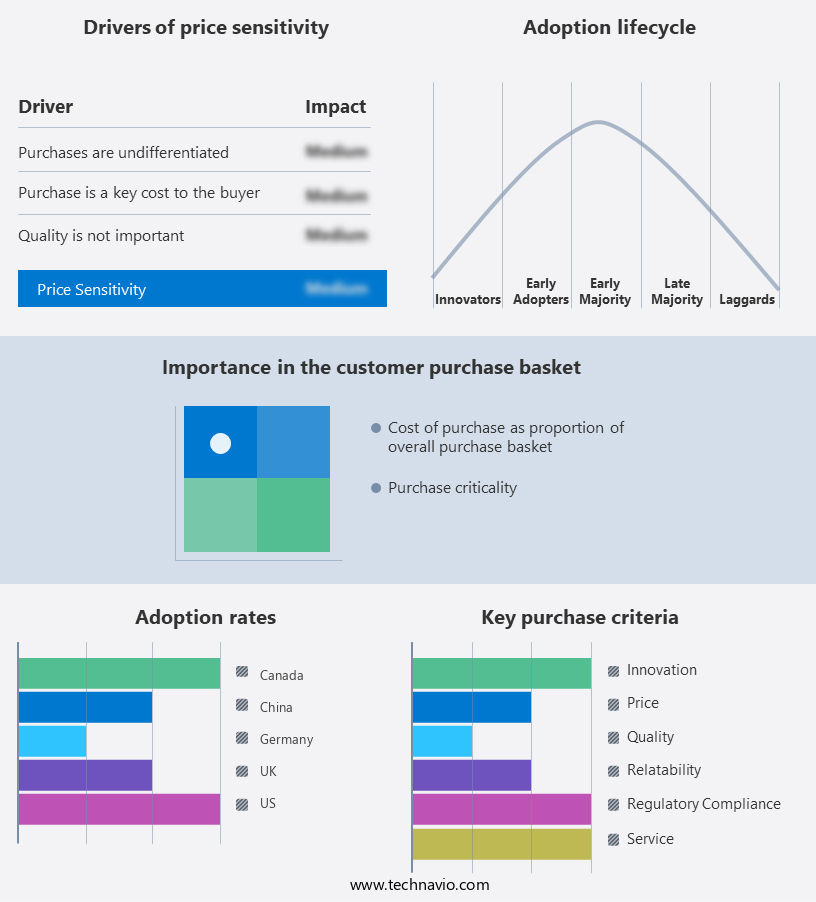
      Occupational Therapy Software Market Share by Geography

       Customer Landscape

      Key Companies & Market Insights

      Companies are implementing various strategies, such as strategic alliances, occupational therapy software market forecast, partnerships, mergers and acquisitions, geographical expansion, and product/service launches, to enhance their presence in the industry.

      Axis Teletherapy  - The company specializes in providing occupational therapy software solutions, including Skedulex, to enhance efficiency and effectiveness in therapeutic interventions. These advanced tools streamline scheduling, documentation, and data management processes, enabling practitioners to deliver superior care and improve patient outcomes. By leveraging innovative technology, our software empowers occupational therapy professionals to focus on what they do best: helping clients overcome challenges and reach their full potential.

      The industry research and growth report includes detailed analyses of the competitive landscape of the market and information about key companies, including:

      • Axis Teletherapy 
      • Baylaan Technologies Inc
      • Care Patron Ltd.
      • ClinicSource
      • coreplus.com.au Pty Ltd.
      • Fusion Web Clinic Inc.
      • Global Payments Inc.
      • Halaxy Pty Ltd.
      • Nookal Pty Ltd.
      • Practice Pro
      • Practo Technologies Pvt. Ltd.
      • Rehametrics
      • Rocket Thought Marketing Inc.
      • SimplePractice LLC
      • SmartPT Online
      • Tebra Technologies Inc.
      • TheraPlatform 
      • TIS Intl USA Inc.
      • WebPT Inc.
      • zHealth Inc.

      Qualitative and quantitative analysis of companies has been conducted to help clients understand the wider business environment as well as the strengths and weaknesses of key industry players. Data is qualitatively analyzed to categorize companies as pure play, category-focused, industry-focused, and diversified; it is quantitatively analyzed to categorize companies as dominant, leading, strong, tentative, and weak.

      Research Analyst Overview

      Occupational therapy, a vital component of healthcare services, continues to evolve with the integration of technology. The use of smart phones and tablets, in particular, has gained significant traction in recent years, transforming the way therapists deliver care and manage patient information. In the hospital segment, occupational therapy software has become an essential tool for disability assessment and neuromuscular rehabilitation. Therapists can now access electronic information in real time, enabling them to make informed decisions and provide effective care plans. Task management and care coordination have also become more efficient, allowing therapists to focus on patient outcomes rather than administrative tasks.

      The elderly population, a significant user group of occupational therapy services, benefits from cloud-based services. These solutions offer accessibility and convenience, enabling therapists to manage care plans and documentation from anywhere. The cloud-based segment is expected to grow rapidly due to its flexibility and cost-effectiveness. Chronic diseases, such as Alzheimer's disease and dementia, require ongoing care and attention. Occupational therapy software enables therapists to manage patient care more effectively, including sensory issues and cognitive problems. Standardized documentation and data management are crucial for effective care and billing services. Orthopedic care, another area of occupational therapy, benefits from digital solutions.

      Telehealth services, including telecommunication technologies, enable therapists to provide care remotely, reducing the workload and increasing access to care for patients with physical problems. Telehealth services are particularly beneficial for patients with amputations and other disorders, enabling them to receive care from the comfort of their homes. The integration of technology in occupational therapy also extends to health care equipment. Electronic health records (EHRs) and billing services enable seamless data transfer and management, improving efficiency and accuracy. Telecommunication technology and healthcare facilities have also adopted digital solutions, including web-based disability evaluation and developmental dysfunctions assessment tools. The use of mobile devices, including smartphones and tablets, has become increasingly common among therapists and patients.

      Smartphone users and internet users can access telehealth services, enabling them to receive care and manage their care plans remotely. Real-time data and task management tools help therapists provide effective care and monitor patient progress. In , the market is dynamic and evolving, with a focus on improving patient outcomes and increasing access to care. Cloud-based services, telehealth, and digital solutions are transforming the way therapists deliver care and manage patient information. The integration of technology in occupational therapy is expected to continue, with a focus on improving efficiency, accessibility, and patient care.

      Market Scope

      Report Coverage

      Details

      Page number

      153

      Base year

      2023

      Historic period

      2018-2022

      Forecast period

      2024-2028

      Growth momentum & CAGR

      Accelerate at a CAGR of 11.53%

      Market growth 2024-2028

      USD 103.327 thousand

      Market structure

      Fragmented

      YoY growth 2023-2024(%)

      10.45

      Key countries

      US, Germany, UK, China, and Canada

      Competitive landscape

      Leading Companies, Market Positioning of Companies, Competitive Strategies, and Industry Risks

      Request Free Sample

      What are the Key Data Covered in this Occupational Therapy Software Market Research and Growth Report?

      • CAGR of the Occupational Therapy Software industry during the forecast period
      • Detailed information on factors that will drive the growth and forecasting between 2024 and 2028
      • Precise estimation of the size of the market and its contribution of the industry in focus to the parent market
      • Accurate predictions about upcoming growth and trends and changes in consumer behaviour
      • Growth of the market across North America, Europe, APAC, South America, and Middle East and Africa
      • Thorough analysis of the market’s competitive landscape and detailed information about companies
      • Comprehensive analysis of factors that will challenge the occupational therapy software market growth of industry companies

      We can help! Our analysts can customize this occupational therapy software market research report to meet your requirements.

      Get in touch


      1 Executive Summary

      • 1.1 Market overview
        • Executive Summary - Chart on Market Overview
        • Executive Summary - Data Table on Market Overview
        • Executive Summary - Chart on Global Market Characteristics
        • Executive Summary - Chart on Market by Geography
        • Executive Summary - Chart on Market Segmentation by End-user
        • Executive Summary - Chart on Market Segmentation by Type
        • Executive Summary - Chart on Incremental Growth
        • Executive Summary - Data Table on Incremental Growth
        • Executive Summary - Chart on Company Market Positioning

      2 Market Landscape

      • 2.1 Market ecosystem
        • Parent Market
        • Data Table on - Parent Market
      • 2.2 Market characteristics
        • Market characteristics analysis
      • 2.3 Value chain analysis
        • Value Chain Analysis

      3 Market Sizing

      • 3.1 Market definition
        • Offerings of companies included in the market definition
      • 3.2 Market segment analysis
        • Market segments
      • 3.3 Market size 2023
        • 3.4 Market outlook: Forecast for 2023-2028
          • Chart on Global - Market size and forecast 2023-2028 ($ thousand)
          • Data Table on Global - Market size and forecast 2023-2028 ($ thousand)
          • Chart on Global Market: Year-over-year growth 2023-2028 (%)
          • Data Table on Global Market: Year-over-year growth 2023-2028 (%)

        4 Historic Market Size

        • 4.1 Global Occupational Therapy Software Market 2018 - 2022
          • Historic Market Size - Data Table on Global Occupational Therapy Software Market 2018 - 2022 ($ thousand)
        • 4.2 End-user segment analysis 2018 - 2022
          • Historic Market Size - End-user Segment 2018 - 2022 ($ thousand)
        • 4.3 Type segment analysis 2018 - 2022
          • Historic Market Size - Type Segment 2018 - 2022 ($ thousand)
        • 4.4 Geography segment analysis 2018 - 2022
          • Historic Market Size - Geography Segment 2018 - 2022 ($ thousand)
        • 4.5 Country segment analysis 2018 - 2022
          • Historic Market Size - Country Segment 2018 - 2022 ($ thousand)

        5 Five Forces Analysis

        • 5.1 Five forces summary
          • Five forces analysis - Comparison between 2023 and 2028
        • 5.2 Bargaining power of buyers
          • Bargaining power of buyers - Impact of key factors 2023 and 2028
        • 5.3 Bargaining power of suppliers
          • Bargaining power of suppliers - Impact of key factors in 2023 and 2028
        • 5.4 Threat of new entrants
          • Threat of new entrants - Impact of key factors in 2023 and 2028
        • 5.5 Threat of substitutes
          • Threat of substitutes - Impact of key factors in 2023 and 2028
        • 5.6 Threat of rivalry
          • Threat of rivalry - Impact of key factors in 2023 and 2028
        • 5.7 Market condition
          • Chart on Market condition - Five forces 2023 and 2028

        6 Market Segmentation by End-user

        • 6.1 Market segments
          • Chart on End-user - Market share 2023-2028 (%)
          • Data Table on End-user - Market share 2023-2028 (%)
        • 6.2 Comparison by End-user
          • Chart on Comparison by End-user
          • Data Table on Comparison by End-user
        • 6.3 Hospitals - Market size and forecast 2023-2028
          • Chart on Hospitals - Market size and forecast 2023-2028 ($ thousand)
          • Data Table on Hospitals - Market size and forecast 2023-2028 ($ thousand)
          • Chart on Hospitals - Year-over-year growth 2023-2028 (%)
          • Data Table on Hospitals - Year-over-year growth 2023-2028 (%)
        • 6.4 Clinics - Market size and forecast 2023-2028
          • Chart on Clinics - Market size and forecast 2023-2028 ($ thousand)
          • Data Table on Clinics - Market size and forecast 2023-2028 ($ thousand)
          • Chart on Clinics - Year-over-year growth 2023-2028 (%)
          • Data Table on Clinics - Year-over-year growth 2023-2028 (%)
        • 6.5 Research institutes - Market size and forecast 2023-2028
          • Chart on Research institutes - Market size and forecast 2023-2028 ($ thousand)
          • Data Table on Research institutes - Market size and forecast 2023-2028 ($ thousand)
          • Chart on Research institutes - Year-over-year growth 2023-2028 (%)
          • Data Table on Research institutes - Year-over-year growth 2023-2028 (%)
        • 6.6 Market opportunity by End-user
          • Market opportunity by End-user ($ thousand)
          • Data Table on Market opportunity by End-user ($ thousand)

        7 Market Segmentation by Type

        • 7.1 Market segments
          • Chart on Type - Market share 2023-2028 (%)
          • Data Table on Type - Market share 2023-2028 (%)
        • 7.2 Comparison by Type
          • Chart on Comparison by Type
          • Data Table on Comparison by Type
        • 7.3 Cloud-based - Market size and forecast 2023-2028
          • Chart on Cloud-based - Market size and forecast 2023-2028 ($ thousand)
          • Data Table on Cloud-based - Market size and forecast 2023-2028 ($ thousand)
          • Chart on Cloud-based - Year-over-year growth 2023-2028 (%)
          • Data Table on Cloud-based - Year-over-year growth 2023-2028 (%)
        • 7.4 Services - Market size and forecast 2023-2028
          • Chart on Services - Market size and forecast 2023-2028 ($ thousand)
          • Data Table on Services - Market size and forecast 2023-2028 ($ thousand)
          • Chart on Services - Year-over-year growth 2023-2028 (%)
          • Data Table on Services - Year-over-year growth 2023-2028 (%)
        • 7.5 Market opportunity by Type
          • Market opportunity by Type ($ thousand)
          • Data Table on Market opportunity by Type ($ thousand)

        8 Customer Landscape

        • 8.1 Customer landscape overview
          • Analysis of price sensitivity, lifecycle, customer purchase basket, adoption rates, and purchase criteria

        9 Geographic Landscape

        • 9.1 Geographic segmentation
          • Chart on Market share by geography 2023-2028 (%)
          • Data Table on Market share by geography 2023-2028 (%)
        • 9.2 Geographic comparison
          • Chart on Geographic comparison
          • Data Table on Geographic comparison
        • 9.3 North America - Market size and forecast 2023-2028
          • Chart on North America - Market size and forecast 2023-2028 ($ thousand)
          • Data Table on North America - Market size and forecast 2023-2028 ($ thousand)
          • Chart on North America - Year-over-year growth 2023-2028 (%)
          • Data Table on North America - Year-over-year growth 2023-2028 (%)
        • 9.4 Europe - Market size and forecast 2023-2028
          • Chart on Europe - Market size and forecast 2023-2028 ($ thousand)
          • Data Table on Europe - Market size and forecast 2023-2028 ($ thousand)
          • Chart on Europe - Year-over-year growth 2023-2028 (%)
          • Data Table on Europe - Year-over-year growth 2023-2028 (%)
        • 9.5 APAC - Market size and forecast 2023-2028
          • Chart on APAC - Market size and forecast 2023-2028 ($ thousand)
          • Data Table on APAC - Market size and forecast 2023-2028 ($ thousand)
          • Chart on APAC - Year-over-year growth 2023-2028 (%)
          • Data Table on APAC - Year-over-year growth 2023-2028 (%)
        • 9.6 South America - Market size and forecast 2023-2028
          • Chart on South America - Market size and forecast 2023-2028 ($ thousand)
          • Data Table on South America - Market size and forecast 2023-2028 ($ thousand)
          • Chart on South America - Year-over-year growth 2023-2028 (%)
          • Data Table on South America - Year-over-year growth 2023-2028 (%)
        • 9.7 Middle East and Africa - Market size and forecast 2023-2028
          • Chart on Middle East and Africa - Market size and forecast 2023-2028 ($ thousand)
          • Data Table on Middle East and Africa - Market size and forecast 2023-2028 ($ thousand)
          • Chart on Middle East and Africa - Year-over-year growth 2023-2028 (%)
          • Data Table on Middle East and Africa - Year-over-year growth 2023-2028 (%)
        • 9.8 US - Market size and forecast 2023-2028
          • Chart on US - Market size and forecast 2023-2028 ($ thousand)
          • Data Table on US - Market size and forecast 2023-2028 ($ thousand)
          • Chart on US - Year-over-year growth 2023-2028 (%)
          • Data Table on US - Year-over-year growth 2023-2028 (%)
        • 9.9 Germany - Market size and forecast 2023-2028
          • Chart on Germany - Market size and forecast 2023-2028 ($ thousand)
          • Data Table on Germany - Market size and forecast 2023-2028 ($ thousand)
          • Chart on Germany - Year-over-year growth 2023-2028 (%)
          • Data Table on Germany - Year-over-year growth 2023-2028 (%)
        • 9.10 UK - Market size and forecast 2023-2028
          • Chart on UK - Market size and forecast 2023-2028 ($ thousand)
          • Data Table on UK - Market size and forecast 2023-2028 ($ thousand)
          • Chart on UK - Year-over-year growth 2023-2028 (%)
          • Data Table on UK - Year-over-year growth 2023-2028 (%)
        • 9.11 China - Market size and forecast 2023-2028
          • Chart on China - Market size and forecast 2023-2028 ($ thousand)
          • Data Table on China - Market size and forecast 2023-2028 ($ thousand)
          • Chart on China - Year-over-year growth 2023-2028 (%)
          • Data Table on China - Year-over-year growth 2023-2028 (%)
        • 9.12 Canada - Market size and forecast 2023-2028
          • Chart on Canada - Market size and forecast 2023-2028 ($ thousand)
          • Data Table on Canada - Market size and forecast 2023-2028 ($ thousand)
          • Chart on Canada - Year-over-year growth 2023-2028 (%)
          • Data Table on Canada - Year-over-year growth 2023-2028 (%)
        • 9.13 Market opportunity by geography
          • Market opportunity by geography ($ thousand)
          • Data Tables on Market opportunity by geography ($ thousand)

        10 Drivers, Challenges, and Opportunity/Restraints

        • 10.1 Market drivers
          • 10.2 Market challenges
            • 10.3 Impact of drivers and challenges
              • Impact of drivers and challenges in 2023 and 2028
            • 10.4 Market opportunities/restraints

              11 Competitive Landscape

              • 11.1 Overview
                • 11.2 Competitive Landscape
                  • Overview on criticality of inputs and factors of differentiation
                • 11.3 Landscape disruption
                  • Overview on factors of disruption
                • 11.4 Industry risks
                  • Impact of key risks on business

                12 Competitive Analysis

                • 12.1 Companies profiled
                  • Companies covered
                • 12.2 Market positioning of companies
                  • Matrix on companies position and classification
                • 12.3 Baylaan Technologies Inc
                  • Baylaan Technologies Inc - Overview
                  • Baylaan Technologies Inc - Product / Service
                  • Baylaan Technologies Inc - Key offerings
                • 12.4 Care Patron Ltd.
                  • Care Patron Ltd. - Overview
                  • Care Patron Ltd. - Product / Service
                  • Care Patron Ltd. - Key offerings
                • 12.5 ClinicSource
                  • ClinicSource - Overview
                  • ClinicSource - Product / Service
                  • ClinicSource - Key offerings
                • 12.6 coreplus.com.au Pty Ltd.
                  • coreplus.com.au Pty Ltd. - Overview
                  • coreplus.com.au Pty Ltd. - Product / Service
                  • coreplus.com.au Pty Ltd. - Key offerings
                • 12.7 Fusion Web Clinic Inc.
                  • Fusion Web Clinic Inc. - Overview
                  • Fusion Web Clinic Inc. - Product / Service
                  • Fusion Web Clinic Inc. - Key offerings
                • 12.8 Global Payments Inc.
                  • Global Payments Inc. - Overview
                  • Global Payments Inc. - Business segments
                  • Global Payments Inc. - Key news
                  • Global Payments Inc. - Key offerings
                  • Global Payments Inc. - Segment focus
                • 12.9 Halaxy Pty Ltd.
                  • Halaxy Pty Ltd. - Overview
                  • Halaxy Pty Ltd. - Product / Service
                  • Halaxy Pty Ltd. - Key offerings
                • 12.10 Practice Pro
                  • Practice Pro - Overview
                  • Practice Pro - Product / Service
                  • Practice Pro - Key offerings
                • 12.11 Rehametrics
                  • Rehametrics - Overview
                  • Rehametrics - Product / Service
                  • Rehametrics - Key offerings
                • 12.12 Rocket Thought Marketing Inc.
                  • Rocket Thought Marketing Inc. - Overview
                  • Rocket Thought Marketing Inc. - Product / Service
                  • Rocket Thought Marketing Inc. - Key offerings
                • 12.13 SimplePractice LLC
                  • SimplePractice LLC - Overview
                  • SimplePractice LLC - Product / Service
                  • SimplePractice LLC - Key offerings
                • 12.14 SmartPT Online
                  • SmartPT Online - Overview
                  • SmartPT Online - Product / Service
                  • SmartPT Online - Key offerings
                • 12.15 Tebra Technologies Inc.
                  • Tebra Technologies Inc. - Overview
                  • Tebra Technologies Inc. - Product / Service
                  • Tebra Technologies Inc. - Key offerings
                • 12.16 WebPT Inc.
                  • WebPT Inc. - Overview
                  • WebPT Inc. - Product / Service
                  • WebPT Inc. - Key offerings
                • 12.17 zHealth Inc.
                  • zHealth Inc. - Overview
                  • zHealth Inc. - Product / Service
                  • zHealth Inc. - Key offerings

                13 Appendix

                • 13.1 Scope of the report
                  • 13.2 Inclusions and exclusions checklist
                    • Inclusions checklist
                    • Exclusions checklist
                  • 13.3 Currency conversion rates for US$
                    • Currency conversion rates for US$
                  • 13.4 Research methodology
                    • Research methodology
                  • 13.5 Data procurement
                    • Information sources
                  • 13.6 Data validation
                    • Data validation
                  • 13.7 Validation techniques employed for market sizing
                    • Validation techniques employed for market sizing
                  • 13.8 Data synthesis
                    • Data synthesis
                  • 13.9 360 degree market analysis
                    • 360 degree market analysis
                  • 13.10 List of abbreviations
                    • List of abbreviations

                  Research Methodology

                  Technavio presents a detailed picture of the market by way of study, synthesis, and summation of data from multiple sources. The analysts have presented the various facets of the market with a particular focus on identifying the key industry influencers. The data thus presented is comprehensive, reliable, and the result of extensive research, both primary and secondary.

                  INFORMATION SOURCES

                  Primary sources

                  • Manufacturers and suppliers
                  • Channel partners
                  • Industry experts
                  • Strategic decision makers

                  Secondary sources

                  • Industry journals and periodicals
                  • Government data
                  • Financial reports of key industry players
                  • Historical data
                  • Press releases

                  DATA ANALYSIS

                  Data Synthesis

                  • Collation of data
                  • Estimation of key figures
                  • Analysis of derived insights

                  Data Validation

                  • Triangulation with data models
                  • Reference against proprietary databases
                  • Corroboration with industry experts

                  REPORT WRITING

                  Qualitative

                  • Market drivers
                  • Market challenges
                  • Market trends
                  • Five forces analysis

                  Quantitative

                  • Market size and forecast
                  • Market segmentation
                  • Geographical insights
                  • Competitive landscape

                  Interested in this report?

                  Get your sample now to see our research methodology and insights!

                  Download Now

                  Frequently Asked Questions

                  Occupational Therapy Software market growth will increase by $ 103.327 th during 2024-2028 .

                  The Occupational Therapy Software market is expected to grow at a CAGR of 11.53% during 2024-2028 .

                  Occupational Therapy Software market is segmented by End-user( Hospitals, Clinics, Research institutes) Type( Cloud-based, Services)

                  Axis Teletherapy , Baylaan Technologies Inc, Care Patron Ltd., ClinicSource, coreplus.com.au Pty Ltd., Fusion Web Clinic Inc., Global Payments Inc., Halaxy Pty Ltd., Nookal Pty Ltd., Practice Pro, Practo Technologies Pvt. Ltd., Rehametrics, Rocket Thought Marketing Inc., SimplePractice LLC, SmartPT Online, Tebra Technologies Inc., TheraPlatform , TIS Intl USA Inc., WebPT Inc., zHealth Inc. are a few of the key vendors in the Occupational Therapy Software market.

                  North America will register the highest growth rate of 35% among the other regions. Therefore, the Occupational Therapy Software market in North America is expected to garner significant business opportunities for the vendors during the forecast period.

                  US, Germany, UK, China, Canada

                  • Rising prevalence of mental health disordersThe expansion of numerous online services is the driving factor this market.
                  • including occupational therapy is the driving factor this market.
                  • is due to the increased adoption of broadband. Due to the benefits of the Internet is the driving factor this market.
                  • especially online therapy and treatment services is the driving factor this market.
                  • people increasingly choose to use them instead of going out for therapy sessions. Occupational therapy software allows patients or clients to consult with doctors without physically visiting the office or other locations. This makes it cost-effective and saves time and money. The high penetration of smartphones and tablets and the rising consumer demand for customized occupational therapy software have increased the emphasis on occupational therapy software. Several global occupational therapy software vendors like WebPT Inc. is the driving factor this market.
                  • Practice Pro is the driving factor this market.
                  • ClinicSource is the driving factor this market.
                  • Fusion Web Clinic Inc. is the driving factor this market.
                  • SimplePractice LLC is the driving factor this market.
                  • and Care Patron Ltd. offer audio-visual and textual content compatible with smartphone devices. Therefore is the driving factor this market.
                  • wide Internet penetration is expected to be a major factor driving the growth of the global occupational therapy software market during the forecast period. is the driving factor this market.

                  The Occupational Therapy Software market vendors should focus on grabbing business opportunities from the Hospitals segment as it accounted for the largest market share in the base year.