Off-Grid Energy Storage System Market Size 2025-2029
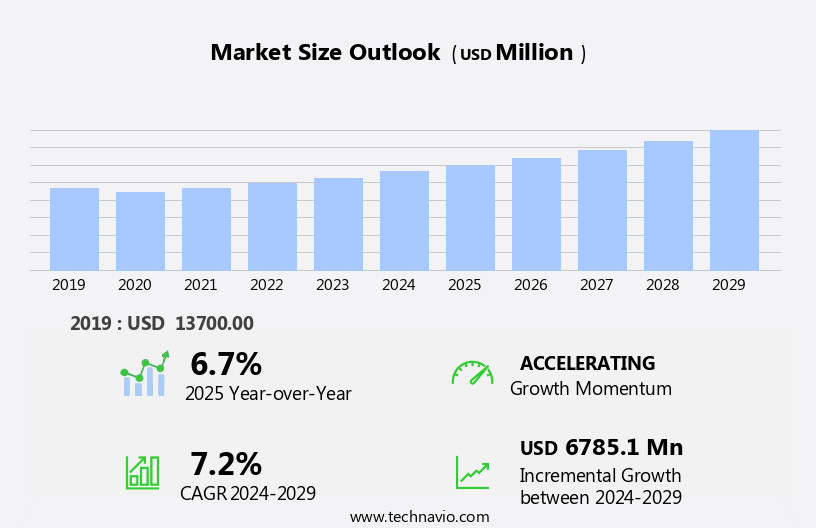
The off-grid energy storage system market size is forecast to increase by USD 6.79 billion, at a CAGR of 7.2% between 2024 and 2029.
- The market is experiencing significant growth, driven by the global shift towards renewable energy sources and the increasing adoption of microgrids. The changing energy mix, with a focus on sustainable and decentralized power generation, is fueling the demand for reliable and efficient energy storage systems. Furthermore, the widening demand-supply disparity in various regions, particularly in developing countries, presents a substantial opportunity for market expansion. However, the market faces challenges, including the limited availability and high cost of lithium, a key component in many energy storage systems. Companies seeking to capitalize on market opportunities must navigate these challenges effectively, investing in research and development to find alternatives to lithium or improve recycling processes.
- Additionally, strategic partnerships and collaborations can help mitigate the impact of supply chain disruptions and ensure a steady flow of raw materials. Overall, the market offers significant potential for growth, with companies that can innovate and adapt to market dynamics poised to succeed.
What will be the Size of the Off-Grid Energy Storage System Market during the forecast period?
Explore in-depth regional segment analysis with market size data - historical 2019-2023 and forecasts 2025-2029 - in the full report.
Request Free Sample
The market continues to evolve, driven by the growing demand for energy security and renewable energy solutions. Battery storage systems, including lithium-ion and flow batteries, play a pivotal role in this dynamic landscape. These systems offer varying energy storage durations, optimization capabilities, and energy densities, which are essential for diverse applications. Microgrid technology, AI-powered energy management, and energy management systems are integral components of this market, ensuring optimal system efficiency and power conversion efficiency. The integration of charge controllers and energy management software further enhances battery performance and enables emergency power capabilities. Energy storage capacity and solar panels are seamlessly integrated into off-grid systems, providing power backup and addressing energy equity concerns.
Ambient temperature and environmental conditions significantly impact system efficiency and cycle life, necessitating ongoing research and development. Hybrid systems, incorporating hydroelectric generators and wind turbines, expand the market's scope, while remote monitoring and IoT integration enable data analytics and grid-tied systems. The market's continuous evolution reflects the ongoing efforts to reduce costs, improve energy efficiency, and mitigate the environmental impact of carbon footprint concerns. Energy independence and community energy initiatives are gaining momentum, further fueling market growth. The market's dynamics remain intricately linked to the evolving regulatory landscape, technological advancements, and shifting consumer preferences.
How is this Off-Grid Energy Storage System Industry segmented?
The off-grid energy storage system industry research report provides comprehensive data (region-wise segment analysis), with forecasts and estimates in "USD million" for the period 2025-2029, as well as historical data from 2019-2023 for the following segments.
- Battery Type
- Li-ion
- LAB
- Sodium based batteries
- Others
- Application
- Industrial
- Residential
- Commercial
- Utility
- Military and defense
- Grid Type
- Hybrid
- Direct Current
- Alternate Current
- Power Source
- Solar PV
- Natural Gas
- Diesel Generators
- CHP
- Others
- Geography
- North America
- US
- Canada
- Europe
- France
- Germany
- Italy
- UK
- Middle East and Africa
- Egypt
- KSA
- Oman
- UAE
- APAC
- China
- India
- Japan
- South America
- Argentina
- Brazil
- Rest of World (ROW)
- North America
By Battery Type Insights
The Li-ion segment is estimated to witness significant growth during the forecast period.
The market is witnessing significant growth, driven by various factors. Financing options and government incentives are encouraging the adoption of battery storage systems for energy security and renewable energy integration. Lithium-ion batteries and flow batteries are popular choices due to their energy density, power density, and energy conversion efficiency. Microgrid technology and AI-powered energy management systems enhance energy efficiency and optimize energy storage. Wind turbines and solar panels are common power sources for off-grid systems, providing energy independence and reducing carbon footprint. Disaster relief applications and community energy projects are increasing the demand for energy storage capacity and emergency power.
Energy storage optimization and remote monitoring are essential for managing energy consumption and environmental conditions. Lead-acid batteries and Li-ion batteries are used in off-grid systems, with Li-ion batteries being the largest segment due to their high energy density and energy storing capacity. Hybrid systems, including hydroelectric generators and charge controllers, are also gaining popularity for their ability to store excess energy and provide power backup. Energy equity and climate change concerns are driving the market towards sustainable and cost-effective solutions. The market is expected to grow further with advancements in system efficiency, power conversion efficiency, battery performance, and IoT integration.
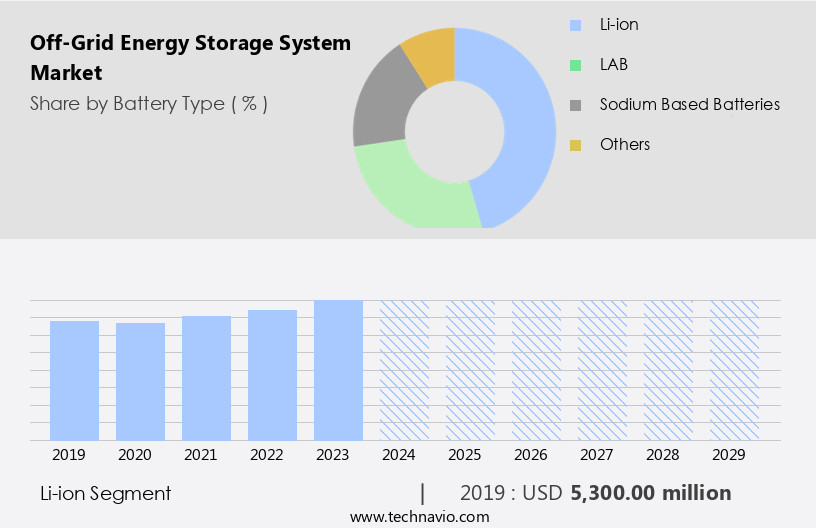
The Li-ion segment was valued at USD 5.3 billion in 2019 and showed a gradual increase during the forecast period.
Regional Analysis
North America is estimated to contribute 34% to the growth of the global market during the forecast period.Technavio's analysts have elaborately explained the regional trends and drivers that shape the market during the forecast period.
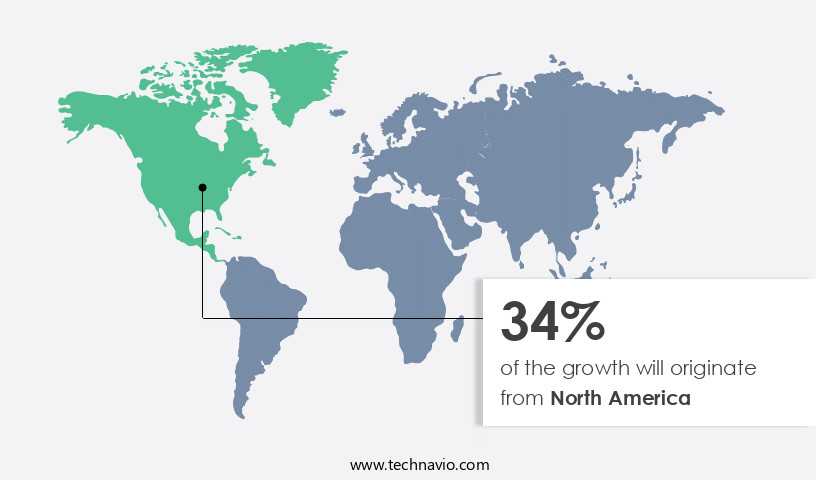
The market in North America is experiencing significant growth due to the increasing focus on renewable energy generation and the need for energy security. With countries like Canada, Mexico, and the US as major contributors, North America held the largest share of the market in 2024. Government initiatives to ensure a demand-supply balance and reduce electricity generation costs are driving market expansion. Investments in energy storage systems (ESSs) and the emphasis on smart buildings and smart cities are also key factors. Renewable energy sources, such as wind turbines and solar panels, require energy storage solutions for efficient energy conversion and optimal energy usage.
Lithium-ion batteries and flow batteries are popular choices due to their energy density and power density. Microgrid technology and AI-powered energy management systems enable energy optimization and disaster relief. Energy efficiency, energy storage duration, and power backup are essential considerations. Hybrid systems, including hydroelectric generators and charge controllers, offer flexibility and cost reduction. Energy management software and remote monitoring enable optimal battery performance and system efficiency. The market's evolution is influenced by factors such as ambient temperature, energy equity, and environmental conditions. The shift towards energy independence and the integration of IoT technology further expands market opportunities.
The carbon footprint and cycle life of batteries, as well as power output and operating temperature, are critical factors in the market's development.
Market Dynamics
Our researchers analyzed the data with 2024 as the base year, along with the key drivers, trends, and challenges. A holistic analysis of drivers will help companies refine their marketing strategies to gain a competitive advantage.
What are the key market drivers leading to the rise in the adoption of Off-Grid Energy Storage System Industry?
- The shift in energy mix is the primary influencing factor in market dynamics.
- The global energy landscape has undergone a notable transformation, with renewable energy sources gaining prominence. Traditional fossil fuels continue to dominate the energy mix, but their use contributes significantly to greenhouse gas (GHG) emissions. In response, governments worldwide have prioritized sustainable energy solutions, such as solar, wind, and biomass. Renewables now account for a substantial portion of the global energy mix, driven by regulatory mandates and incentives. Battery storage technologies, including lithium-ion and flow batteries, play a crucial role in the integration of renewable energy into the grid. Microgrid technology and AI-powered energy management systems further enhance energy security and efficiency.
- Wind turbines, a significant contributor to renewable energy, have also seen substantial growth. Financing options and government incentives have facilitated the adoption of renewable energy and energy storage systems. The benefits of renewable energy extend beyond environmental sustainability, with energy security and disaster relief being essential considerations. In conclusion, the global energy mix is evolving, with renewable energy and energy storage systems becoming increasingly important. This shift not only reduces GHG emissions but also enhances energy security and efficiency.
What are the market trends shaping the Off-Grid Energy Storage System Industry?
- Microgrids are gaining increasing popularity in the energy market. This trend is driven by the growing need for more resilient and decentralized power systems.
- Microgrids, comprised of small-scale electricity generation and energy storage resources, are gaining traction as an alternative power solution. These systems can operate autonomously or in collaboration with other small grids, offering flexibility in grid connectivity. In island mode, microgrids can function independently during power outages or intentional disconnections from the main grid. Renewable energy sources, such as wind and solar, are increasingly integrated into microgrids to minimize reliance on fossil fuels. Energy storage plays a crucial role in microgrids, providing backup power during grid instability and optimizing system efficiency. Energy storage duration and capacity are essential factors in ensuring uninterrupted power supply.
- Energy conversion efficiency and power density are also critical considerations for maximizing the system's overall efficiency. Charge controllers and energy management software are essential components of microgrids, managing battery performance and ensuring optimal energy usage. Solar panels, as a primary renewable energy source, convert sunlight into electricity and contribute to the microgrid's energy production. Emergency power applications and grid stabilization are primary use cases for microgrids, making energy storage optimization and system efficiency essential. In conclusion, the microgrid market is driven by the growing demand for reliable and sustainable power solutions, with renewable energy integration and energy storage playing a pivotal role in its success.
What challenges does the Off-Grid Energy Storage System Industry face during its growth?
- The lithium industry faces significant growth challenges due to the expanding disparity between surging demand and limited supply.
- Off-grid energy storage systems have gained significant traction in recent years due to the increasing demand for power backup and energy equity. Lithium-ion (Li-ion) batteries, which were previously predominantly used in consumer electronics, have emerged as the preferred energy storage solution for off-grid systems. The transportation sector's growing reliance on electric vehicles (EVs) has driven the demand for larger batteries and stationary storage, making Li-ion batteries an essential component in this sector. The advantages of Li-ion batteries, including energy and power density, safety, cost reduction, and extended battery life, have made them the go-to choice for various applications. Data analytics and smart grid technologies have further enhanced the efficiency and environmental impact of off-grid systems, contributing to a reduction in carbon footprint.
- Ambient temperature management and grid-tied systems are critical considerations in the design and implementation of off-grid energy storage systems. Climate change and the need for renewable energy sources have intensified the focus on these systems, making them an essential part of the energy landscape. Despite the benefits, the environmental impact of Li-ion batteries, particularly their production and disposal, remains a concern. Continuous research and development efforts are underway to improve battery efficiency, reduce production costs, and minimize environmental impact. In conclusion, off-grid energy storage systems, particularly those using Li-ion batteries, have become indispensable in various applications, from power backup to renewable energy integration.
- With advancements in technology, cost reduction, and a focus on sustainability, these systems are set to play a crucial role in the future energy landscape.
Exclusive Customer Landscape
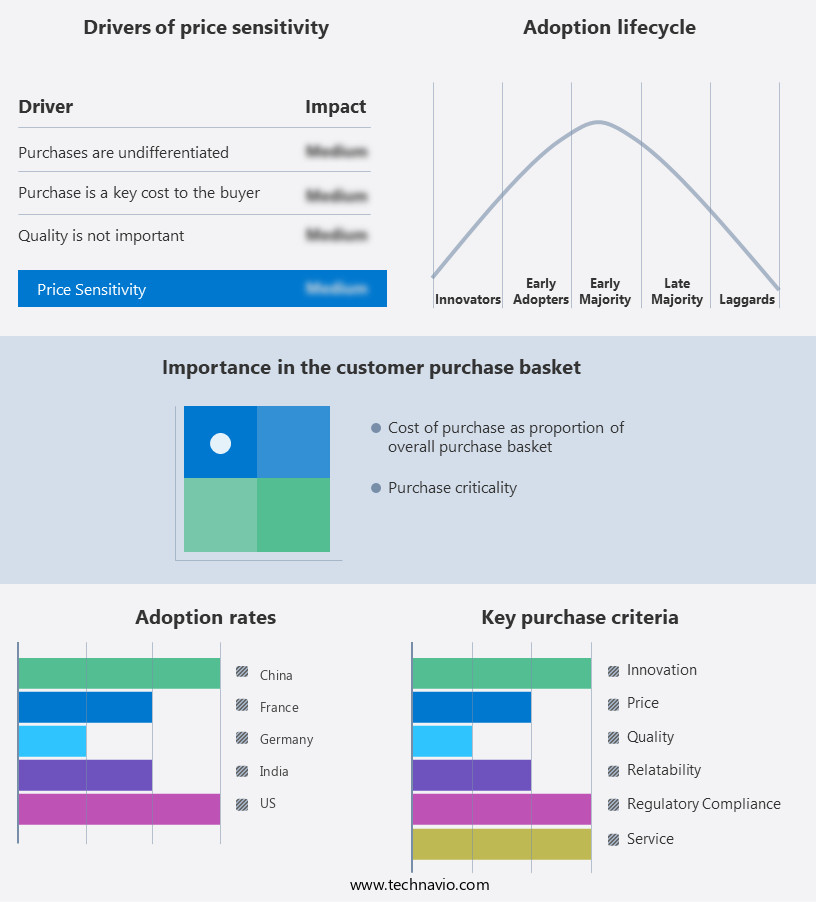
The off-grid energy storage system market forecasting report includes the adoption lifecycle of the market, covering from the innovator's stage to the laggard's stage. It focuses on adoption rates in different regions based on penetration. Furthermore, the off-grid energy storage system market report also includes key purchase criteria and drivers of price sensitivity to help companies evaluate and develop their market growth analysis strategies.
Customer Landscape
Key Companies & Market Insights
Companies are implementing various strategies, such as strategic alliances, off-grid energy storage system market forecast, partnerships, mergers and acquisitions, geographical expansion, and product/service launches, to enhance their presence in the industry.
The industry research and growth report includes detailed analyses of the competitive landscape of the market and information about key companies, including:
- ABB
- BYD Company Ltd.
- CALB
- EnerSys
- Enphase
- Fronius
- GE Vernova
- Hitachi Chemical Co., Ltd.
- Hitachi Energy Ltd.
- LG Energy Solution
- Mitsubishi Heavy Industries
- NEC Energy Solutions
- Panasonic Corporation
- SAFT
- Samsung SDI Co., Ltd.
- Siemens Energy
- Sonnen
- Sumitomo Electric Industries
- Sungrow Power Supply
- Tianneng Battery
- Toshiba Corporation
Qualitative and quantitative analysis of companies has been conducted to help clients understand the wider business environment as well as the strengths and weaknesses of key industry players. Data is qualitatively analyzed to categorize companies as pure play, category-focused, industry-focused, and diversified; it is quantitatively analyzed to categorize companies as dominant, leading, strong, tentative, and weak.
Recent Development and News in Off-Grid Energy Storage System Market
- In March 2024, Tesla, a leading energy storage solutions provider, announced the expansion of its Powerwall line with the introduction of the Powerwall 3, featuring a 71% increase in energy density and a 29% reduction in cost compared to its predecessor (Tesla Press Release, 2024). This development underscores Tesla's commitment to enhancing the affordability and efficiency of off-grid energy storage systems.
- In July 2024, LG Chem, a major battery manufacturer, and TotalEnergies, a global energy company, formed a strategic partnership to jointly develop and commercialize energy storage systems for renewable energy applications (TotalEnergies Press Release, 2024). This collaboration represents a significant step forward in the integration of renewable energy and energy storage solutions, further strengthening the market's growth potential.
- In October 2024, Siemens Energy secured a â¬1.2 billion (USD1.3 billion) order to supply energy storage systems for various renewable energy projects in Europe (Siemens Energy Press Release, 2024). This substantial investment in energy storage systems highlights the growing demand for reliable and efficient energy storage solutions to support the integration of renewable energy into the grid.
- In December 2024, the Indian government announced the National Energy Storage Mission, a comprehensive initiative to deploy 40 GW of energy storage capacity by 2030 (Ministry of New and Renewable Energy, 2024). This ambitious plan signifies a significant geographic expansion and market entry for off-grid energy storage systems, particularly in the rapidly growing renewable energy sector in India.
Research Analyst Overview
- The off-grid energy storage market is experiencing dynamic growth, driven by the increasing integration of renewable energy sources, such as solar and wind, into the power grid. Life cycle analysis plays a crucial role in optimizing the economics of energy storage systems, particularly in utility-scale applications. Energy trading and arbitrage opportunities are emerging as key drivers for grid-scale energy storage, enabling providers to capitalize on price differences between energy supply and demand. Safety features, including fire suppression systems, are essential considerations in energy storage development. DC-AC converters, DC-DC converters, and AC-DC converters are integral components of these systems, ensuring power quality and voltage support.
- Thermal management is another critical aspect, particularly for lithium-ion batteries, which require careful temperature control to maintain optimal performance. Demand response programs and peak shaving applications are also driving the adoption of energy storage, enabling utilities to better manage energy demand and maintain grid stability. Frequency regulation and load leveling are essential services provided by energy storage systems, ensuring power grid reliability and efficiency. Energy storage research continues to advance, with innovations in geothermal energy storage and improvements in energy storage economics. As the market evolves, the role of energy storage in grid management and renewable energy integration becomes increasingly significant.
Dive into Technavio's robust research methodology, blending expert interviews, extensive data synthesis, and validated models for unparalleled Off-Grid Energy Storage System Market insights. See full methodology.
|
Market Scope |
|
|
Report Coverage |
Details |
|
Page number |
219 |
|
Base year |
2024 |
|
Historic period |
2019-2023 |
|
Forecast period |
2025-2029 |
|
Growth momentum & CAGR |
Accelerate at a CAGR of 7.2% |
|
Market growth 2025-2029 |
USD 6785.1 million |
|
Market structure |
Fragmented |
|
YoY growth 2024-2025(%) |
6.7 |
|
Key countries |
US, Canada, China, UK, Japan, India, France, South Korea, Mexico, and Germany |
|
Competitive landscape |
Leading Companies, Market Positioning of Companies, Competitive Strategies, and Industry Risks |
What are the Key Data Covered in this Off-Grid Energy Storage System Market Research and Growth Report?
- CAGR of the Off-Grid Energy Storage System industry during the forecast period
- Detailed information on factors that will drive the growth and forecasting between 2025 and 2029
- Precise estimation of the size of the market and its contribution of the industry in focus to the parent market
- Accurate predictions about upcoming growth and trends and changes in consumer behaviour
- Growth of the market across North America, APAC, Europe, Middle East and Africa, and South America
- Thorough analysis of the market's competitive landscape and detailed information about companies
- Comprehensive analysis of factors that will challenge the off-grid energy storage system market growth of industry companies
We can help! Our analysts can customize this off-grid energy storage system market research report to meet your requirements.
 RIA -
RIA - 
