Wind Power Systems Market Size 2024-2028
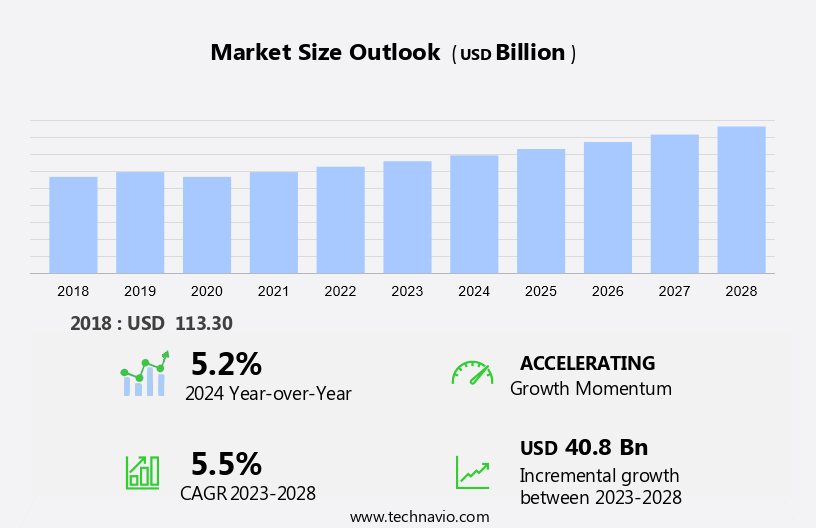
The wind power systems market size is forecast to increase by USD 40.8 billion at a CAGR of 5.5% between 2023 and 2028. The market is experiencing significant growth due to the increasing adoption of alternative energy sources to meet rising energy demand and reduce reliance on gas-based power. The global energy transition towards sustainable sources is driving market expansion. Among the various renewable energy sources, wind power is gaining immense popularity due to its ability to produce large-scale electricity with minimal environmental impact. Offshore wind turbines are gaining popularity due to their higher efficiency and production capacity. Solar power, while a strong competitor, cannot match the consistency and capacity of wind energy. Production costs are decreasing as technology advances, making wind power a more viable option for energy production. However, challenges such as intermittency and the need for large-scale infrastructure development persist. To stay competitive, market players must focus on innovation and cost reduction.
What will be the Size of the Market During the Forecast Period?
The renewable energy sector has gained significant traction in the global energy market due to the increasing awareness of environmental pollution and the need for sustainable energy sources. Among all the renewable energy sources, wind power systems have emerged as a leading alternative to traditional gas-based energy. The current market scenario of wind power systems is driven by the rising energy demand and the need to reduce carbon emissions. According to industry analysis, the installed base of wind power capacity is expected to grow at a steady pace, with wind farms becoming a significant contributor to electricity needs.
Moreover, wind turbine technology has advanced significantly over the years, making wind power systems more efficient and cost-effective. Offshore wind turbines have gained popularity due to their ability to generate more power compared to onshore wind farms. The offshore wind capacity is projected to increase significantly in the coming years, with operational wind farms being established in various offshore areas. Digitalization and data analytics have transformed wind farm operations, enabling real-time monitoring and predictive maintenance. Energy storage solutions have also gained importance in the market to ensure a consistent power supply and improve overall system efficiency. The market is witnessing several trends, including the adoption of renewable energy sources, increasing focus on clean energy, and the integration of wind power systems with other energy sources.
Furthermore, the market is expected to grow at a steady pace due to these trends and the rising demand for sustainable energy sources. The market is expected to witness significant growth due to the following factors: Rising energy demand: The increasing energy demand and the need to reduce carbon emissions have led to a rise in the adoption of renewable energy sources, including wind power systems. Efficiency and production costs: Wind power systems have become more efficient and cost-effective, making them a viable alternative to traditional energy sources. Offshore wind farms: The establishment of offshore wind farms has enabled the generation of more power and reduced the dependence on fossil fuels.
Market Segmentation
The market research report provides comprehensive data (region-wise segment analysis), with forecasts and estimates in "USD billion" for the period 2024-2028, as well as historical data from 2018-2022 for the following segments.
- Technology
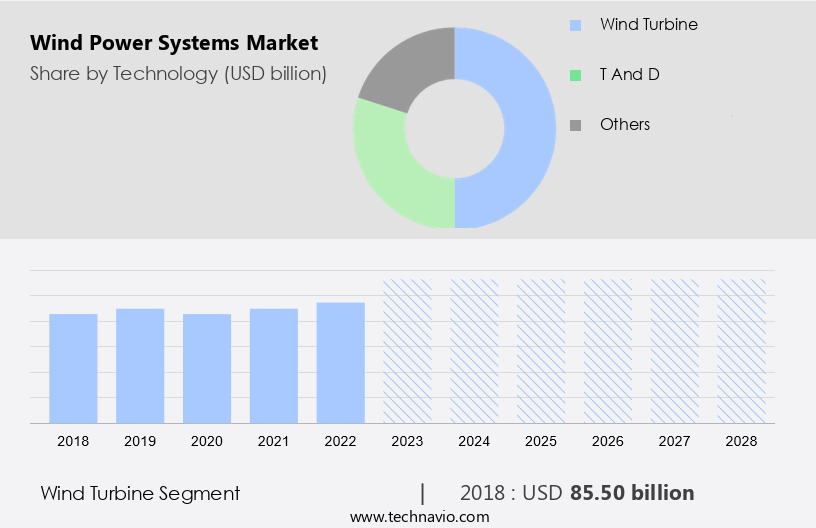
- Wind turbine
- T and D
- Others
- Geography
- APAC
- China
- Japan
- South Korea
- North America
- US
- Europe
- UK
- Italy
- Middle East and Africa
- South America
- APAC
By Technology Insights
The wind turbine segment is estimated to witness significant growth during the forecast period. The market encompasses various components such as generators, transformers, shaft, power converters, gearboxes, rotor blades, towers, nacelles, and rotor hubs. The shift towards sustainable energy sources has fueled significant investments and interest in the development of renewable energy initiatives, particularly wind power. Wind energy projects come in various sizes, from onshore wind farms to offshore wind farms, with the former being more common due to lower costs and easier installation.
Furthermore, wind turbines have evolved over the years, with larger rotor diameters, increased rated output, and taller towers being employed to maximize energy yields. This trend has led to a substantial increase in wind power generation capacity over the past decade.
Get a glance at the market share of various segments Request Free Sample
The wind turbine segment accounted for USD 85.50 billion in 2018 and showed a gradual increase during the forecast period.
Regional Insights
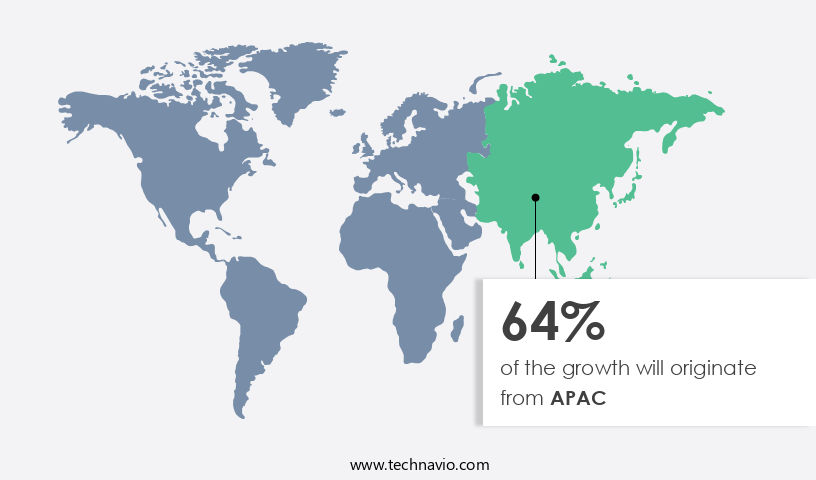
APAC is estimated to contribute 64% to the growth of the global market during the forecast period. Technavio's analysts have elaborately explained the regional trends and drivers that shape the market during the forecast period.
For more insights on the market share of various regions Request Free Sample
Increasing investments in renewable energy will facilitate market growth in APAC over the forecast period. The market in Asia Pacific (APAC) exhibits a moderate level of fragmentation, with a multitude of regional and some global players. Key countries in the region, including Japan, China, India, South Korea, Australia, New Zealand, the Philippines, Thailand, Indonesia, and Singapore, present significant growth opportunities for packaged sprouts companies.
Our researchers analyzed the data with 2023 as the base year, along with the key drivers, trends, and challenges. A holistic analysis of drivers will help companies refine their marketing strategies to gain a competitive advantage.
Market Driver
Increasing investments in renewable energy is the key driver of the market. In the current market scenario, the cost of producing electricity from renewable energy sources, such as wind power, has become increasingly competitive with conventional energy sources. This shift is driven by advancements in technology and the growing importance of clean and sustainable energy sources. Renewable energy, including wind power, is a key contributor to reducing environmental pollution and carbon emissions. The global investment in renewable energy continues to rise, making it a viable and cost-effective alternative to traditional energy sources. Wind power, along with solar energy, accounts for the largest share of renewable capacity addition.
Moreover, the integration of digitalization, data analytics, and energy storage solutions in wind power systems has further enhanced their competitiveness. These advancements have led to increased efficiency, reliability, and flexibility in wind power generation. As the world moves towards a low-carbon economy, the demand for wind power is expected to continue growing, making it an attractive investment opportunity for businesses and individuals alike. In conclusion, the wind power market is a dynamic and evolving industry that offers numerous benefits, including low carbon emissions, competitiveness with conventional energy sources, and the potential for significant growth. As the world transitions to a more sustainable energy future, wind power will continue to play a crucial role in meeting the world's energy needs while reducing carbon emissions and mitigating environmental pollution.
Market Trends
Global energy transition is the upcoming trend in the market. The global power market is experiencing a significant shift towards renewable energy sources, with wind energy emerging as a key player. The increasing emphasis on reducing carbon emissions and the declining costs of renewable technologies, particularly wind and solar power, are driving the adoption of wind energy on a large scale. This transition offers numerous advantages, including the ability to produce electricity reliably and efficiently, making wind energy an attractive alternative to gas-based power generation. Governments worldwide recognize the long-term benefits of wind energy and its potential to meet the needs of bulk power systems. Wind energy is a renewable, clean energy source that can be harnessed in various locations, including onshore and offshore sites.
Furthermore, the rising energy demand, coupled with the need to reduce reliance on fossil fuels, is further fueling the growth of the market. Investing in wind energy not only contributes to a greener environment but also offers cost savings in the long run. As the technology advances and production costs continue to decline, wind energy is becoming an increasingly viable and cost-effective solution for power generation. With the right policies and incentives in place, the market is poised for continued growth and success.
Market Challenge
Competition from fossil fuels is a key challenge affecting the market growth. Wind power has emerged as a significant contributor to the global energy landscape, accounting for around 3% of the total primary energy consumption as of 2023. However, the current market share of wind power is still modest compared to the overall global electricity production. In some countries with substantial coal reserves, there is resistance to replacing coal-based electricity with costlier renewable energy sources like wind power.
The market has witnessed considerable investment in wind farm operations and advancements in wind turbine technology. Industry analysis indicates that the installed base of wind power is projected to reach a thousand gigawatts by 2030. Companies leading the wind power market are focusing on reducing costs and increasing efficiency to make wind power a more competitive energy source. Wind power projects are becoming increasingly attractive to investors due to the long-term benefits they offer, including reduced carbon emissions and energy independence.
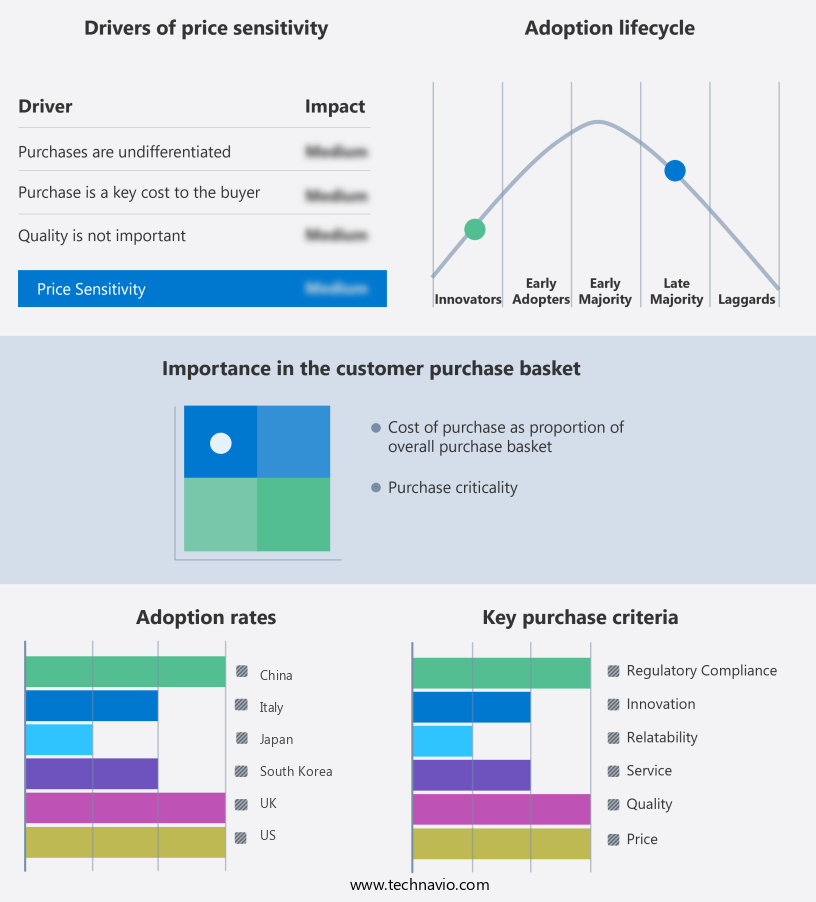
Exclusive Customer Landscape
The market forecasting report includes the adoption lifecycle of the market, covering from the innovator's stage to the laggard's stage. It focuses on adoption rates in different regions based on penetration. Furthermore, the report also includes key purchase criteria and drivers of price sensitivity to help companies evaluate and develop their market growth analysis strategies.
Customer Landscape
Key Companies & Market Insights
Companies are implementing various strategies, such as strategic alliances, partnerships, mergers and acquisitions, geographical expansion, and product/service launches, to enhance their presence in the market.
Able UK Ltd: The company offers wind power services such as offshore wind installation vessels and replacement of wind walls.
The market research and growth report includes detailed analyses of the competitive landscape of the market and information about key companies, including:
- Aerodyn Energiesysteme Gmbh
- Belden Inc.
- Bora Energy
- BRUGG GROUP AG
- Clipper Windpower LLC
- Doosan Enerbility Co. Ltd.
- Emergya Wind Technologies BV
- ENERCON GmbH
- Fujikura Ltd.
- General Electric Co.
- JDR Cable Systems Ltd.
- Lianyungang Zhongfu Lianzhong Composites Group Co. Ltd.
- LS Cable and System Ltd.
- Molded Fiber Glass Co.
- Nexans SA
- NKT AS
- Nordex SE
- Prysmian Spa
- ReGen Powertech Pvt. Ltd.
- Samsung Heavy Industries Co. Ltd.
- Senvion Wind Technology Pvt. Ltd.
- The Okonite Co.
Qualitative and quantitative analysis of companies has been conducted to help clients understand the wider business environment as well as the strengths and weaknesses of key market players. Data is qualitatively analyzed to categorize companies as pure play, category-focused, industry-focused, and diversified; it is quantitatively analyzed to categorize companies as dominant, leading, strong, tentative, and weak.
Research Analyst Overview
The renewable energy market is currently witnessing significant growth, with wind power being one of the leading clean energy sources. The environmental concerns over pollution from traditional gas-based energy sources have led to a rise in the adoption of sustainable energy sources. Wind power, in particular, has gained immense popularity due to its ability to produce electrical energy from kinetic energy generated by wind. The market is witnessing digitalization, with data analytics and advanced technology being integrated into wind farm operations. This includes the use of wind turbine technology, such as rotors, nacelles, and towers, to optimize energy yields and reduce production costs.
Furthermore, the rising energy demand and the need for alternative energy sources have led to increased investment in wind power projects. Offshore wind energy is gaining momentum, with offshore wind farms being established in various offshore areas. The use of offshore wind turbines has become increasingly popular due to higher wind speeds and reduced land obstruction. Renewable energy initiatives and subsidies, along with tax incentives, are driving the growth of the wind power market. The adoption of contracts for different schemes is also providing financial security to investors in wind energy projects. Despite the benefits, there are challenges, such as land use conflicts and operational issues that need to be addressed to ensure the efficient functioning of wind farms. The future of wind power lies in the continued innovation and optimization of wind turbine technology and the integration of energy storage solutions.
|
Market Scope |
|
|
Report Coverage |
Details |
|
Page number |
142 |
|
Base year |
2023 |
|
Historic period |
2018-2022 |
|
Forecast period |
2024-2028 |
|
Growth momentum & CAGR |
Accelerate at a CAGR of 5.5% |
|
Market growth 2024-2028 |
USD 40.8 billion |
|
Market structure |
Fragmented |
|
YoY growth 2023-2024(%) |
5.2 |
|
Regional analysis |
APAC, North America, Europe, Middle East and Africa, and South America |
|
Performing market contribution |
APAC at 64% |
|
Key countries |
China, US, South Korea, Japan, UK, and Italy |
|
Competitive landscape |
Leading Companies, Market Positioning of Companies, Competitive Strategies, and Industry Risks |
|
Key companies profiled |
Able UK Ltd., Aerodyn Energiesysteme Gmbh, Belden Inc., Bora Energy, BRUGG GROUP AG, Clipper Windpower LLC, Doosan Enerbility Co. Ltd., Emergya Wind Technologies BV, ENERCON GmbH, Fujikura Ltd., General Electric Co., JDR Cable Systems Ltd., Lianyungang Zhongfu Lianzhong Composites Group Co. Ltd., LS Cable and System Ltd., Molded Fiber Glass Co., Nexans SA, NKT AS, Nordex SE, Prysmian Spa, ReGen Powertech Pvt. Ltd., Samsung Heavy Industries Co. Ltd., Senvion Wind Technology Pvt. Ltd., and The Okonite Co. |
|
Market dynamics |
Parent market analysis, market growth inducers and obstacles, market forecast, fast-growing and slow-growing segment analysis, COVID-19 impact and recovery analysis and future consumer dynamics, market condition analysis for the forecast period |
|
Customization purview |
If our market report has not included the data that you are looking for, you can reach out to our analysts and get segments customized. |
What are the Key Data Covered in this Market Research and Growth Report?
- CAGR of the market during the forecast period
- Detailed information on factors that will drive the market growth and forecasting between 2024 and 2028
- Precise estimation of the size of the market and its contribution of the market in focus to the parent market
- Accurate predictions about upcoming market growth and trends and changes in consumer behaviour
- Growth of the market across APAC, North America, Europe, Middle East and Africa, and South America
- Thorough analysis of the market's competitive landscape and detailed information about companies
- Comprehensive analysis of factors that will challenge the growth of market companies
We can help! Our analysts can customize this market research report to meet your requirements. Get in touch
 RIA -
RIA - 
