Oil And Gas Engineering Services Market Analysis North America, APAC, Europe, Middle East and Africa, South America - US, Canada, China, India, Russia - Size and Forecast 2024-2028

Oil And Gas Engineering Services Market Analysis North America, APAC, Europe, Middle East and Africa, South America - US, Canada, China, India, Russia - Size and Forecast 2024-2028

Published: Jul 2024 135 Pages SKU: IRTNTR74091

Market Overview at a Glance

$5.32 B
Market Opportunity
8.51%
CAGR
7.67
YoY growth 2023-2024(%)

Oil And Gas Engineering Services Market Size 2024-2028

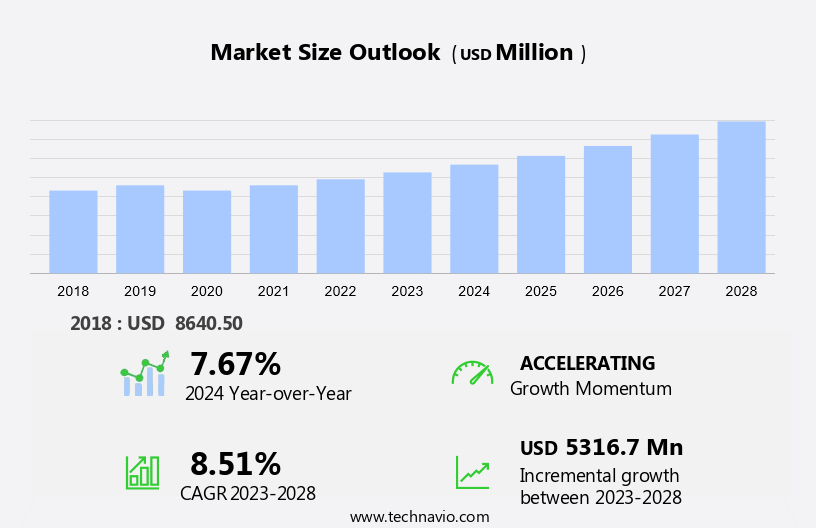
The oil and gas engineering services market size is forecast to increase by USD 5.32 billion at a CAGR of 8.51% between 2023 and 2028.

  • The market is experiencing significant growth due to several key factors. The increase in Exploration and Production (E&P) activities, particularly In the shale industry, is driving market growth. Additionally, rising investments In the shale industry are contributing to market expansion. However, the market is also facing challenges from alternative energy sources, which are gaining popularity due to their environmental benefits. The hydrocarbon resources sector is also witnessing the emergence of new pipelines, expanding the energy source network and facilitating the transportation of hydrocarbons to various industries, including aviation, manufacturing, construction, and daily necessities. This trend is expected to intensify In the coming years, posing a significant threat to the market. Despite these challenges, the market is expected to continue growing due to the high demand for engineering services In the oil and gas sector. Companies In the market are focusing on innovation and technology to remain competitive and meet the evolving needs of their clients. Overall, the market is poised for steady growth, driven by increasing E&P activities, rising investments, and the challenges posed by alternative energy sources.

What will be the Size of the Oil And Gas Engineering Services Market During the Forecast Period?

Oil And Gas Engineering Services Market Size

 Request Free Sample

  • The market is a dynamic and evolving industry, driven by the need to maximize productivity and efficiency In the extraction and processing of hydrocarbon resources. Automation technologies, such as machine learning and artificial intelligence, are increasingly being adopted to streamline operations and reduce costs. Renewable energy and carbon footprint regulations are also influencing the market, as companies seek to minimize their environmental impact and explore alternative energy sources. Electric vehicles and changing demand patterns are further disrupting traditional business models. Strategic collaborations between multinational engineering firms and specialized niche players are on the rise, as companies seek to leverage each other's expertise and resources.
  • Furthermore, mechanical, electrical, civil, and chemical engineering services remain crucial for the design, construction, and maintenance of infrastructure and equipment. Regulatory developments and technological advancements continue to shape the market, as companies navigate complex hydrocarbon sources and adapt to shifting industry dynamics.

How is this Oil And Gas Engineering Services Industry segmented and which is the largest segment?

The oil and gas engineering services industry research report provides comprehensive data (region-wise segment analysis), with forecasts and estimates in "USD billion" for the period 2024-2028, as well as historical data from 2018-2022 for the following segments.

  • Type
    • Downstream
    • Midstream
    • Upstream
  • Geography
    • North America
      • Canada
      • US
    • APAC
      • China
      • India
    • Europe
    • Middle East and Africa
    • South America

By Type Insights

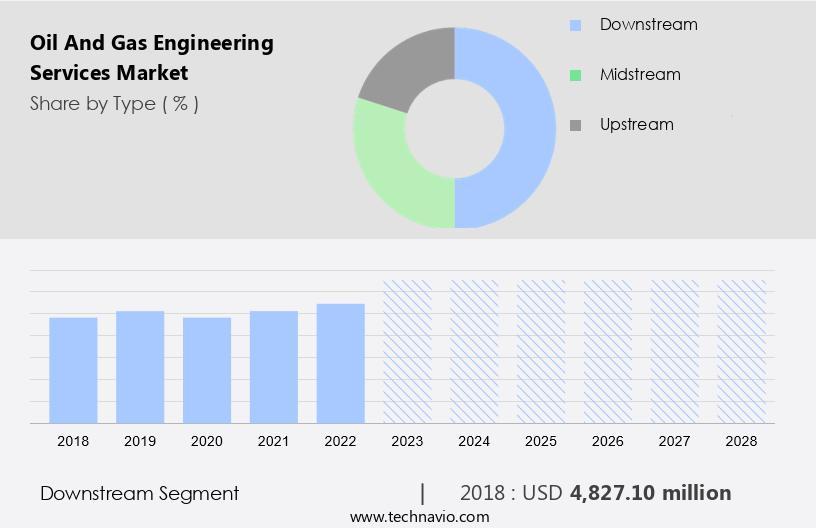
  • The downstream segment is estimated to witness significant growth during the forecast period.

The downstream segment of the market is expected to dominate the industry in 2023, driven by the increasing demand for reliable operations and asset integrity management in refining, transportation, and petroleum product sales. Downstream processes, including refining, processing, and transportation, are crucial for optimizing operations and enhancing the marketability of petroleum products. Automation technologies and productivity enhancements are key trends In the market, aiming to reduce costs and improve efficiency. Additionally, renewable energy sources and carbon footprint regulations are influencing the industry, with some companies investing in hydroelectric, wind, and solar power. Machine learning and strategic collaborations between multinational engineering firms and specialized niche players are also shaping the market landscape.

Oil And Gas Engineering Services Market Size

Get a glance at the  Oil And Gas Engineering Services Industry report of share of various segments Request Free Sample

The downstream segment was valued at USD 4.83 billion in 2018 and showed a gradual increase during the forecast period.

Regional Analysis

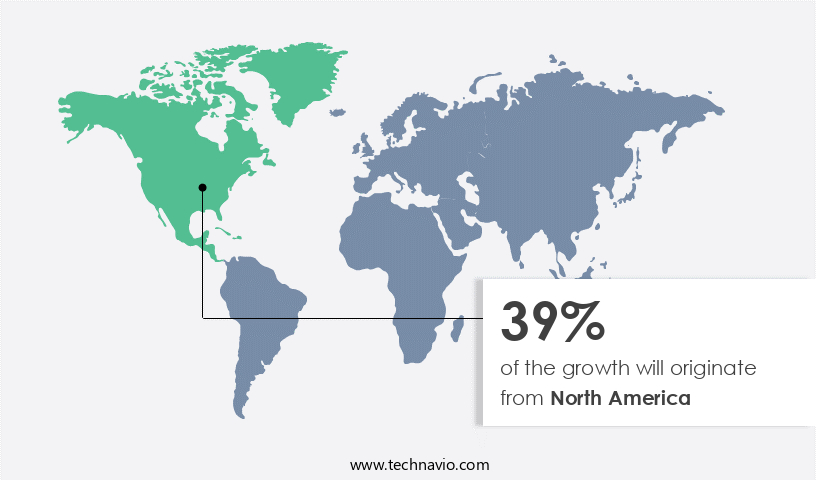
  • North America is estimated to contribute 39% to the growth of the global market during the forecast period.

Technavio's analysts have elaborately explained the regional trends and drivers that shape the market during the forecast period.

Oil And Gas Engineering Services Market Share by Geography

For more insights on the market share of various regions, Request Free Sample

The North American market is experiencing significant growth due to the increasing number of oil and gas projects In the US and Canada. The US, as the world's leading oil and gas producer, according to the US Energy Information Administration (EIA), has the longest pipeline network, with many projects involving substantial capital investments. The US natural gas pipeline grid is a comprehensive transmission and distribution system, enabling the transport of natural gas to and from nearly all states In the region. Automation technologies, productivity, and efficiency are key drivers In the market, with a focus on return on assets and engineering services.

Market Dynamics

Our researchers analyzed the data with 2023 as the base year, along with the key drivers, trends, and challenges. A holistic analysis of drivers will help companies refine their marketing strategies to gain a competitive advantage.

What are the key market drivers leading to the rise In the adoption of Oil And Gas Engineering Services Industry?

Increase in oil and gas E and P activities is the key driver of the market.

  • The market encompasses various activities In the energy sector, including upstream, midstream, and downstream processes. In the upstream segment, advancements in automation technologies have led to increased productivity and efficiency in identifying and extracting hydrocarbon resources. Data-oriented equipment, such as seismic acquisitions, provides accurate information on reserves without requiring actual drilling. Unconventional oil and gas resources, like shale and tight gas, have emerged as alternatives to conventional production in countries like the US, Canada, China, and Argentina. In the midstream and downstream sections, reliable operations and asset integrity management are crucial. Petroleum testing, hazardous location equipment, and Enterprise Asset Management systems are essential for ensuring the safety and efficiency of refining, transportation, and petroleum product manufacturing.
  • In addition, renewable energy sources and carbon footprint regulations are driving the need for innovation In the energy ecosystem. Machine learning and strategic collaborations between multinational engineering firms and specialized niche players are key to meeting the demands of a growing population and increasing energy requirements. The energy market is influenced by several factors, including demand patterns, regulatory developments, and technological advancements. Geopolitical factors and environmental considerations also play a significant role in shaping the market dynamics. The energy source landscape is evolving, with natural gas and electricity becoming increasingly important as energy sources for daily necessities like aviation, manufacturing, construction, and electricity.

What are the market trends shaping the Oil And Gas Engineering Services Industry?

Rising investments in shale industry is the upcoming market trend.

  • The market encompasses various sectors, including hydrocarbon sources, refining, transportation, and petroleum products. Automation technologies are increasingly being adopted to enhance productivity and efficiency In these areas, with machine learning and Enterprise Asset Management playing crucial roles. Renewable energy and carbon footprint regulations are influencing the industry's shift towards sustainability, with electric vehicles and geothermal energy gaining traction. Strategic collaborations, such as those between Semco Maritime AS and Project Innerspace, are shaping the market's landscape. In the downstream section, asset integrity management and petroleum testing are essential for reliable operations. Hazardous location equipment is vital for ensuring safety In the industry.
  • Furthermore, the Midstream and Upstream sectors are witnessing significant investments, driven by increasing demand patterns and regulatory developments. Technological advancements, including the use of AI and data analytics, are transforming the energy ecosystem. Environmental considerations and geopolitical factors are also influencing market dynamics. The US shale industry is experiencing high investments, with multinational engineering firms and specialized niche players focusing on mechanical, electrical, and civil engineering projects. The Short-Term Energy Outlook indicates a rise in natural gas demand, making infrastructure and equipment investments essential. The market's future growth is expected to be driven by factors such as population growth, electricity demand, and the need for energy sources for daily necessities.

What challenges does the Oil And Gas Engineering Services Industry face during its growth?

Competition from alternative energy sources is a key challenge affecting the industry growth.

  • The market is experiencing significant changes due to various market dynamics. The increasing global energy demand, coupled with clean energy initiatives and subsidies for renewable energy sources, is driving the shift towards sustainable energy solutions such as solar and wind. Renewable energy sources, which are clean, inexhaustible, and less carbon-intensive, are becoming increasingly popular as countries seek to reduce their carbon footprint and mitigate the environmental impact of traditional hydrocarbon sources. In the oil and gas industry, automation technologies are being adopted to enhance productivity and efficiency, while ensuring reliable operations and asset integrity management. Machine learning and artificial intelligence are being integrated into Enterprise Asset Management systems to optimize maintenance schedules and predict equipment failures, thereby improving return on assets.
  • In addition, the Downstream section of the oil and gas industry, including refining, transportation, and petroleum products, is also undergoing transformation. The rise of electric vehicles and increasing demand for natural gas as an energy source for electricity generation are impacting the demand patterns for petroleum products. Geopolitical factors, regulatory developments, and technological advancements are shaping the energy ecosystem, with a focus on sustainability and innovation. New pipelines and infrastructure are being developed to transport hydrocarbon resources, while strategic collaborations and partnerships between multinational engineering firms and specialized niche players are driving growth In the mechanical, electrical, civil, and chemical engineering sectors.

Exclusive Customer Landscape

The oil and gas engineering services market forecasting report includes the adoption lifecycle of the market, covering from the innovator's stage to the laggard's stage. It focuses on adoption rates in different regions based on penetration. Furthermore, the oil and gas engineering services market report also includes key purchase criteria and drivers of price sensitivity to help companies evaluate and develop their market growth analysis strategies.
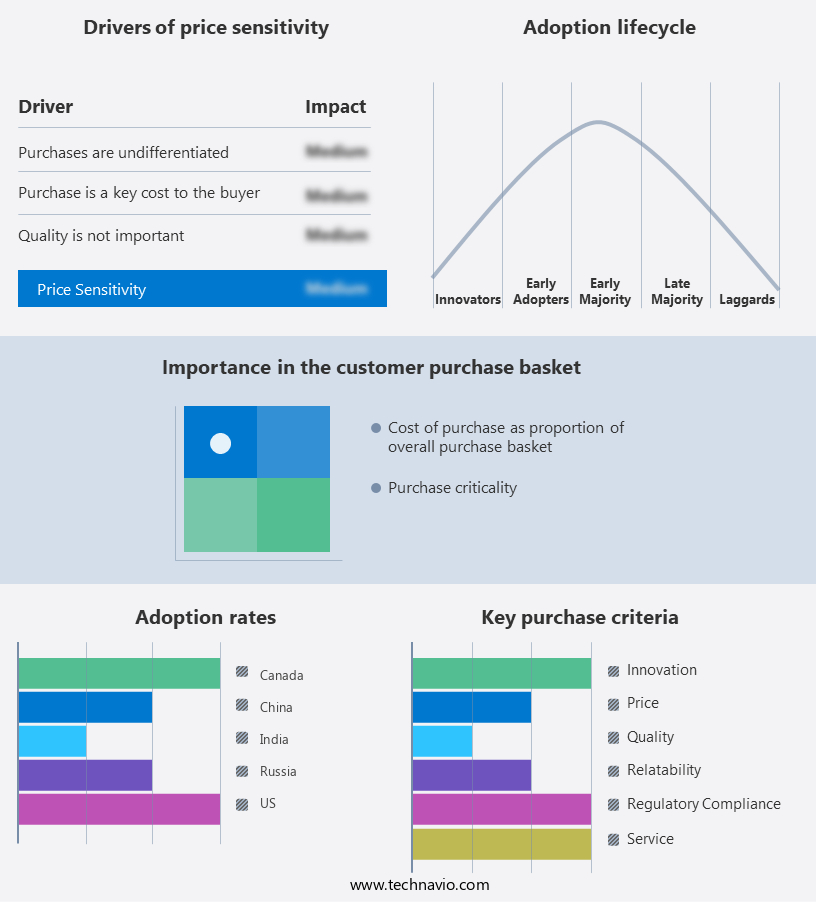
Oil And Gas Engineering Services Market Share by Geography

 Customer Landscape

Key Companies & Market Insights

Companies are implementing various strategies, such as strategic alliances, oil and gas engineering services market forecast, partnerships, mergers and acquisitions, geographical expansion, and product/service launches, to enhance their presence In the industry.

The industry research and growth report includes detailed analyses of the competitive landscape of the market and information about key companies, including:

  • Arseal Technologies
  • Creaform Inc.
  • Element Materials Technology Group Ltd.
  • Hatch Ltd.
  • John Wood Group PLC
  • L and T Technology Services Ltd.
  • LeMar Industries Inc.
  • Lloyds Register Group Services Ltd
  • M and H
  • Mannvit
  • Quest Global Services Pte. Ltd.
  • Raveon Technologies Corp.
  • Rockwell Automation Inc.
  • Sentiec Oyj
  • Stantec Inc.
  • Stress Engineering Services Inc.
  • Tetra Tech Inc.
  • Toyo Engineering Corp.
  • TRC Companies Inc.
  • WSP Global Inc.

Qualitative and quantitative analysis of companies has been conducted to help clients understand the wider business environment as well as the strengths and weaknesses of key industry players. Data is qualitatively analyzed to categorize companies as pure play, category-focused, industry-focused, and diversified; it is quantitatively analyzed to categorize companies as dominant, leading, strong, tentative, and weak.

Research Analyst Overview

The market encompasses a broad spectrum of specialized disciplines that play a crucial role In the exploration, production, processing, and transportation of hydrocarbon resources. This dynamic industry is driven by several key factors, including productivity and efficiency, return on assets, and the integration of automation technologies. Productivity and efficiency are paramount In the oil and gas sector, where the focus is on maximizing output while minimizing costs. Engineering services providers offer solutions in mechanical, electrical, civil, and chemical engineering to optimize operations and ensure reliable operations. Asset integrity management, petroleum testing, and hazardous location equipment are essential components of these services, ensuring the safety and longevity of infrastructure and equipment.

In addition, the energy landscape is undergoing significant changes, with renewable energy sources gaining prominence and carbon footprint regulations becoming increasingly stringent. The oil and gas industry is responding to these challenges by exploring strategic collaborations and technological advancements. For instance, machine learning and artificial intelligence are being employed to improve efficiency, reduce costs, and enhance safety. The energy ecosystem is evolving, with demand patterns shifting towards natural gas and electricity. Regulatory developments, geopolitical factors, and sustainability considerations are shaping the market dynamics. Multinational engineering firms and specialized niche players are collaborating to address the complex challenges of the industry, providing comprehensive engineering services for upstream, midstream, and downstream sectors.

Furthermore, the oil refining, transportation, and petroleum products segments are undergoing significant transformation, with the adoption of enterprise asset management systems and short-term energy outlooks becoming increasingly important. Project Innerspace and Element Materials are examples of innovative solutions that enable real-time monitoring and optimization of operations, ensuring the efficient use of resources and reducing downtime. Population growth and population density are driving the demand for energy, with natural gas emerging as a preferred energy source due to its lower carbon footprint compared to oil.

Therefore, the market is a dynamic and complex ecosystem, driven by productivity, efficiency, and the integration of automation technologies. The industry is undergoing significant changes, with renewable energy sources, carbon footprint regulations, and sustainability considerations shaping the market dynamics. Engineering services providers are collaborating to address these challenges, offering comprehensive solutions for upstream, midstream, and downstream sectors. The focus is on optimizing operations, reducing costs, and ensuring reliable and sustainable energy solutions for the future.

Market Scope

Report Coverage

Details

Page number

135

Base year

2023

Historic period

2018-2022

Forecast period

2024-2028

Growth momentum & CAGR

Accelerate at a CAGR of 8.51%

Market growth 2024-2028

USD 5.32 billion

Market structure

Fragmented

YoY growth 2023-2024(%)

7.67

Key countries

US, Canada, China, India, and Russia

Competitive landscape

Leading Companies, market growth and forecasting, Market Positioning of Companies, Competitive Strategies, and Industry Risks

Request Free Sample

What are the Key Data Covered in this Oil And Gas Engineering Services Market Research and Growth Report?

  • CAGR of the Oil And Gas Engineering Services industry during the forecast period
  • Detailed information on factors that will drive the growth and forecasting between 2024 and 2028
  • Precise estimation of the size of the market and its contribution of the industry in focus to the parent market
  • Accurate predictions about upcoming growth and trends and changes in consumer behaviour
  • Growth of the market across North America, APAC, Europe, Middle East and Africa, and South America
  • Thorough analysis of the market's competitive landscape and detailed information about companies
  • Comprehensive analysis of factors that will challenge the oil and gas engineering services market growth of industry companies

We can help! Our analysts can customize this oil and gas engineering services market research report to meet your requirements.

Get in touch

1 Executive Summary

  • 1.1 Market overview
    • Executive Summary - Chart on Market Overview
    • Executive Summary - Data Table on Market Overview
    • Executive Summary - Chart on Global Market Characteristics
    • Executive Summary - Chart on Market by Geography
    • Executive Summary - Chart on Market Segmentation by Type
    • Executive Summary - Chart on Incremental Growth
    • Executive Summary - Data Table on Incremental Growth
    • Executive Summary - Chart on Company Market Positioning

2 Market Landscape

  • 2.1 Market ecosystem
    • Parent Market
    • Data Table on - Parent Market
  • 2.2 Market characteristics
    • Market characteristics analysis
  • 2.3 Value chain analysis
    • Value Chain Analysis

3 Market Sizing

  • 3.1 Market definition
    • Offerings of companies included in the market definition
  • 3.2 Market segment analysis
    • Market segments
  • 3.3 Market size 2023
    • 3.4 Market outlook: Forecast for 2023-2028
      • Chart on Global - Market size and forecast 2023-2028 ($ million)
      • Data Table on Global - Market size and forecast 2023-2028 ($ million)
      • Chart on Global Market: Year-over-year growth 2023-2028 (%)
      • Data Table on Global Market: Year-over-year growth 2023-2028 (%)

    4 Historic Market Size

    • 4.1 Global Oil And Gas Engineering Services Market 2018 - 2022
      • Historic Market Size - Data Table on Global Oil And Gas Engineering Services Market 2018 - 2022 ($ million)
    • 4.2 Type segment analysis 2018 - 2022
      • Historic Market Size - Type Segment 2018 - 2022 ($ million)
    • 4.3 Geography segment analysis 2018 - 2022
      • Historic Market Size - Geography Segment 2018 - 2022 ($ million)
    • 4.4 Country segment analysis 2018 - 2022
      • Historic Market Size - Country Segment 2018 - 2022 ($ million)

    5 Five Forces Analysis

    • 5.1 Five forces summary
      • Five forces analysis - Comparison between 2023 and 2028
    • 5.2 Bargaining power of buyers
      • Bargaining power of buyers - Impact of key factors 2023 and 2028
    • 5.3 Bargaining power of suppliers
      • Bargaining power of suppliers - Impact of key factors in 2023 and 2028
    • 5.4 Threat of new entrants
      • Threat of new entrants - Impact of key factors in 2023 and 2028
    • 5.5 Threat of substitutes
      • Threat of substitutes - Impact of key factors in 2023 and 2028
    • 5.6 Threat of rivalry
      • Threat of rivalry - Impact of key factors in 2023 and 2028
    • 5.7 Market condition
      • Chart on Market condition - Five forces 2023 and 2028

    6 Market Segmentation by Type

    • 6.1 Market segments
      • Chart on Type - Market share 2023-2028 (%)
      • Data Table on Type - Market share 2023-2028 (%)
    • 6.2 Comparison by Type
      • Chart on Comparison by Type
      • Data Table on Comparison by Type
    • 6.3 Downstream - Market size and forecast 2023-2028
      • Chart on Downstream - Market size and forecast 2023-2028 ($ million)
      • Data Table on Downstream - Market size and forecast 2023-2028 ($ million)
      • Chart on Downstream - Year-over-year growth 2023-2028 (%)
      • Data Table on Downstream - Year-over-year growth 2023-2028 (%)
    • 6.4 Midstream - Market size and forecast 2023-2028
      • Chart on Midstream - Market size and forecast 2023-2028 ($ million)
      • Data Table on Midstream - Market size and forecast 2023-2028 ($ million)
      • Chart on Midstream - Year-over-year growth 2023-2028 (%)
      • Data Table on Midstream - Year-over-year growth 2023-2028 (%)
    • 6.5 Upstream - Market size and forecast 2023-2028
      • Chart on Upstream - Market size and forecast 2023-2028 ($ million)
      • Data Table on Upstream - Market size and forecast 2023-2028 ($ million)
      • Chart on Upstream - Year-over-year growth 2023-2028 (%)
      • Data Table on Upstream - Year-over-year growth 2023-2028 (%)
    • 6.6 Market opportunity by Type
      • Market opportunity by Type ($ million)
      • Data Table on Market opportunity by Type ($ million)

    7 Customer Landscape

    • 7.1 Customer landscape overview
      • Analysis of price sensitivity, lifecycle, customer purchase basket, adoption rates, and purchase criteria

    8 Geographic Landscape

    • 8.1 Geographic segmentation
      • Chart on Market share by geography 2023-2028 (%)
      • Data Table on Market share by geography 2023-2028 (%)
    • 8.2 Geographic comparison
      • Chart on Geographic comparison
      • Data Table on Geographic comparison
    • 8.3 North America - Market size and forecast 2023-2028
      • Chart on North America - Market size and forecast 2023-2028 ($ million)
      • Data Table on North America - Market size and forecast 2023-2028 ($ million)
      • Chart on North America - Year-over-year growth 2023-2028 (%)
      • Data Table on North America - Year-over-year growth 2023-2028 (%)
    • 8.4 APAC - Market size and forecast 2023-2028
      • Chart on APAC - Market size and forecast 2023-2028 ($ million)
      • Data Table on APAC - Market size and forecast 2023-2028 ($ million)
      • Chart on APAC - Year-over-year growth 2023-2028 (%)
      • Data Table on APAC - Year-over-year growth 2023-2028 (%)
    • 8.5 Europe - Market size and forecast 2023-2028
      • Chart on Europe - Market size and forecast 2023-2028 ($ million)
      • Data Table on Europe - Market size and forecast 2023-2028 ($ million)
      • Chart on Europe - Year-over-year growth 2023-2028 (%)
      • Data Table on Europe - Year-over-year growth 2023-2028 (%)
    • 8.6 Middle East and Africa - Market size and forecast 2023-2028
      • Chart on Middle East and Africa - Market size and forecast 2023-2028 ($ million)
      • Data Table on Middle East and Africa - Market size and forecast 2023-2028 ($ million)
      • Chart on Middle East and Africa - Year-over-year growth 2023-2028 (%)
      • Data Table on Middle East and Africa - Year-over-year growth 2023-2028 (%)
    • 8.7 South America - Market size and forecast 2023-2028
      • Chart on South America - Market size and forecast 2023-2028 ($ million)
      • Data Table on South America - Market size and forecast 2023-2028 ($ million)
      • Chart on South America - Year-over-year growth 2023-2028 (%)
      • Data Table on South America - Year-over-year growth 2023-2028 (%)
    • 8.8 US - Market size and forecast 2023-2028
      • Chart on US - Market size and forecast 2023-2028 ($ million)
      • Data Table on US - Market size and forecast 2023-2028 ($ million)
      • Chart on US - Year-over-year growth 2023-2028 (%)
      • Data Table on US - Year-over-year growth 2023-2028 (%)
    • 8.9 Canada - Market size and forecast 2023-2028
      • Chart on Canada - Market size and forecast 2023-2028 ($ million)
      • Data Table on Canada - Market size and forecast 2023-2028 ($ million)
      • Chart on Canada - Year-over-year growth 2023-2028 (%)
      • Data Table on Canada - Year-over-year growth 2023-2028 (%)
    • 8.10 China - Market size and forecast 2023-2028
      • Chart on China - Market size and forecast 2023-2028 ($ million)
      • Data Table on China - Market size and forecast 2023-2028 ($ million)
      • Chart on China - Year-over-year growth 2023-2028 (%)
      • Data Table on China - Year-over-year growth 2023-2028 (%)
    • 8.11 India - Market size and forecast 2023-2028
      • Chart on India - Market size and forecast 2023-2028 ($ million)
      • Data Table on India - Market size and forecast 2023-2028 ($ million)
      • Chart on India - Year-over-year growth 2023-2028 (%)
      • Data Table on India - Year-over-year growth 2023-2028 (%)
    • 8.12 Russia - Market size and forecast 2023-2028
      • Chart on Russia - Market size and forecast 2023-2028 ($ million)
      • Data Table on Russia - Market size and forecast 2023-2028 ($ million)
      • Chart on Russia - Year-over-year growth 2023-2028 (%)
      • Data Table on Russia - Year-over-year growth 2023-2028 (%)
    • 8.13 Market opportunity by geography
      • Market opportunity by geography ($ million)
      • Data Tables on Market opportunity by geography ($ million)

    9 Drivers, Challenges, and Opportunity/Restraints

    • 9.1 Market drivers
      • 9.2 Market challenges
        • 9.3 Impact of drivers and challenges
          • Impact of drivers and challenges in 2023 and 2028
        • 9.4 Market opportunities/restraints

          10 Competitive Landscape

          • 10.1 Overview
            • 10.2 Competitive Landscape
              • Overview on criticality of inputs and factors of differentiation
            • 10.3 Landscape disruption
              • Overview on factors of disruption
            • 10.4 Industry risks
              • Impact of key risks on business

            11 Competitive Analysis

            • 11.1 Companies profiled
              • Companies covered
            • 11.2 Market positioning of companies
              • Matrix on companies position and classification
            • 11.3 Arseal Technologies
              • Arseal Technologies - Overview
              • Arseal Technologies - Product / Service
              • Arseal Technologies - Key offerings
            • 11.4 Element Materials Technology Group Ltd.
              • Element Materials Technology Group Ltd. - Overview
              • Element Materials Technology Group Ltd. - Product / Service
              • Element Materials Technology Group Ltd. - Key offerings
            • 11.5 John Wood Group PLC
              • John Wood Group PLC - Overview
              • John Wood Group PLC - Business segments
              • John Wood Group PLC - Key offerings
              • John Wood Group PLC - Segment focus
            • 11.6 L and T Technology Services Ltd.
              • L and T Technology Services Ltd. - Overview
              • L and T Technology Services Ltd. - Business segments
              • L and T Technology Services Ltd. - Key offerings
              • L and T Technology Services Ltd. - Segment focus
            • 11.7 Mannvit
              • Mannvit - Overview
              • Mannvit - Product / Service
              • Mannvit - Key offerings
            • 11.8 Sentiec Oyj
              • Sentiec Oyj - Overview
              • Sentiec Oyj - Key offerings
            • 11.9 Stress Engineering Services Inc.
              • Stress Engineering Services Inc. - Overview
              • Stress Engineering Services Inc. - Product / Service
              • Stress Engineering Services Inc. - Key offerings
            • 11.10 Tetra Tech Inc.
              • Tetra Tech Inc. - Overview
              • Tetra Tech Inc. - Business segments
              • Tetra Tech Inc. - Key offerings
              • Tetra Tech Inc. - Segment focus
            • 11.11 Toyo Engineering Corp.
              • Toyo Engineering Corp. - Overview
              • Toyo Engineering Corp. - Business segments
              • Toyo Engineering Corp. - Key offerings
              • Toyo Engineering Corp. - Segment focus
            • 11.12 WSP Global Inc.
              • WSP Global Inc. - Overview
              • WSP Global Inc. - Business segments
              • WSP Global Inc. - Key offerings
              • WSP Global Inc. - Segment focus

            12 Appendix

            • 12.1 Scope of the report
              • 12.2 Inclusions and exclusions checklist
                • Inclusions checklist
                • Exclusions checklist
              • 12.3 Currency conversion rates for US$
                • Currency conversion rates for US$
              • 12.4 Research methodology
                • Research methodology
              • 12.5 Data procurement
                • Information sources
              • 12.6 Data validation
                • Data validation
              • 12.7 Validation techniques employed for market sizing
                • Validation techniques employed for market sizing
              • 12.8 Data synthesis
                • Data synthesis
              • 360 degree market analysis
                • 360 degree market analysis
              • 12.10 List of abbreviations
                • List of abbreviations

              Research Methodology

              Technavio presents a detailed picture of the market by way of study, synthesis, and summation of data from multiple sources. The analysts have presented the various facets of the market with a particular focus on identifying the key industry influencers. The data thus presented is comprehensive, reliable, and the result of extensive research, both primary and secondary.

              INFORMATION SOURCES

              Primary sources

              • Manufacturers and suppliers
              • Channel partners
              • Industry experts
              • Strategic decision makers

              Secondary sources

              • Industry journals and periodicals
              • Government data
              • Financial reports of key industry players
              • Historical data
              • Press releases

              DATA ANALYSIS

              Data Synthesis

              • Collation of data
              • Estimation of key figures
              • Analysis of derived insights

              Data Validation

              • Triangulation with data models
              • Reference against proprietary databases
              • Corroboration with industry experts

              REPORT WRITING

              Qualitative

              • Market drivers
              • Market challenges
              • Market trends
              • Five forces analysis

              Quantitative

              • Market size and forecast
              • Market segmentation
              • Geographical insights
              • Competitive landscape

              Interested in this report?

              Get your sample now to see our research methodology and insights!

              Download Now

              Frequently Asked Questions

              Oil And Gas Engineering Services market growth will increase by $ 5316.7 mn during 2024-2028 .

              The Oil And Gas Engineering Services market is expected to grow at a CAGR of 8.51% during 2024-2028 .

              Oil And Gas Engineering Services market is segmented by Type( Downstream, Midstream, Upstream)

              Arseal Technologies, Creaform Inc., Element Materials Technology Group Ltd., Hatch Ltd., John Wood Group PLC, L and T Technology Services Ltd., LeMar Industries Inc., Lloyds Register Group Services Ltd, M and H, Mannvit, Quest Global Services Pte. Ltd., Raveon Technologies Corp., Rockwell Automation Inc., Sentiec Oyj, Stantec Inc., Stress Engineering Services Inc., Tetra Tech Inc., Toyo Engineering Corp., TRC Companies Inc., WSP Global Inc. are a few of the key vendors in the Oil And Gas Engineering Services market.

              North America will register the highest growth rate of 39% among the other regions. Therefore, the Oil And Gas Engineering Services market in North America is expected to garner significant business opportunities for the vendors during the forecast period.

              US, Canada, China, India, Russia

              • Increase in oil and gas E and P activitiesE is the driving factor this market.
              • 65 is the driving factor this market.
              • 65); font-size: 14px; text-align: left"> and P is an upstream oil and gas activity that has undergone several improvements with recent technological advancements. For example is the driving factor this market.
              • the development of data-oriented and sensitive equipment has helped in the accurate identification of the underlying reserves without the need to perform actual drilling. On the basis of the data obtained from seismic acquisitions is the driving factor this market.
              • further E is the driving factor this market.
              • 65 is the driving factor this market.
              • 65); font-size: 14px; text-align: left"> and P activities are carried out. In addition is the driving factor this market.
              • unconventional oil and gas E is the driving factor this market.
              • 65 is the driving factor this market.
              • 65); font-size: 14px; text-align: left"> and P activities have become an alternative to conventional production. Major unconventional oil and gas reserves have been identified in the US is the driving factor this market.
              • Canada is the driving factor this market.
              • China is the driving factor this market.
              • and Argentina. The US and Canada are among the countries carrying out drilling activities to tap unconventional resources. The US has a significant amount of shale oil and gas reserves. According to the US EIA is the driving factor this market.
              • in 2020 is the driving factor this market.
              • about 6.5 mbpd of crude oil was produced directly from tight oil resources is the driving factor this market.
              • which accounted for about 59% of the total crude oil production in the country. Similarly is the driving factor this market.
              • shale oil and gas are known to be unconventional fossil fuels with a huge potential for development in Europe. Thus is the driving factor this market.
              • investments in the E is the driving factor this market.
              • 65 is the driving factor this market.
              • 65); font-size: 14px; text-align: left"> and P of unconventional oil and gas have offered tremendous growth opportunities to vendors in the market. Several countries are planning to start production from offshore oil and gas fields. For instance is the driving factor this market.
              • Norway has planned to expand its offshore oil E is the driving factor this market.
              • 65 is the driving factor this market.
              • 65); font-size: 14px; text-align: left"> and P activities is the driving factor this market.
              • with its Johan Sverdrup and Johan Castberg oil and gas fields expected to start production by the end of 2022. Therefore is the driving factor this market.
              • an increase in E is the driving factor this market.
              • 65 is the driving factor this market.
              • 65); font-size: 14px; text-align: left"> and P activities by large oil and gas companies in both conventional and unconventional oil and gas production will have a positive impact on the growth of the global oil and gas engineering services market during the forecast period. is the driving factor this market.

              The Oil And Gas Engineering Services market vendors should focus on grabbing business opportunities from the Downstream segment as it accounted for the largest market share in the base year.