Oil Refining Market Analysis, Size, and Forecast 2026-2030: North America (US, Canada, and Mexico), Europe (Germany, Italy, and Spain), APAC (China, India, and South Korea), Middle East and Africa (Saudi Arabia, UAE, and South Africa), South America (Brazil and Argentina), and Rest of World (ROW)

Oil Refining Market Analysis, Size, and Forecast 2026-2030:
North America (US, Canada, and Mexico), Europe (Germany, Italy, and Spain), APAC (China, India, and South Korea), Middle East and Africa (Saudi Arabia, UAE, and South Africa), South America (Brazil and Argentina), and Rest of World (ROW)

Published: Apr 2026 329 Pages SKU: IRTNTR75610

Market Overview at a Glance

$112.5 B
Market Opportunity
1.3%
CAGR 2025 - 2030
33.4%
North America Growth
$668.6 B
Light distillates segment 2024

Oil Refining Market Size 2026-2030

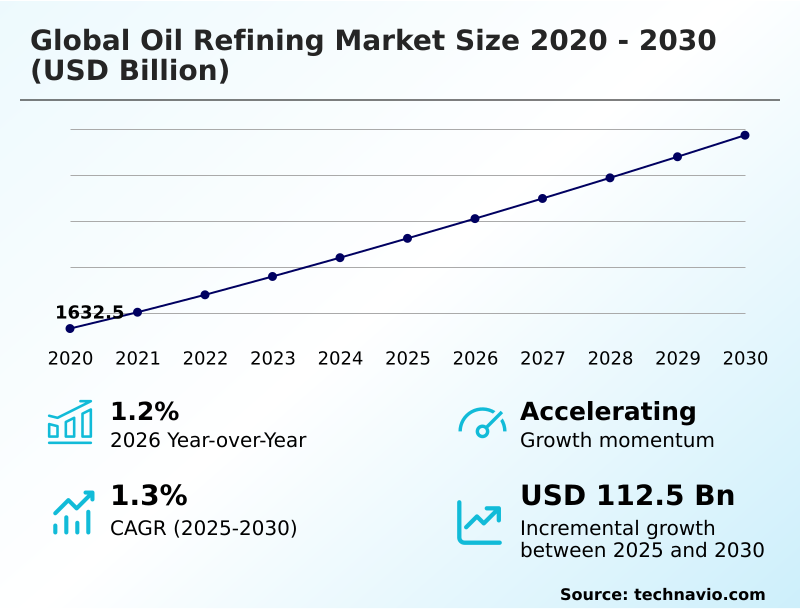
The oil refining market size is valued to increase by USD 112.5 billion, at a CAGR of 1.3% from 2025 to 2030. Industrialization of modern mega-refineries and capacity geography shifting will drive the oil refining market.

Major Market Trends & Insights

  • North America dominated the market and accounted for a 33.4% growth during the forecast period.
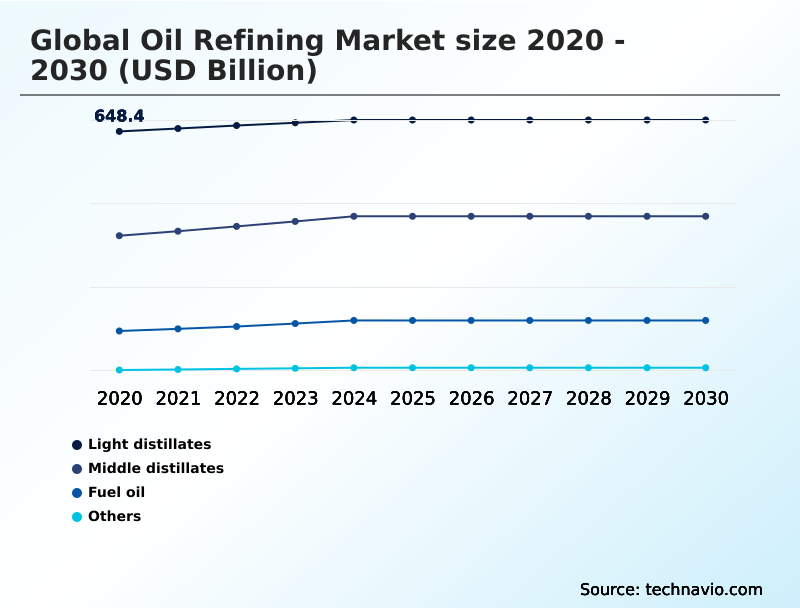
  • By Product - Light distillates segment was valued at USD 668.6 billion in 2024
  • By Fuel Type - Gasoline segment accounted for the largest market revenue share in 2024

Market Size & Forecast

  • Market Opportunities: USD 210.9 billion
  • Market Future Opportunities: USD 112.5 billion
  • CAGR from 2025 to 2030 : 1.3%

Market Summary

  • The oil refining market is navigating a complex transition, balancing traditional fuel production with emerging energy demands. Core industrial processes remain central, where crude oil is transformed through a sequence of operations into valuable products. This begins with separation and moves to conversion processes designed to maximize the yield of lighter, more valuable fractions.
  • A primary application is the production of transportation fuels, but the synthesis of heating oils, lubricants, and essential petrochemical precursors is also critical. A key business scenario involves optimizing refinery operations to handle a more varied crude slate, a direct response to supply chain volatility.
  • Refiners must adjust their process units to maintain output quality and volume despite fluctuations in feedstock properties. This operational agility is crucial for preserving margins in a competitive environment where efficiency and product specifications are paramount for market success.
  • The sector faces the dual challenge of meeting current energy needs while investing in technologies that align with a lower-carbon future, a strategic imperative for long-term viability.

What will be the Size of the Oil Refining Market during the forecast period?

Get Key Insights on Market Forecast (PDF) Request Free Sample

How is the Oil Refining Market Segmented?

The oil refining industry research report provides comprehensive data (region-wise segment analysis), with forecasts and estimates in "USD billion" for the period 2026-2030, as well as historical data from 2020-2024 for the following segments.

  • Product
    • Light distillates
    • Middle distillates
    • Fuel oil
    • Others
  • Fuel type
    • Gasoline
    • Kerosene
    • LPG
    • Others
  • End-user
    • Transportation
    • Petrochemicals
    • Residential and commercial heating
    • Power generation
    • Others
  • Capacity
    • Large-scale refineries
    • Medium-scale refineries
    • Small-scale refineries
  • Geography
    • North America
      • US
      • Canada
      • Mexico
    • Europe
      • Germany
      • Italy
      • Spain
    • APAC
      • China
      • India
      • South Korea
    • Middle East and Africa
      • Saudi Arabia
      • UAE
      • South Africa
    • South America
      • Brazil
      • Argentina
    • Rest of World (ROW)

By Product Insights

The light distillates segment is estimated to witness significant growth during the forecast period.

The light distillates segment is a critical component of the refining industry, encompassing high-value products such as gasoline and petrochemical feedstocks. Refiners focus on yield optimization and margin optimization through advanced reforming techniques to produce cleaner fuels.

The strategic goal of downstream integration allows operators to adapt to a fluctuating crude slate while meeting demand for ultra-low sulfur diesel and jet fuel.

In the ongoing energy transition, effective process optimization and scheduling optimization are crucial for maintaining profitability.

Advanced modeling has enabled facilities to improve output of high-demand distillates by up to 8% without major capital expenditure, showcasing the segment's reliance on technical agility.

Request Free Sample

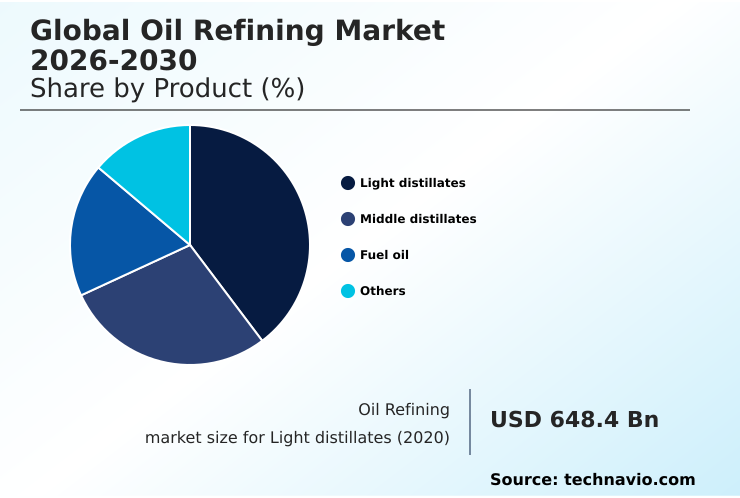
The Light distillates segment was valued at USD 668.6 billion in 2024 and showed a gradual increase during the forecast period.

Request Free Sample

Regional Analysis

North America is estimated to contribute 33.4% to the growth of the global market during the forecast period.Technavio’s analysts have elaborately explained the regional trends and drivers that shape the market during the forecast period.

See How Oil Refining Market Demand is Rising in North America Request Free Sample

The geographic landscape is shifting as new, large-scale facilities come online, optimized for specific regional feedstocks like light sweet crude.

These modern plants employ advanced atmospheric distillation and vacuum distillation at the front end, feeding complex fluid catalytic cracking and hydroprocessing units.

The goal is achieving greater feedstock diversification and petrochemical integration, producing everything from high-octane gasoline to marine gas oil. Strategic debottlenecking of existing infrastructure has increased throughput by as much as 10% in some regions.

A strong focus on energy efficiency and emissions reduction is evident, with some operators co-processing hydrotreated vegetable oils. These efforts have led to a documented 5% reduction in carbon intensity per barrel processed.

Market Dynamics

Our researchers analyzed the data with 2025 as the base year, along with the key drivers, trends, and challenges. A holistic analysis of drivers will help companies refine their marketing strategies to gain a competitive advantage.

  • Strategic decision-making in the oil refining sector increasingly hinges on a multidimensional understanding of operational and market variables. A critical consideration is the impact of crude slate on refinery margins, as feedstock costs and quality directly influence profitability. To enhance value, many operators are exploring sustainable aviation fuel conversion technologies and integrating biorefining into traditional refineries.
  • This pivot requires optimizing fluid catalytic cracking unit performance for new feedstocks. The adoption of digital twin applications for oil refining provides a virtual environment to model these changes, offering a 30% improvement in process simulation accuracy over traditional methods. This helps in managing crack spreads in volatile markets and assessing advances in hydrocracking catalyst technology.
  • Furthermore, there are inherent challenges of processing heavy sour crude, which many newer, high-complexity refineries are designed to handle. This industrial shift is influenced by the role of green hydrogen in decarbonizing refineries and the imperative for carbon capture utilization and storage in refining. Investment in crude-to-chemicals project feasibility analysis and petrochemical integration for value chain maximization is becoming standard.
  • These capital-intensive projects, including brownfield refinery conversion for biofuels, rely on robust predictive maintenance for refinery equipment reliability and asset performance management in downstream operations. Sophisticated refinery scheduling and optimization software is essential for coordinating the co-processing of renewable feedstocks in refineries, ensuring adherence to regulatory compliance for ultra-low sulfur diesel, and executing strategic debottlenecking for capacity enhancement.

What are the key market drivers leading to the rise in the adoption of Oil Refining Industry?

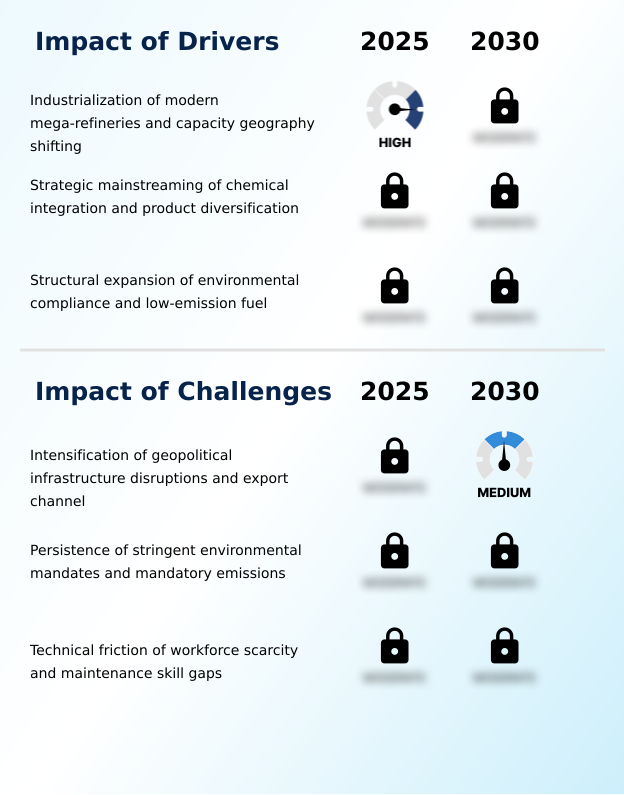
  • A key market driver is the industrialization of modern mega-refineries, which is causing a strategic shift in global refining capacity geography.

  • The modernization of refinery configuration is a major market driver, with a focus on increasing capacity utilization and upgrading units for fuel oil and lpg processing.
  • Advanced hydrocracking and coking units are key to this bottom-upgradation, allowing refineries to process heavier crudes. The integration of predictive maintenance systems has proven to reduce equipment downtime by up to 25%.
  • Furthermore, there is a significant push toward environmental sustainability through carbon capture and storage and the use of green hydrogen. Many facilities are now capable of co-processing feedstocks to produce renewable diesel.
  • This strategic desulfurization and upgrading of infrastructure allows operators to meet stricter emissions targets while improving operational efficiency by over 12%.

What are the market trends shaping the Oil Refining Industry?

  • A key market trend is the integration of biorefining processes. This includes the strategic conversion of facilities for sustainable aviation fuel production.

  • Key trends are reshaping the production of middle distillates and kerosene, driven by the dual goals of decarbonization and value addition. The adoption of biorefining and crude-to-chemicals strategies reflects a move beyond traditional fuel production. This involves brownfield transformation of legacy assets into centers for circular refining, capable of producing sustainable aviation fuel.
  • Investment in advanced hydrotreating and isomerization technologies is rising, with facilities increasing their nelson complexity index. These upgrades enable more efficient catalytic cracking and deep conversion, improving plant-wide efficiency by over 10% and enabling the processing of more diverse feedstocks. The use of digital twins allows for a 15% more accurate prediction of unit performance.

What challenges does the Oil Refining Industry face during its growth?

  • A primary challenge affecting industry growth is the intensification of geopolitical disruptions impacting critical infrastructure and export channels.

  • Navigating market volatility presents a significant challenge, directly impacting refinery runs, crack spreads, and the profitability of products like lubricants. A key issue is maintaining feedstock flexibility when dealing with inconsistent supplies of sour crude and heavy crude. Effective alkylation processes become crucial for maintaining product quality.
  • To mitigate these risks, operators are enhancing operational resilience through superior asset performance management and advanced supply chain optimization. Investment in modern process control systems and advanced process control can improve plant stability by 20%. Robust refinery planning is essential to buffer against supply disruptions, with some operators seeing a 15% improvement in their ability to manage feedstock interruptions.

Exclusive Technavio Analysis on Customer Landscape

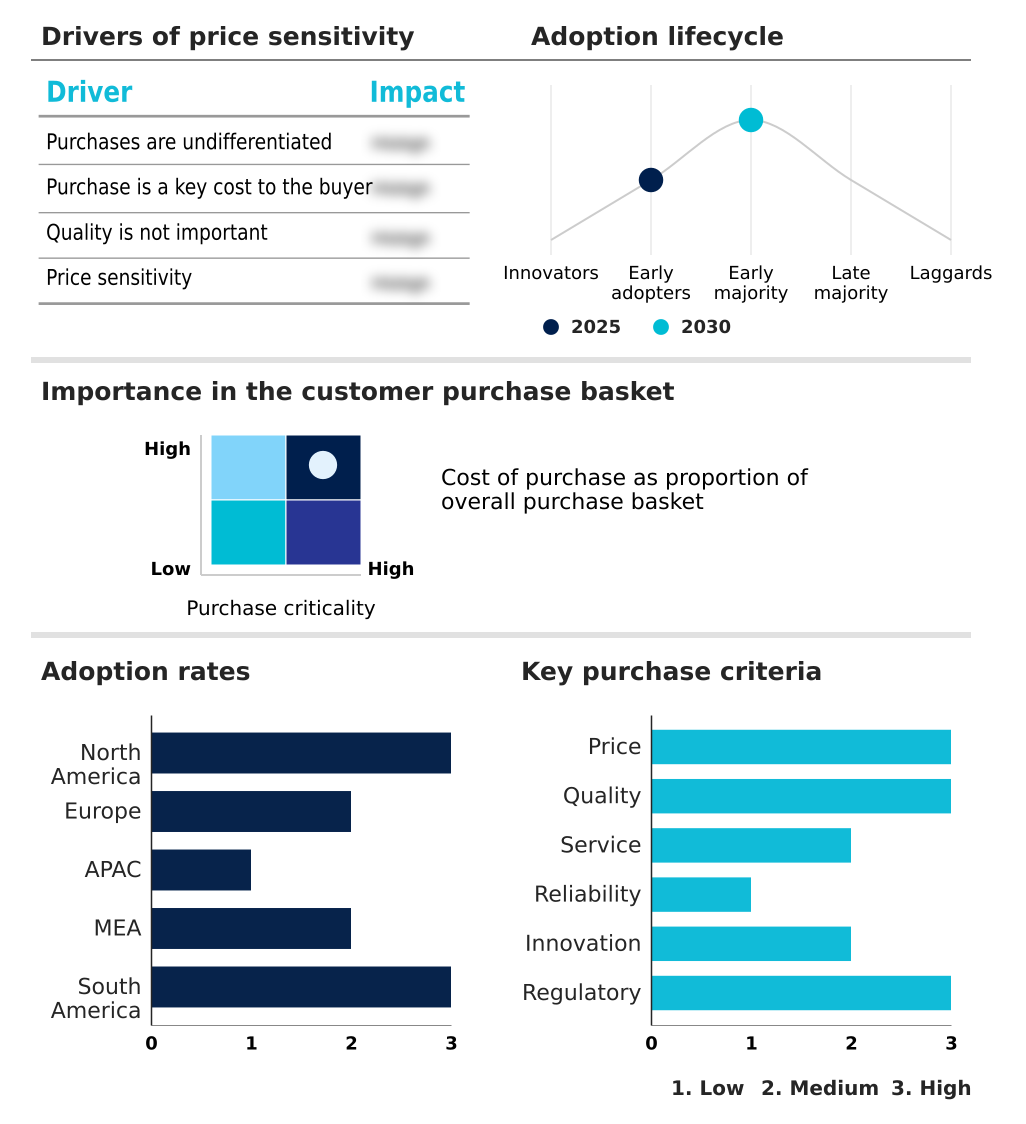
The oil refining market forecasting report includes the adoption lifecycle of the market, covering from the innovator’s stage to the laggard’s stage. It focuses on adoption rates in different regions based on penetration. Furthermore, the oil refining market report also includes key purchase criteria and drivers of price sensitivity to help companies evaluate and develop their market growth analysis strategies.

Customer Landscape of Oil Refining Industry

Competitive Landscape

Companies are implementing various strategies, such as strategic alliances, oil refining market forecast, partnerships, mergers and acquisitions, geographical expansion, and product/service launches, to enhance their presence in the industry.

Bharat Petroleum Corp. Ltd. - Specializes in large-scale crude oil refining into fuels, petrochemicals, and lubricants, with a focus on enhancing operational energy efficiency.

The industry research and growth report includes detailed analyses of the competitive landscape of the market and information about key companies, including:

  • Bharat Petroleum Corp. Ltd.
  • BP Plc
  • Chevron Corp.
  • China National Petroleum Corp.
  • Eni SpA
  • Exxon Mobil Corp.
  • HollyFrontier Corp.
  • Indian Oil Corp. Ltd.
  • Marathon Petroleum Corp.
  • Neste Corp.
  • PBF Energy Inc.
  • Phillips 66 Co.
  • Polski Koncern Naftowy ORLEN SA
  • Reliance Industries Ltd.
  • Repsol SA
  • Saudi Arabian Oil Co.
  • Shell plc
  • Sinopec Shanghai Co. Ltd.
  • TotalEnergies SE
  • Valero Energy Corp.

Qualitative and quantitative analysis of companies has been conducted to help clients understand the wider business environment as well as the strengths and weaknesses of key industry players. Data is qualitatively analyzed to categorize companies as pure play, category-focused, industry-focused, and diversified; it is quantitatively analyzed to categorize companies as dominant, leading, strong, tentative, and weak.

Recent Development and News in Oil refining market

  • In September 2024, Dangote Petroleum Refinery announced it reached its full refining capacity of 650,000 barrels per day, a pivotal moment for regional energy self-sufficiency.
  • In October 2024, Eni SpA secured a EUR 500 million financing agreement with the European Investment Bank to convert its Sannazzaro refinery into a high-capacity biofuel production facility.
  • In January 2025, Exxon Mobil Corp. and Saudi Arabian Oil Co. established a new venture framework agreement to evaluate a major upgrade of the Samref refinery in Yanbu, focusing on increased petrochemicals conversion.
  • In April 2025, Shell plc announced plans to divest its refining operations in Singapore as part of a strategic portfolio realignment to focus on high-margin assets and energy transition projects.

Dive into Technavio’s robust research methodology, blending expert interviews, extensive data synthesis, and validated models for unparalleled Oil Refining Market insights. See full methodology.

Market Scope
Page number 329
Base year 2025
Historic period 2020-2024
Forecast period 2026-2030
Growth momentum & CAGR Accelerate at a CAGR of 1.3%
Market growth 2026-2030 USD 112.5 billion
Market structure Fragmented
YoY growth 2025-2026(%) 1.2%
Key countries US, Canada, Mexico, Russia, Germany, Italy, Spain, France, UK, China, India, South Korea, Japan, Indonesia, Australia, Saudi Arabia, UAE, South Africa, Turkey, Israel, Brazil, Argentina and Chile
Competitive landscape Leading Companies, Market Positioning of Companies, Competitive Strategies, and Industry Risks

Request Free Sample

Research Analyst Overview

  • The oil refining market is defined by its complex refinery configuration and focus on processing a varied crude slate, from light sweet crude to heavy crude and sour crude, to maximize margins. Key processes include atmospheric distillation, vacuum distillation, fluid catalytic cracking, and deep conversion methods like hydrocracking and coking. Subsequent hydrotreating, reforming, isomerization, and alkylation enhance product quality.
  • Feedstock flexibility is critical, as operators adjust refinery runs and capacity utilization to manage crack spreads, a key profitability metric. The output slate includes light distillates, middle distillates, and fuel oil, with specific products like gasoline (including high-octane gasoline), kerosene, lpg, lubricants, jet fuel, and petrochemical feedstocks.
  • A primary boardroom focus is on compliance, driving investment in desulfurization and hydroprocessing to produce ultra-low sulfur diesel and marine gas oil that meet stringent regulations. Investment in advanced catalytic cracking units has been shown to improve yields by over 5%, directly impacting bottom-line performance.

What are the Key Data Covered in this Oil Refining Market Research and Growth Report?

  • What is the expected growth of the Oil Refining Market between 2026 and 2030?

    • USD 112.5 billion, at a CAGR of 1.3%

  • What segmentation does the market report cover?

    • The report is segmented by Product (Light distillates, Middle distillates, Fuel oil, and Others), Fuel Type (Gasoline, Kerosene, LPG, and Others), End-user (Transportation, Petrochemicals, Residential and commercial heating, Power generation, and Others), Capacity (Large-scale refineries, Medium-scale refineries, and Small-scale refineries) and Geography (North America, Europe, APAC, Middle East and Africa, South America)

  • Which regions are analyzed in the report?

    • North America, Europe, APAC, Middle East and Africa and South America

  • What are the key growth drivers and market challenges?

    • Industrialization of modern mega-refineries and capacity geography shifting, Intensification of geopolitical infrastructure disruptions and export channel

  • Who are the major players in the Oil Refining Market?

    • Bharat Petroleum Corp. Ltd., BP Plc, Chevron Corp., China National Petroleum Corp., Eni SpA, Exxon Mobil Corp., HollyFrontier Corp., Indian Oil Corp. Ltd., Marathon Petroleum Corp., Neste Corp., PBF Energy Inc., Phillips 66 Co., Polski Koncern Naftowy ORLEN SA, Reliance Industries Ltd., Repsol SA, Saudi Arabian Oil Co., Shell plc, Sinopec Shanghai Co. Ltd., TotalEnergies SE and Valero Energy Corp.

Market Research Insights

  • The sector is undergoing a profound energy transition, shifting focus through downstream integration and petrochemical integration. This involves brownfield transformation and debottlenecking of existing assets, alongside a push for feedstock diversification. Key strategies include biorefining for renewable diesel and sustainable aviation fuel, often using hydrotreated vegetable oils.
  • Crude-to-chemicals projects are pivotal, supported by green hydrogen and carbon capture and storage for emissions reduction. Operations are being revolutionized by digital twins, advanced process control, and predictive maintenance for enhanced asset performance management and operational resilience. This results in superior margin optimization, with digital solutions delivering up to a 15% improvement in yield optimization.
  • Firms use advanced refinery planning and scheduling optimization tools for better supply chain optimization, enabling a move toward circular refining. This comprehensive process optimization, leveraging better process control systems, is key to boosting energy efficiency and achieving a 10% reduction in operational costs.

We can help! Our analysts can customize this oil refining market research report to meet your requirements.

Get in touch

1. Executive Summary

1.1 Market overview

Executive Summary - Chart on Market Overview
Executive Summary - Data Table on Market Overview
Executive Summary - Chart on Global Market Characteristics
Executive Summary - Chart on Market by Geography
Executive Summary - Chart on Market Segmentation by Product
Executive Summary - Chart on Market Segmentation by Fuel Type
Executive Summary - Chart on Market Segmentation by End-user
Executive Summary - Chart on Market Segmentation by Capacity
Executive Summary - Chart on Incremental Growth
Executive Summary - Data Table on Incremental Growth
Executive Summary - Chart on Company Market Positioning

2. Technavio Analysis

2.1 Analysis of price sensitivity, lifecycle, customer purchase basket, adoption rates, and purchase criteria

2.2 Criticality of inputs and Factors of differentiation

Chart on Overview on criticality of inputs and factors of differentiation

2.3 Factors of disruption

Chart on Overview on factors of disruption

2.4 Impact of drivers and challenges

Chart on Impact of drivers and challenges in 2025 and 2030

3. Market Landscape

3.1 Market ecosystem

Chart on Parent Market
Data Table on - Parent Market

3.2 Market characteristics

Chart on Market characteristics analysis

3.3 Value chain analysis

Chart on Value chain analysis

4. Market Sizing

4.1 Market definition

Data Table on Offerings of companies included in the market definition

4.2 Market segment analysis

Market segments

4.3 Market size 2025

4.4 Market outlook: Forecast for 2025-2030

Chart on Global - Market size and forecast 2025-2030 ($ billion)
Data Table on Global - Market size and forecast 2025-2030 ($ billion)
Chart on Global Market: Year-over-year growth 2025-2030 (%)
Data Table on Global Market: Year-over-year growth 2025-2030 (%)

5. Historic Market Size

5.1 Global Oil Refining Market 2020 - 2024

Historic Market Size - Data Table on Global Oil Refining Market 2020 - 2024 ($ billion)

5.2 Product segment analysis 2020 - 2024

Historic Market Size - Product Segment 2020 - 2024 ($ billion)

5.3 Fuel Type segment analysis 2020 - 2024

Historic Market Size - Fuel Type Segment 2020 - 2024 ($ billion)

5.4 End-user segment analysis 2020 - 2024

Historic Market Size - End-user Segment 2020 - 2024 ($ billion)

5.5 Capacity segment analysis 2020 - 2024

Historic Market Size - Capacity Segment 2020 - 2024 ($ billion)

5.6 Geography segment analysis 2020 - 2024

Historic Market Size - Geography Segment 2020 - 2024 ($ billion)

5.7 Country segment analysis 2020 - 2024

Historic Market Size - Country Segment 2020 - 2024 ($ billion)

6. Qualitative Analysis

6.1 Impact of AI in global oil refining market

6.2 Impact of geopolitical conflict for global oil refining market

7. Five Forces Analysis

7.1 Five forces summary

Five forces analysis - Comparison between 2025 and 2030

7.2 Bargaining power of buyers

Bargaining power of buyers - Impact of key factors 2025 and 2030

7.3 Bargaining power of suppliers

Bargaining power of suppliers - Impact of key factors in 2025 and 2030

7.4 Threat of new entrants

Threat of new entrants - Impact of key factors in 2025 and 2030

7.5 Threat of substitutes

Threat of substitutes - Impact of key factors in 2025 and 2030

7.6 Threat of rivalry

Threat of rivalry - Impact of key factors in 2025 and 2030

7.7 Market condition

Chart on Market condition - Five forces 2025 and 2030

8. Market Segmentation by Product

8.1 Market segments

Chart on Product - Market share 2025-2030 (%)
Data Table on Product - Market share 2025-2030 (%)

8.2 Comparison by Product

Chart on Comparison by Product
Data Table on Comparison by Product

8.3 Light distillates - Market size and forecast 2025-2030

Chart on Light distillates - Market size and forecast 2025-2030 ($ billion)
Data Table on Light distillates - Market size and forecast 2025-2030 ($ billion)
Chart on Light distillates - Year-over-year growth 2025-2030 (%)
Data Table on Light distillates - Year-over-year growth 2025-2030 (%)

8.4 Middle distillates - Market size and forecast 2025-2030

Chart on Middle distillates - Market size and forecast 2025-2030 ($ billion)
Data Table on Middle distillates - Market size and forecast 2025-2030 ($ billion)
Chart on Middle distillates - Year-over-year growth 2025-2030 (%)
Data Table on Middle distillates - Year-over-year growth 2025-2030 (%)

8.5 Fuel oil - Market size and forecast 2025-2030

Chart on Fuel oil - Market size and forecast 2025-2030 ($ billion)
Data Table on Fuel oil - Market size and forecast 2025-2030 ($ billion)
Chart on Fuel oil - Year-over-year growth 2025-2030 (%)
Data Table on Fuel oil - Year-over-year growth 2025-2030 (%)

8.6 Others - Market size and forecast 2025-2030

Chart on Others - Market size and forecast 2025-2030 ($ billion)
Data Table on Others - Market size and forecast 2025-2030 ($ billion)
Chart on Others - Year-over-year growth 2025-2030 (%)
Data Table on Others - Year-over-year growth 2025-2030 (%)

8.7 Market opportunity by Product

Market opportunity by Product ($ billion)
Data Table on Market opportunity by Product ($ billion)

9. Market Segmentation by Fuel Type

9.1 Market segments

Chart on Fuel Type - Market share 2025-2030 (%)
Data Table on Fuel Type - Market share 2025-2030 (%)

9.2 Comparison by Fuel Type

Chart on Comparison by Fuel Type
Data Table on Comparison by Fuel Type

9.3 Gasoline - Market size and forecast 2025-2030

Chart on Gasoline - Market size and forecast 2025-2030 ($ billion)
Data Table on Gasoline - Market size and forecast 2025-2030 ($ billion)
Chart on Gasoline - Year-over-year growth 2025-2030 (%)
Data Table on Gasoline - Year-over-year growth 2025-2030 (%)

9.4 Kerosene - Market size and forecast 2025-2030

Chart on Kerosene - Market size and forecast 2025-2030 ($ billion)
Data Table on Kerosene - Market size and forecast 2025-2030 ($ billion)
Chart on Kerosene - Year-over-year growth 2025-2030 (%)
Data Table on Kerosene - Year-over-year growth 2025-2030 (%)

9.5 LPG - Market size and forecast 2025-2030

Chart on LPG - Market size and forecast 2025-2030 ($ billion)
Data Table on LPG - Market size and forecast 2025-2030 ($ billion)
Chart on LPG - Year-over-year growth 2025-2030 (%)
Data Table on LPG - Year-over-year growth 2025-2030 (%)

9.6 Others - Market size and forecast 2025-2030

Chart on Others - Market size and forecast 2025-2030 ($ billion)
Data Table on Others - Market size and forecast 2025-2030 ($ billion)
Chart on Others - Year-over-year growth 2025-2030 (%)
Data Table on Others - Year-over-year growth 2025-2030 (%)

9.7 Market opportunity by Fuel Type

Market opportunity by Fuel Type ($ billion)
Data Table on Market opportunity by Fuel Type ($ billion)

10. Market Segmentation by End-user

10.1 Market segments

Chart on End-user - Market share 2025-2030 (%)
Data Table on End-user - Market share 2025-2030 (%)

10.2 Comparison by End-user

Chart on Comparison by End-user
Data Table on Comparison by End-user

10.3 Transportation - Market size and forecast 2025-2030

Chart on Transportation - Market size and forecast 2025-2030 ($ billion)
Data Table on Transportation - Market size and forecast 2025-2030 ($ billion)
Chart on Transportation - Year-over-year growth 2025-2030 (%)
Data Table on Transportation - Year-over-year growth 2025-2030 (%)

10.4 Petrochemicals - Market size and forecast 2025-2030

Chart on Petrochemicals - Market size and forecast 2025-2030 ($ billion)
Data Table on Petrochemicals - Market size and forecast 2025-2030 ($ billion)
Chart on Petrochemicals - Year-over-year growth 2025-2030 (%)
Data Table on Petrochemicals - Year-over-year growth 2025-2030 (%)

10.5 Residential and commercial heating - Market size and forecast 2025-2030

Chart on Residential and commercial heating - Market size and forecast 2025-2030 ($ billion)
Data Table on Residential and commercial heating - Market size and forecast 2025-2030 ($ billion)
Chart on Residential and commercial heating - Year-over-year growth 2025-2030 (%)
Data Table on Residential and commercial heating - Year-over-year growth 2025-2030 (%)

10.6 Power generation - Market size and forecast 2025-2030

Chart on Power generation - Market size and forecast 2025-2030 ($ billion)
Data Table on Power generation - Market size and forecast 2025-2030 ($ billion)
Chart on Power generation - Year-over-year growth 2025-2030 (%)
Data Table on Power generation - Year-over-year growth 2025-2030 (%)

10.7 Others - Market size and forecast 2025-2030

Chart on Others - Market size and forecast 2025-2030 ($ billion)
Data Table on Others - Market size and forecast 2025-2030 ($ billion)
Chart on Others - Year-over-year growth 2025-2030 (%)
Data Table on Others - Year-over-year growth 2025-2030 (%)

10.8 Market opportunity by End-user

Market opportunity by End-user ($ billion)
Data Table on Market opportunity by End-user ($ billion)

11. Market Segmentation by Capacity

11.1 Market segments

Chart on Capacity - Market share 2025-2030 (%)
Data Table on Capacity - Market share 2025-2030 (%)

11.2 Comparison by Capacity

Chart on Comparison by Capacity
Data Table on Comparison by Capacity

11.3 Large-scale refineries - Market size and forecast 2025-2030

Chart on Large-scale refineries - Market size and forecast 2025-2030 ($ billion)
Data Table on Large-scale refineries - Market size and forecast 2025-2030 ($ billion)
Chart on Large-scale refineries - Year-over-year growth 2025-2030 (%)
Data Table on Large-scale refineries - Year-over-year growth 2025-2030 (%)

11.4 Medium-scale refineries - Market size and forecast 2025-2030

Chart on Medium-scale refineries - Market size and forecast 2025-2030 ($ billion)
Data Table on Medium-scale refineries - Market size and forecast 2025-2030 ($ billion)
Chart on Medium-scale refineries - Year-over-year growth 2025-2030 (%)
Data Table on Medium-scale refineries - Year-over-year growth 2025-2030 (%)

11.5 Small-scale refineries - Market size and forecast 2025-2030

Chart on Small-scale refineries - Market size and forecast 2025-2030 ($ billion)
Data Table on Small-scale refineries - Market size and forecast 2025-2030 ($ billion)
Chart on Small-scale refineries - Year-over-year growth 2025-2030 (%)
Data Table on Small-scale refineries - Year-over-year growth 2025-2030 (%)

11.6 Market opportunity by Capacity

Market opportunity by Capacity ($ billion)
Data Table on Market opportunity by Capacity ($ billion)

12. Customer Landscape

12.1 Customer landscape overview

Analysis of price sensitivity, lifecycle, customer purchase basket, adoption rates, and purchase criteria

13. Geographic Landscape

13.1 Geographic segmentation

Chart on Market share by geography 2025-2030 (%)
Data Table on Market share by geography 2025-2030 (%)

13.2 Geographic comparison

Chart on Geographic comparison
Data Table on Geographic comparison

13.3 North America - Market size and forecast 2025-2030

Chart on North America - Market size and forecast 2025-2030 ($ billion)
Data Table on North America - Market size and forecast 2025-2030 ($ billion)
Chart on North America - Year-over-year growth 2025-2030 (%)
Data Table on North America - Year-over-year growth 2025-2030 (%)
Chart on Regional Comparison - North America
Data Table on Regional Comparison - North America

13.3.1 US - Market size and forecast 2025-2030

Chart on US - Market size and forecast 2025-2030 ($ billion)
Data Table on US - Market size and forecast 2025-2030 ($ billion)
Chart on US - Year-over-year growth 2025-2030 (%)
Data Table on US - Year-over-year growth 2025-2030 (%)

13.3.2 Canada - Market size and forecast 2025-2030

Chart on Canada - Market size and forecast 2025-2030 ($ billion)
Data Table on Canada - Market size and forecast 2025-2030 ($ billion)
Chart on Canada - Year-over-year growth 2025-2030 (%)
Data Table on Canada - Year-over-year growth 2025-2030 (%)

13.3.3 Mexico - Market size and forecast 2025-2030

Chart on Mexico - Market size and forecast 2025-2030 ($ billion)
Data Table on Mexico - Market size and forecast 2025-2030 ($ billion)
Chart on Mexico - Year-over-year growth 2025-2030 (%)
Data Table on Mexico - Year-over-year growth 2025-2030 (%)

13.4 Europe - Market size and forecast 2025-2030

Chart on Europe - Market size and forecast 2025-2030 ($ billion)
Data Table on Europe - Market size and forecast 2025-2030 ($ billion)
Chart on Europe - Year-over-year growth 2025-2030 (%)
Data Table on Europe - Year-over-year growth 2025-2030 (%)
Chart on Regional Comparison - Europe
Data Table on Regional Comparison - Europe

13.4.1 Russia - Market size and forecast 2025-2030

Chart on Russia - Market size and forecast 2025-2030 ($ billion)
Data Table on Russia - Market size and forecast 2025-2030 ($ billion)
Chart on Russia - Year-over-year growth 2025-2030 (%)
Data Table on Russia - Year-over-year growth 2025-2030 (%)

13.4.2 Germany - Market size and forecast 2025-2030

Chart on Germany - Market size and forecast 2025-2030 ($ billion)
Data Table on Germany - Market size and forecast 2025-2030 ($ billion)
Chart on Germany - Year-over-year growth 2025-2030 (%)
Data Table on Germany - Year-over-year growth 2025-2030 (%)

13.4.3 Italy - Market size and forecast 2025-2030

Chart on Italy - Market size and forecast 2025-2030 ($ billion)
Data Table on Italy - Market size and forecast 2025-2030 ($ billion)
Chart on Italy - Year-over-year growth 2025-2030 (%)
Data Table on Italy - Year-over-year growth 2025-2030 (%)

13.4.4 Spain - Market size and forecast 2025-2030

Chart on Spain - Market size and forecast 2025-2030 ($ billion)
Data Table on Spain - Market size and forecast 2025-2030 ($ billion)
Chart on Spain - Year-over-year growth 2025-2030 (%)
Data Table on Spain - Year-over-year growth 2025-2030 (%)

13.4.5 France - Market size and forecast 2025-2030

Chart on France - Market size and forecast 2025-2030 ($ billion)
Data Table on France - Market size and forecast 2025-2030 ($ billion)
Chart on France - Year-over-year growth 2025-2030 (%)
Data Table on France - Year-over-year growth 2025-2030 (%)

13.4.6 UK - Market size and forecast 2025-2030

Chart on UK - Market size and forecast 2025-2030 ($ billion)
Data Table on UK - Market size and forecast 2025-2030 ($ billion)
Chart on UK - Year-over-year growth 2025-2030 (%)
Data Table on UK - Year-over-year growth 2025-2030 (%)

13.5 APAC - Market size and forecast 2025-2030

Chart on APAC - Market size and forecast 2025-2030 ($ billion)
Data Table on APAC - Market size and forecast 2025-2030 ($ billion)
Chart on APAC - Year-over-year growth 2025-2030 (%)
Data Table on APAC - Year-over-year growth 2025-2030 (%)
Chart on Regional Comparison - APAC
Data Table on Regional Comparison - APAC

13.5.1 China - Market size and forecast 2025-2030

Chart on China - Market size and forecast 2025-2030 ($ billion)
Data Table on China - Market size and forecast 2025-2030 ($ billion)
Chart on China - Year-over-year growth 2025-2030 (%)
Data Table on China - Year-over-year growth 2025-2030 (%)

13.5.2 India - Market size and forecast 2025-2030

Chart on India - Market size and forecast 2025-2030 ($ billion)
Data Table on India - Market size and forecast 2025-2030 ($ billion)
Chart on India - Year-over-year growth 2025-2030 (%)
Data Table on India - Year-over-year growth 2025-2030 (%)

13.5.3 South Korea - Market size and forecast 2025-2030

Chart on South Korea - Market size and forecast 2025-2030 ($ billion)
Data Table on South Korea - Market size and forecast 2025-2030 ($ billion)
Chart on South Korea - Year-over-year growth 2025-2030 (%)
Data Table on South Korea - Year-over-year growth 2025-2030 (%)

13.5.4 Japan - Market size and forecast 2025-2030

Chart on Japan - Market size and forecast 2025-2030 ($ billion)
Data Table on Japan - Market size and forecast 2025-2030 ($ billion)
Chart on Japan - Year-over-year growth 2025-2030 (%)
Data Table on Japan - Year-over-year growth 2025-2030 (%)

13.5.5 Indonesia - Market size and forecast 2025-2030

Chart on Indonesia - Market size and forecast 2025-2030 ($ billion)
Data Table on Indonesia - Market size and forecast 2025-2030 ($ billion)
Chart on Indonesia - Year-over-year growth 2025-2030 (%)
Data Table on Indonesia - Year-over-year growth 2025-2030 (%)

13.5.6 Australia - Market size and forecast 2025-2030

Chart on Australia - Market size and forecast 2025-2030 ($ billion)
Data Table on Australia - Market size and forecast 2025-2030 ($ billion)
Chart on Australia - Year-over-year growth 2025-2030 (%)
Data Table on Australia - Year-over-year growth 2025-2030 (%)

13.6 Middle East and Africa - Market size and forecast 2025-2030

Chart on Middle East and Africa - Market size and forecast 2025-2030 ($ billion)
Data Table on Middle East and Africa - Market size and forecast 2025-2030 ($ billion)
Chart on Middle East and Africa - Year-over-year growth 2025-2030 (%)
Data Table on Middle East and Africa - Year-over-year growth 2025-2030 (%)
Chart on Regional Comparison - Middle East and Africa
Data Table on Regional Comparison - Middle East and Africa

13.6.1 Saudi Arabia - Market size and forecast 2025-2030

Chart on Saudi Arabia - Market size and forecast 2025-2030 ($ billion)
Data Table on Saudi Arabia - Market size and forecast 2025-2030 ($ billion)
Chart on Saudi Arabia - Year-over-year growth 2025-2030 (%)
Data Table on Saudi Arabia - Year-over-year growth 2025-2030 (%)

13.6.2 UAE - Market size and forecast 2025-2030

Chart on UAE - Market size and forecast 2025-2030 ($ billion)
Data Table on UAE - Market size and forecast 2025-2030 ($ billion)
Chart on UAE - Year-over-year growth 2025-2030 (%)
Data Table on UAE - Year-over-year growth 2025-2030 (%)

13.6.3 South Africa - Market size and forecast 2025-2030

Chart on South Africa - Market size and forecast 2025-2030 ($ billion)
Data Table on South Africa - Market size and forecast 2025-2030 ($ billion)
Chart on South Africa - Year-over-year growth 2025-2030 (%)
Data Table on South Africa - Year-over-year growth 2025-2030 (%)

13.6.4 Turkey - Market size and forecast 2025-2030

Chart on Turkey - Market size and forecast 2025-2030 ($ billion)
Data Table on Turkey - Market size and forecast 2025-2030 ($ billion)
Chart on Turkey - Year-over-year growth 2025-2030 (%)
Data Table on Turkey - Year-over-year growth 2025-2030 (%)

13.6.5 Israel - Market size and forecast 2025-2030

Chart on Israel - Market size and forecast 2025-2030 ($ billion)
Data Table on Israel - Market size and forecast 2025-2030 ($ billion)
Chart on Israel - Year-over-year growth 2025-2030 (%)
Data Table on Israel - Year-over-year growth 2025-2030 (%)

13.7 South America - Market size and forecast 2025-2030

Chart on South America - Market size and forecast 2025-2030 ($ billion)
Data Table on South America - Market size and forecast 2025-2030 ($ billion)
Chart on South America - Year-over-year growth 2025-2030 (%)
Data Table on South America - Year-over-year growth 2025-2030 (%)
Chart on Regional Comparison - South America
Data Table on Regional Comparison - South America

13.7.1 Brazil - Market size and forecast 2025-2030

Chart on Brazil - Market size and forecast 2025-2030 ($ billion)
Data Table on Brazil - Market size and forecast 2025-2030 ($ billion)
Chart on Brazil - Year-over-year growth 2025-2030 (%)
Data Table on Brazil - Year-over-year growth 2025-2030 (%)

13.7.2 Argentina - Market size and forecast 2025-2030

Chart on Argentina - Market size and forecast 2025-2030 ($ billion)
Data Table on Argentina - Market size and forecast 2025-2030 ($ billion)
Chart on Argentina - Year-over-year growth 2025-2030 (%)
Data Table on Argentina - Year-over-year growth 2025-2030 (%)

13.7.3 Chile - Market size and forecast 2025-2030

Chart on Chile - Market size and forecast 2025-2030 ($ billion)
Data Table on Chile - Market size and forecast 2025-2030 ($ billion)
Chart on Chile - Year-over-year growth 2025-2030 (%)
Data Table on Chile - Year-over-year growth 2025-2030 (%)

13.8 Market opportunity by geography

Market opportunity by geography ($ billion)
Data Tables on Market opportunity by geography ($ billion)

14. Drivers, Challenges, and Opportunity

14.1 Market drivers

Industrialization of modern mega-refineries and capacity geography shifting
Strategic mainstreaming of chemical integration and product diversification
Structural expansion of environmental compliance and low-emission fuel

14.2 Market challenges

Intensification of geopolitical infrastructure disruptions and export channel
Persistence of stringent environmental mandates and mandatory emissions
Technical friction of workforce scarcity and maintenance skill gaps

14.3 Impact of drivers and challenges

Impact of drivers and challenges in 2025 and 2030

14.4 Market opportunities

Integration of biorefining and sustainable aviation fuel conversions
Growth of petrochemical integration and crude-to-chemicals diversification
Strategic expansion of digital twins and AI-operated process optimization

15. Competitive Landscape

15.1 Overview

15.2

Overview on criticality of inputs and factors of differentiation

15.3 Landscape disruption

Overview on factors of disruption

15.4 Industry risks

Impact of key risks on business

16. Competitive Analysis

16.1 Companies profiled

Companies covered

16.2 Company ranking index

16.3 Market positioning of companies

Matrix on companies position and classification

16.4 Bharat Petroleum Corp. Ltd.

Bharat Petroleum Corp. Ltd. - Overview
Bharat Petroleum Corp. Ltd. - Product / Service
Bharat Petroleum Corp. Ltd. - Key offerings
SWOT

16.5 BP Plc

BP Plc - Overview
BP Plc - Business segments
BP Plc - Key offerings
BP Plc - Segment focus
SWOT

16.6 Chevron Corp.

Chevron Corp. - Overview
Chevron Corp. - Business segments
Chevron Corp. - Key news
Chevron Corp. - Key offerings
Chevron Corp. - Segment focus
SWOT

16.7 China National Petroleum Corp.

China National Petroleum Corp. - Overview
China National Petroleum Corp. - Product / Service
China National Petroleum Corp. - Key offerings
SWOT

16.8 Eni SpA

Eni SpA - Overview
Eni SpA - Business segments
Eni SpA - Key offerings
Eni SpA - Segment focus
SWOT

16.9 Exxon Mobil Corp.

Exxon Mobil Corp. - Overview
Exxon Mobil Corp. - Business segments
Exxon Mobil Corp. - Key news
Exxon Mobil Corp. - Key offerings
Exxon Mobil Corp. - Segment focus
SWOT

16.10 Indian Oil Corp. Ltd.

Indian Oil Corp. Ltd. - Overview
Indian Oil Corp. Ltd. - Business segments
Indian Oil Corp. Ltd. - Key offerings
Indian Oil Corp. Ltd. - Segment focus
SWOT

16.11 Phillips 66 Co.

Phillips 66 Co. - Overview
Phillips 66 Co. - Business segments
Phillips 66 Co. - Key offerings
Phillips 66 Co. - Segment focus
SWOT

16.12 Reliance Industries Ltd.

Reliance Industries Ltd. - Overview
Reliance Industries Ltd. - Business segments
Reliance Industries Ltd. - Key offerings
Reliance Industries Ltd. - Segment focus
SWOT

16.13 Repsol SA

Repsol SA - Overview
Repsol SA - Business segments
Repsol SA - Key offerings
Repsol SA - Segment focus
SWOT

16.14 Saudi Arabian Oil Co.

Saudi Arabian Oil Co. - Overview
Saudi Arabian Oil Co. - Business segments
Saudi Arabian Oil Co. - Key offerings
Saudi Arabian Oil Co. - Segment focus
SWOT

16.15 Shell plc

Shell plc - Overview
Shell plc - Business segments
Shell plc - Key news
Shell plc - Key offerings
Shell plc - Segment focus
SWOT

16.16 Sinopec Shanghai Co. Ltd.

Sinopec Shanghai Co. Ltd. - Overview
Sinopec Shanghai Co. Ltd. - Business segments
Sinopec Shanghai Co. Ltd. - Key offerings
Sinopec Shanghai Co. Ltd. - Segment focus
SWOT

16.17 TotalEnergies SE

TotalEnergies SE - Overview
TotalEnergies SE - Business segments
TotalEnergies SE - Key news
TotalEnergies SE - Key offerings
TotalEnergies SE - Segment focus
SWOT

16.18 Valero Energy Corp.

Valero Energy Corp. - Overview
Valero Energy Corp. - Business segments
Valero Energy Corp. - Key offerings
Valero Energy Corp. - Segment focus
SWOT

17. Appendix

17.1 Scope of the report

Market definition
Objectives
Notes and caveats

17.2 Inclusions and exclusions checklist

Inclusions checklist
Exclusions checklist

17.3 Currency conversion rates for US$

17.4 Research methodology

17.5 Data procurement

Information sources

17.6 Data validation

17.7 Validation techniques employed for market sizing

17.8 Data synthesis

17.9 360 degree market analysis

17.10 List of abbreviations

Research Methodology

Technavio presents a detailed picture of the market by way of study, synthesis, and summation of data from multiple sources. The analysts have presented the various facets of the market with a particular focus on identifying the key industry influencers. The data thus presented is comprehensive, reliable, and the result of extensive research, both primary and secondary.

INFORMATION SOURCES

Primary sources

  • Manufacturers and suppliers
  • Channel partners
  • Industry experts
  • Strategic decision makers

Secondary sources

  • Industry journals and periodicals
  • Government data
  • Financial reports of key industry players
  • Historical data
  • Press releases

DATA ANALYSIS

Data Synthesis

  • Collation of data
  • Estimation of key figures
  • Analysis of derived insights

Data Validation

  • Triangulation with data models
  • Reference against proprietary databases
  • Corroboration with industry experts

REPORT WRITING

Qualitative

  • Market drivers
  • Market challenges
  • Market trends
  • Five forces analysis

Quantitative

  • Market size and forecast
  • Market segmentation
  • Geographical insights
  • Competitive landscape

Interested in this report?

Get your sample now to see our research methodology and insights!

Download Now

Frequently Asked Questions

Oil Refining market growth will increase by USD 112.5 billion during 2026-2030.

The Oil Refining market is expected to grow at a CAGR of 1.3% during 2026-2030.

Oil Refining market is segmented by Product (Light distillates, Middle distillates, Fuel oil, Others) Fuel type (Gasoline, Kerosene, LPG, Others) End-user (Transportation, Petrochemicals, Residential and commercial heating, Power generation, Others) Capacity (Large-scale refineries, Medium-scale refineries, Small-scale refineries)

Bharat Petroleum Corp. Ltd., BP Plc, Chevron Corp., China National Petroleum Corp., Eni SpA, Exxon Mobil Corp., HollyFrontier Corp., Indian Oil Corp. Ltd., Marathon Petroleum Corp., Neste Corp., PBF Energy Inc., Phillips 66 Co., Polski Koncern Naftowy ORLEN SA, Reliance Industries Ltd., Repsol SA, Saudi Arabian Oil Co., Shell plc, Sinopec Shanghai Co. Ltd., TotalEnergies SE, Valero Energy Corp. are a few of the key vendors in the Oil Refining market.

North America will register the highest growth rate of 33.4% among the other regions. Therefore, the Oil Refining market in North America is expected to garner significant business opportunities for the vendors during the forecast period.

US, Canada, Mexico, Russia, Germany, Italy, Spain, France, UK, China, India, South Korea, Japan, Indonesia, Australia, Saudi Arabia, UAE, South Africa, Turkey, Israel, Brazil, Argentina, Chile

  • Industrialization of modern mega-refineries and capacity geography shifting is the driving factor this market.

The Oil Refining market vendors should focus on grabbing business opportunities from the Product segment as it accounted for the largest market share in the base year.
RIA - Research AI Assistant
Ask RIA