
Iraq Oil And Gas Market Size 2025-2029
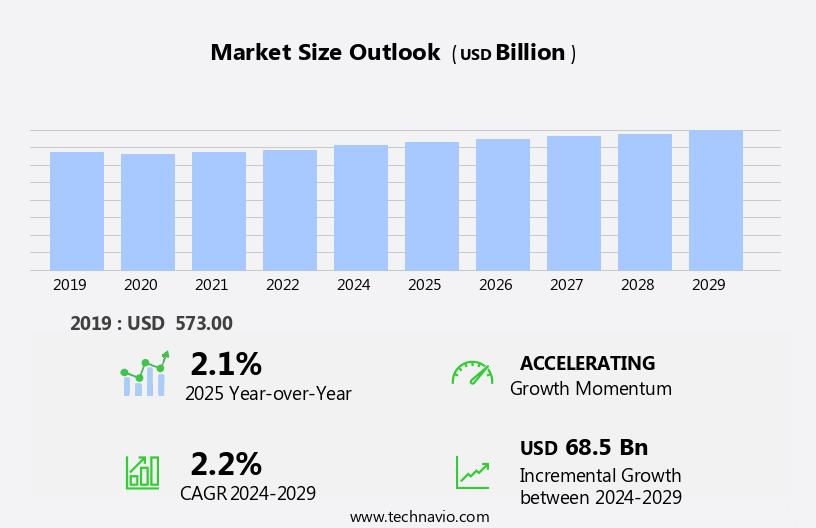
The Iraq oil and gas market size is forecast to increase by USD 68.5 billion, at a CAGR of 2.2% between 2024 and 2029.
- The Oil and Gas Market is witnessing significant developments, driven by the increasing focus on oil production capacity expansion in key regions, such as Iraq. This expansion is attracting substantial investments from foreign players, positioning Iraq as a significant player in the global oil industry. However, this growth trajectory is not without challenges. Political instability and security issues continue to pose risks, leading to supply chain disruptions in the oil and gas sector. These challenges are particularly pertinent for entities involved in upstream operations, including oil and gas exploration and production companies. Furthermore, the liquefied natural gas (LNG) market is experiencing robust growth, driven by the increasing demand for cleaner fuels and the expanding global LNG trade.
- For instance, companies are investing in technologies that reduce carbon emissions and improve operational efficiency. In this context, the adoption of digitalization and automation in oil and gas operations is gaining momentum. Advanced technologies, such as the Internet of Things (IoT), artificial intelligence (AI), and machine learning, are being employed to optimize production processes, enhance safety, and minimize downtime. This trend is creating opportunities for companies involved in LNG production, transportation, and storage. Additionally, the rise of shale gas and tight oil resources is transforming the energy landscape, with entities focusing on resource extraction and monetization strategies. Moreover, the shift towards renewable energy sources and increasing environmental concerns are creating new opportunities and challenges for the Oil and Gas Market.
What will be the size of the Iraq Oil And Gas Market during the forecast period?
Explore in-depth regional segment analysis with market size data - historical 2019-2023 and forecasts 2025-2029 - in the full report.
Request Free Sample
- In the dynamic oil and gas market, various exploration techniques are shaping the industry's future. Oil sands and tight oil resources continue to fuel growth, with oilfield services companies providing essential directional drilling and horizontal drilling solutions. Shale gas and deepwater drilling are also driving production capacity expansion. Production services and completion services are crucial in maximizing output from these complex reservoirs. Offshore drilling and subsea production are further expanding the industry's reach, with drilling services playing a pivotal role in accessing these resources.
- The integration of advanced technologies, such as directional drilling and horizontal drilling, is transforming the industry, enabling efficient extraction from increasingly challenging reservoirs. The Oil and Gas Market is witnessing a complex and dynamic business environment, driven by expansion opportunities in key regions and challenges posed by political instability and security issues. Companies seeking to capitalize on these opportunities and navigate challenges effectively must stay informed about the latest trends and invest in technologies that enhance operational efficiency, reduce emissions, and improve safety.
How is this market segmented?
The market research report provides comprehensive data (region-wise segment analysis), with forecasts and estimates in "USD billion" for the period 2025-2029, as well as historical data from 2019-2023 for the following segments.
- Application
- Industrial
- Commercial
- Residential
- Type
- Upstream
- Downstream
- Midstream
- Deployment
- Offshore
- Onshore
By Application Insights
The industrial segment is estimated to witness significant growth during the forecast period. In the dynamic energy landscape, Iraq's oil and gas sector continues to play a pivotal role in powering the country's economy and meeting its domestic energy demands. Crude oil serves as a vital feedstock in various industries, including petrochemicals, fertilizers, plastics, and pharmaceuticals. The industrial sector's growth relies on oil and gas for manufacturing processes and product development. With urbanization and industrialization progressing, there is a pressing need to expand electricity generation capacity in Iraq. Oil and gas-fired power plants remain essential in meeting this demand, particularly during peak periods. Meanwhile, the oil and gas industry is undergoing significant transformations.
The digital oilfield is revolutionizing the industry, with the Internet of Things, data analytics, and cloud computing enabling real-time monitoring, predictive maintenance, and remote operations. Safety regulations are stringent, prioritizing health and safety in hydrocarbon exploration, production, and transportation. The skills gap in the oil and gas industry is being addressed through training programs and collaborations with educational institutions. The transition to a more sustainable energy future involves the exploration of hydrogen energy as a potential alternative to fossil fuels. As the industry evolves, it continues to adapt to technological advancements and regulatory requirements, ensuring a reliable and efficient energy supply for Iraq and the world.

Get a glance at the market share of various segments Request Free Sample
The Industrial segment was valued at USD 270.30 billion in 2019 and showed a gradual increase during the forecast period.
Renewable energy sources are gaining traction, and Iraq is exploring opportunities in wind, solar, and hydroelectric power. Reservoir engineering and characterization are crucial in maximizing oil and gas recovery, while enhanced techniques like enhanced oil recovery and well stimulation are being employed to optimize production. Gas processing plants are essential in extracting valuable components from natural gas, such as methane and liquefied natural gas (LNG). Machine learning and artificial intelligence are being integrated into reservoir engineering and production optimization to improve efficiency and reduce costs. Gas flaring is a concern, and efforts are being made to minimize emissions and adhere to environmental regulations.
The oil and gas industry faces numerous challenges from geopolitical instability and security threats, which can disrupt the supply chain and impact production and market stability. In Iraq, these issues are particularly pronounced, with regional factors such as political instability and terrorism posing significant risks to infrastructure and investment decisions. Attacks on pipelines, refineries, and transportation routes can lead to production stoppages and delays in delivering crude oil and natural gas to markets, causing supply disruptions and price volatility. Renewable energy sources are gaining traction as a more sustainable alternative, but the oil and gas sector continues to play a crucial role in the global energy mix.
Market Dynamics
Our researchers analyzed the data with 2024 as the base year, along with the key drivers, trends, and challenges. A holistic analysis of drivers will help companies refine their marketing strategies to gain a competitive advantage.
What are the key market drivers leading to the rise in the adoption of Oil And Gas in Iraq Industry?
- The primary factor fueling market growth is Iraq's intensifying efforts to expand its oil production capacity. Iraq is expanding its oil production capacity through the development of new fields and infrastructure upgrades, bolstering its revenue and global market influence. The country's focus on hydrocarbon exploration and reservoir characterization aims to increase production. Iraq's investments in infrastructure, such as pipelines, storage facilities, export terminals, and refineries, enhance crude oil transportation and processing.
- Data analytics plays a crucial role in addressing these challenges by providing insights for efficient operations and improved sustainability. Gas flaring, a significant environmental issue, is also a concern, and efforts are underway to reduce this practice. The market remains dynamic, with ongoing exploration and development activities shaping the industry's future. The Iraqi government prioritizes upstream investments in oil exploration, drilling, and production activities for capacity expansion. However, challenges persist, including the skills gap in the industry and health and safety concerns.
What are the market trends shaping the Oil And Gas in Iraq Industry?
- Foreign investment in Iraq's oil and gas sector is on the rise, representing a significant market trend. This trend reflects the increasing global demand for energy resources and the attractive business opportunities presented by Iraq's vast oil and gas reserves. The oil and gas industry plays a significant role in Iraq's economy, and the country has been attracting foreign investments through collaborations with international oil companies (IOCs). These partnerships contribute technical expertise, capital investment, and knowledge transfer to bolster Iraq's oil and gas infrastructure and optimize production. Seismic surveys and advanced technologies, such as cloud computing, are employed to enhance exploration and production efficiency.
- Production optimization and well stimulation techniques are employed to maximize output and reduce costs. These investments bring about substantial benefits, including job creation, infrastructure development, and increased government revenues. The resulting economic growth can improve living standards for the population and generate foreign exchange earnings through exports. The oil and gas sector's continued evolution is essential for Iraq's sustainable development. Environmental regulations are a crucial consideration in the industry, and companies are investing in sustainable practices to minimize their carbon footprint. Hydrogen energy is also gaining traction as a potential alternative to traditional oil and gas resources.
What challenges does the Oil And Gas in Iraq Industry face during its growth?
- The political instability and security concerns causing supply chain disruptions in the oil and gas industry represent significant challenges to industry growth. These issues can lead to interruptions in the production and distribution of oil and gas, negatively impacting market stability and potentially increasing prices for consumers. Addressing these challenges requires a multifaceted approach, including diplomatic efforts to mitigate political risks and investing in alternative energy sources and supply chain redundancies to ensure continued access to this vital resource.
- Technological advancements, such as reservoir engineering, gas processing plants, and enhanced oil recovery, are helping to improve efficiency and reduce emissions. Machine learning and data analytics are also being employed to optimize operations and reduce methane emissions. Despite these challenges, the oil and gas industry remains a critical contributor to the global economy. Companies are investing in innovative technologies and strategies to mitigate risks and maintain production levels, while also addressing environmental concerns and adapting to the changing energy landscape. The industry's ability to adapt and innovate will be key to its long-term success.
Exclusive Customer Landscape
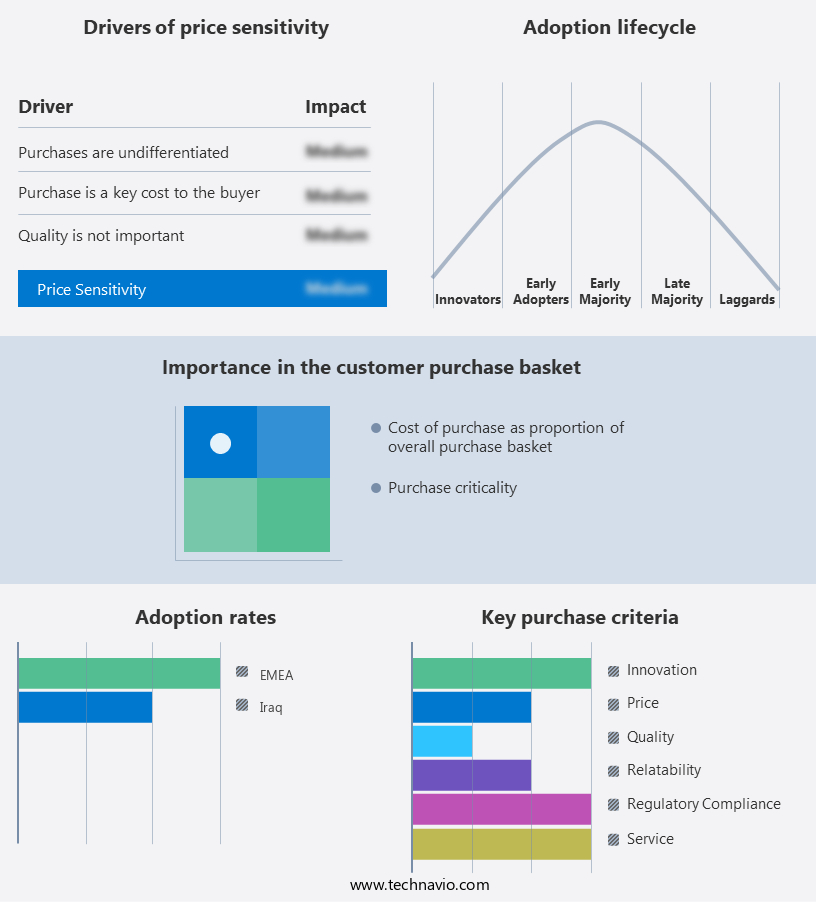
The oil and gas market in Iraq forecasting report includes the adoption lifecycle of the market, covering from the innovator's stage to the laggard's stage. It focuses on adoption rates in different regions based on penetration. Furthermore, the oil and gas market in Iraq report also includes key purchase criteria and drivers of price sensitivity to help companies evaluate and develop their market growth analysis strategies.
Customer Landscape
Key Companies & Market Insights
Companies are implementing various strategies, such as strategic alliances, oil and gas market in Iraq forecast, partnerships, mergers and acquisitions, geographical expansion, and product/service launches, to enhance their presence in the industry.
Abu Dhabi National Energy Co. PJSC - The company specializes in the exploration, production, and distribution of various hydrocarbon resources, encompassing crude oil, natural gas, and liquefied petroleum gas (LPG).
The industry research and growth report includes detailed analyses of the competitive landscape of the market and information about key companies, including:
- Abu Dhabi National Energy Co. PJSC
- Arajeez Co. LLC
- BP Plc
- Caterpillar Inc.
- China National Offshore Oil Corp.
- DNO ASA
- Exxon Mobil Corp.
- Independent Oil Tools Iraq
- KMSK Iraq
- PJSC LUKOIL
- QatarEnergy
- Ronahi Co.
- Shell plc
- SPM Oil and Gas
- Tekkon Petrochemical Services Co. Ltd.
- Wataniya Bitumen and Oil Refinery
Qualitative and quantitative analysis of companies has been conducted to help clients understand the wider business environment as well as the strengths and weaknesses of key industry players. Data is qualitatively analyzed to categorize companies as pure play, category-focused, industry-focused, and diversified; it is quantitatively analyzed to categorize companies as dominant, leading, strong, tentative, and weak.
Recent Development and News in Oil And Gas Market In Iraq
- In February 2023, Shell and BP, two leading oil and gas companies, announced a strategic collaboration to accelerate the net-zero transition in the energy sector. They plan to jointly invest in low-carbon technologies and explore opportunities in renewable energy, hydrogen, and carbon capture and storage (CCS) (Shell, 2023).
- In March 2024, ExxonMobil, the largest oil and gas company by market capitalization, secured a key regulatory approval from the U.S. Department of Energy to construct a major CCS project in Texas. The project, named "Carbon Capture, Utilization, and Storage (CCUS) Hub," is expected to reduce up to 50% of the company's greenhouse gas emissions from its Baytown complex (ExxonMobil, 2024).
- In May 2024, Chevron and Occidental Petroleum formed a joint venture to invest in carbon capture and storage technologies. The partnership aims to develop and commercialize CCS solutions, targeting the reduction of greenhouse gas emissions from the oil and gas industry (Chevron, 2024).
- In January 2025, TotalEnergies, a French multinational integrated oil and gas company, launched its first large-scale offshore wind farm, "Seagrave," in the UK. The project represents a significant expansion into renewable energy for TotalEnergies and is expected to generate 1.4 gigawatts of electricity, enough to power approximately 1.6 million homes (TotalEnergies, 2025).
Research Analyst Overview
The oil and gas market continues to evolve, shaped by various dynamic factors. Seismic surveys play a crucial role in hydrocarbon exploration, providing valuable data for reservoir characterization. Cloud computing and data analytics facilitate the digital oilfield, enhancing production optimization and well stimulation efforts. Environmental regulations are a significant influence, driving the reduction of carbon emissions and methane leakage. Gas flaring, a common practice in the industry, is under scrutiny due to its environmental impact. Safety regulations are another critical aspect, ensuring the health and safety of workers and communities. The ongoing skills gap in the industry is addressed through the adoption of advanced technologies like machine learning and artificial intelligence.
The natural gas sector is experiencing growth, with applications extending beyond traditional uses in power generation and heating. Liquefied natural gas (LNG) is gaining popularity due to its transportability and versatility as a fuel. Petroleum products remain in demand, but their production processes are becoming more energy-efficient. Hydrogen energy is emerging as a potential alternative, offering low-carbon emissions and versatility in various sectors. Well completion and reservoir engineering are ongoing processes, requiring constant optimization to maximize output and minimize costs. Enhanced oil recovery techniques continue to evolve, extending the life of mature fields. The oil and gas market is a complex, ever-changing landscape, requiring continuous adaptation and innovation.
Dive into Technavio's robust research methodology, blending expert interviews, extensive data synthesis, and validated models for unparalleled Oil And Gas Market in Iraq insights. See full methodology.
|
Market Scope |
|
|
Report Coverage |
Details |
|
Page number |
161 |
|
Base year |
2024 |
|
Historic period |
2019-2023 |
|
Forecast period |
2025-2029 |
|
Growth momentum & CAGR |
Accelerate at a CAGR of 2.2% |
|
Market growth 2025-2029 |
USD 68.5 billion |
|
Market structure |
Fragmented |
|
YoY growth 2024-2025(%) |
2.1 |
|
Key countries |
Iraq |
|
Competitive landscape |
Leading Companies, Market Positioning of Companies, Competitive Strategies, and Industry Risks, market research and growth, market growth and forecasting, Market forecasting, market report, market forecast |
What are the Key Data Covered in this Oil And Gas Market in Iraq Research and Growth Report?
- CAGR of the Oil And Gas in Iraq industry during the forecast period
- Detailed information on factors that will drive the growth and forecasting between 2025 and 2029
- Precise estimation of the size of the market and its contribution of the industry in focus to the parent market
- Accurate predictions about upcoming growth and trends and changes in consumer behaviour
- Growth of the market across Iraq
- Thorough analysis of the market's competitive landscape and detailed information about companies
- Comprehensive analysis of factors that will challenge the oil and gas market in Iraq growth of industry companies
We can help! Our analysts can customize this oil and gas market in Iraq research report to meet your requirements.
 RIA -
RIA - 
