Oil And Gas Storage Service Market Analysis, Size, and Forecast 2025-2029: North America (US and Canada), Europe (Russia), Middle East and Africa (Iran, Qatar, and UAE), APAC (China, India, and Singapore), and Rest of World (ROW)

Oil And Gas Storage Service Market Analysis, Size, and Forecast 2025-2029:
North America (US and Canada), Europe (Russia), Middle East and Africa (Iran, Qatar, and UAE), APAC (China, India, and Singapore), and Rest of World (ROW)

Published: May 2025 223 Pages SKU: IRTNTR45426

Market Overview at a Glance

$4.62 B
Market Opportunity
5.6%
CAGR
5.1
YoY growth 2024-2025(%)

Oil And Gas Storage Service Market Size 2025-2029

The oil and gas storage service market size is forecast to increase by USD 4.62 billion, at a CAGR of 5.6% between 2024 and 2029.

  • The market is driven by the increasing global demand for oil and gas, necessitating the expansion of storage capacity to accommodate growing inventories. A notable trend in the market is the adoption of solidification technology for natural gas storage, enabling the efficient and safe storage of large volumes of natural gas. However, the market faces challenges due to the volatility in oil and gas prices, which can impact the profitability of storage projects. Natural gas and crude oil storage systems enable power plants to maintain a steady supply of fuel during peak load periods and unexpected outages. Companies specializing in oil and gas tank storage, LNG storage and regasification, and CNG storage are actively seeking innovative solutions to optimize their operations and mitigate the risks associated with price fluctuations.
  • Additionally, the development of floating storage and regasification units (FSRUs) offers opportunities for expansion into new markets and the provision of flexible storage solutions to meet the evolving energy demands of industries and consumers. In the power sector, oil and gas storage solutions are indispensable for peaking and backup power generation.

What will be the Size of the Oil And Gas Storage Service Market during the forecast period?

Oil And Gas Storage Service Market Size

 Request Free Sample

  • The market encompasses various solutions, including asset management, underground and above-ground storage options, and cryogenic storage. Technology adoption in this sector is on the rise, with digital twins and advanced safety systems, such as pressure relief valves, explosion protection, and flame arrestors, becoming increasingly common. Compliance auditing and environmental permitting are crucial aspects of the market, ensuring adherence to safety performance metrics and environmental performance metrics. Storage capacity planning is essential for operational efficiency, with demand forecasting and vapor pressure control playing significant roles. Cost optimization is a key trend, driving the use of inventory turnover, safety training, and emergency drills.
  • Hazard analysis and gas detection are integral components of safety performance, while rupture disks and salt cavern storage offer enhanced safety and cost benefits. Market players focus on optimization and efficiency, with technology advancements in storage utilization rates and operational efficiency. Regulatory compliance and safety remain top priorities, with ongoing efforts to improve safety performance metrics and environmental performance metrics. 

How is this Oil And Gas Storage Service Industry segmented?

The oil and gas storage service industry research report provides comprehensive data (region-wise segment analysis), with forecasts and estimates in "USD million" for the period 2025-2029, as well as historical data from 2019-2023 for the following segments.

  • Application
    • Power plants
    • Oil refineries
    • Chemical plants
    • LNG storage facilities
  • Service
    • Storage services
    • Ancillary services
  • Type
    • Underground storage
    • Aboveground storage
  • Geography
    • North America
      • US
      • Canada
    • Europe
      • Russia
    • Middle East and Africa
      • Iran
      • Qatar
      • UAE
    • APAC
      • China
      • India
      • Singapore
    • Rest of World (ROW)

By Application Insights

The power plants segment is estimated to witness significant growth during the forecast period. The market encompasses a range of essential solutions for pipeline infrastructure, terminal operations, and power plants. Pipeline infrastructure necessitates tank coatings, temperature monitoring, and leak detection systems to ensure the safe and efficient transportation of oil and natural gas. Terminal operations rely on railcar loading, level monitoring, and inventory management to facilitate the transfer of petroleum products between various modes of transportation. Data security is a growing concern, as digitalization increases the need for robust cybersecurity measures.

These facilities incorporate advanced technologies such as artificial intelligence (AI), big data analytics, and remote monitoring to optimize capacity utilization and improve energy efficiency. Environmental protection is a critical concern in the oil and gas storage industry, with fire suppression systems, vapor recovery systems, and corrosion control measures ensuring safety and minimizing the carbon footprint. Logistics and transportation, including marine loading and third-party logistics, streamline the movement of petroleum products and facilitate just-in-time delivery. Storage tank maintenance, tank cleaning, and risk management practices ensure the longevity and safety of storage facilities. Digital transformation and SCADA systems enable real-time monitoring and control of storage facilities, while contract logistics and lease agreements facilitate flexible storage solutions.

Oil And Gas Storage Service Market Size

Request Free Sample

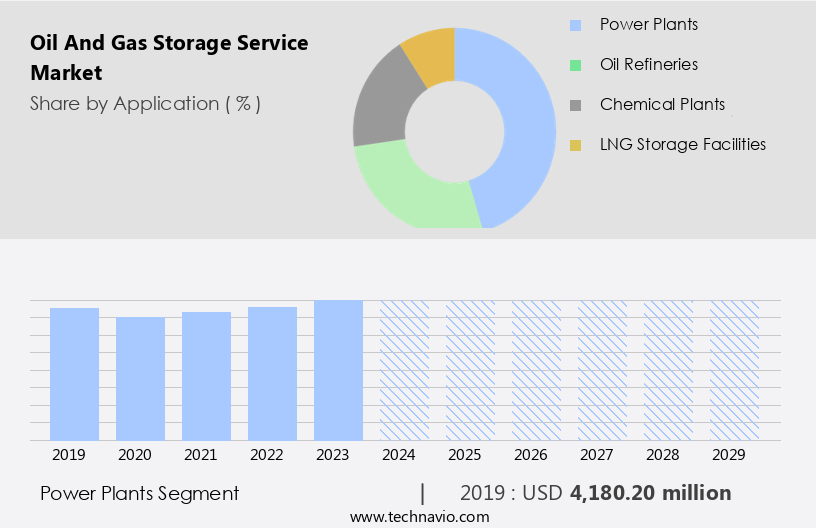
The Power plants segment was valued at USD 4.18 billion in 2019 and showed a gradual increase during the forecast period.

Pressure relief devices and sustainable storage solutions cater to the evolving demand for renewable energy integration and reduced carbon emissions. Innovations in storage tank design, insulation systems, and product blending further enhance the market's growth. Security systems, pricing models, and emergency response plans ensure the safe and efficient operation of oil and gas storage facilities, while tank inspection and access control maintain the highest standards of quality and safety.

The industry is investing in advanced storage technologies, such as underground storage and liquefied natural gas (LNG) storage, to meet the growing demand for cleaner energy sources. The oil and gas storage market is subject to various challenges, primarily driven by crude oil price volatility. However, the industry is adapting to these challenges by implementing advanced technologies, focusing on environmental protection, and optimizing logistics and transportation. The digital transformation, including the adoption of big data analytics and remote monitoring, is also playing a significant role in improving storage efficiency and reducing operational costs.

Regional Analysis

North America is estimated to contribute 29% to the growth of the global market during the forecast period. Technavio's analysts have elaborately explained the regional trends and drivers that shape the market during the forecast period.

Oil And Gas Storage Service Market Share by Geography

Download Free Sample Report

The North American oil and gas storage market is experiencing significant growth due to the region's status as a leading producer and consumer of petroleum products. With the largest oil and gas storage capacity in the world, the US and Canada are at the forefront of this market. Increasing petroleum consumption, driven by production output growth from unconventional methods like shale drilling in the US and oil sands in Canada, necessitates storage expansion. This expansion creates demand for various services, including terminal operations, tank coatings, temperature monitoring, product traceability, fire suppression systems, railcar loading, level monitoring, artificial intelligence, inventory management, vapor recovery systems, third-party logistics, storage tank maintenance, energy efficiency, crude oil storage, environmental protection, marine loading, storage agreements, tank farms, leak detection systems, refining, natural gas storage, logistics and transportation, remote monitoring, big data analytics, capacity utilization, storage tank design, digital transformation, SCADA systems, corrosion control, process control systems, tank cleaning, risk management, contract logistics, insulation systems, product blending, security systems, lease agreements, pricing models, tank inspection, emergency response plans, carbon footprint reduction, storage optimization, petroleum product storage, pressure relief devices, sustainable storage solutions, construction materials, sampling and analysis, quality control, access control, tank refurbishment, automated tank gauging, renewable energy integration, and storage capacity, data acquisition systems.

These services are essential for ensuring efficient, secure, and environmentally friendly oil and gas storage and transportation. The integration of advanced technologies, such as artificial intelligence, big data analytics, and remote monitoring, is driving digital transformation in the market. Additionally, the focus on energy efficiency, environmental protection, and sustainable storage solutions is becoming increasingly important as concerns over carbon footprint reduction and risk management grow. The oil and gas storage market in North America is expected to continue growing during the forecast period, providing opportunities for companies offering innovative and efficient storage solutions.

Market Dynamics

Our researchers analyzed the data with 2024 as the base year, along with the key drivers, trends, and challenges. A holistic analysis of drivers will help companies refine their marketing strategies to gain a competitive advantage.

What are the Oil And Gas Storage Service market drivers leading to the rise in the adoption of Industry?

  • The market is primarily driven by the increasing demand for these resources on a global scale. The global demand for energy, driven by urbanization and industrialization in developing countries, has significantly increased the consumption of petroleum products and natural gas. According to The World Bank Group, the urban population in China grew by 6.25% in 2023, leading to a rise in energy demand. The US Energy Information Administration (EIA) reports that global liquid fuel consumption reached 1.6 million barrels per day (mbpd) in 2023 and is projected to reach 1.7 mbpd in 2024. This growing demand for fossil fuels, particularly in transportation, is driving the need for comprehensive oil and gas storage services.
  • These services encompass various aspects such as pressure relief devices, sustainable storage solutions, construction materials, sampling and analysis, quality control, access control, tank refurbishment, automated tank gauging, renewable energy integration, and data acquisition systems. Pressure relief devices ensure safety, while sustainable storage solutions minimize environmental impact. Construction materials provide durability, and sampling and analysis ensure product quality. Access control and tank refurbishment maintain security and extend storage life, while automated tank gauging and data acquisition systems optimize operations and enhance efficiency. Renewable energy integration facilitates the transition to cleaner energy sources. The market is expected to grow as the world continues to urbanize and the demand for energy increases.

What are the Oil And Gas Storage Service market trends shaping the Industry?

  • The emergence of solidification technology represents a significant market trend in the natural gas storage industry. This innovative technology enables the conversion of natural gas into a solid state for efficient and safe storage solutions. Natural gas storage services play a crucial role in the energy sector by ensuring a stable supply of this essential fuel. The primary methods of natural gas storage include underground facilities, such as depleted aquifers, salt caverns, and oil or gas fields, and aboveground facilities, where gas is stored in its gaseous or liquefied form. In underground facilities, natural gas is stored under pressure, while aboveground facilities employ various technologies, such as temperature monitoring, product traceability, and inventory management, to maintain optimal storage conditions. Pipeline infrastructure is integral to the natural gas storage value chain, as it facilitates the transportation of natural gas to and from storage facilities.
  • Terminal operations, including railcar loading and vapor recovery systems, are essential components of aboveground storage facilities. To ensure safety and efficiency, these facilities incorporate advanced technologies like fire suppression systems, tank coatings, and artificial intelligence (AI) for predictive maintenance. Energy efficiency is a significant concern in natural gas storage, and various measures are being taken to minimize energy consumption. For instance, vapor recovery systems are used to capture and reuse the natural gas that would otherwise be vented during tank loading and unloading. Third-party logistics (3PL) providers offer specialized services to manage the complexities of natural gas storage and transportation.

How does Oil and Gas Storage Service market face challenges during its growth?

  • The volatility in oil and gas prices poses a significant challenge to the industry's growth trajectory, requiring continuous adaptation and risk management strategies to mitigate the financial impact on operations. The oil and gas storage market faces significant challenges due to the volatile nature of crude oil prices. Price uncertainty can negatively impact new exploration and production investments, refinery expansions, and contract prices, ultimately affecting the demand for oil and gas storage services. Over the last decade, crude oil prices have displayed an inconsistent trend, with periods of low prices leading to the cancellation or delay of oil and gas projects. Between 2023 and 2024, crude oil prices continued to exhibit considerable volatility, influenced by supply dynamics, geopolitical tensions, and evolving demand patterns. To mitigate these challenges, the oil and gas storage industry is focusing on various strategies.
  • These include environmental protection measures, advanced storage tank designs, digital transformation, and logistics and transportation optimization. For instance, the implementation of leak detection systems and SCADA systems ensures efficient and safe storage operations. Additionally, big data analytics and remote monitoring enable better capacity utilization and improved maintenance scheduling. Marine loading facilities also play a crucial role in ensuring efficient logistics and transportation. Natural gas storage is another critical aspect of the oil and gas storage market. With the increasing focus on reducing greenhouse gas emissions, natural gas storage is becoming an essential component of the energy transition.

Exclusive Customer Landscape

The oil and gas storage service market forecasting report includes the adoption lifecycle of the market, covering from the innovator's stage to the laggard's stage. It focuses on adoption rates in different regions based on penetration. Furthermore, the oil and gas storage service market report also includes key purchase criteria and drivers of price sensitivity to help companies evaluate and develop their market growth analysis strategies.

Oil And Gas Storage Service Market Share by Geography

 Customer Landscape

Key Companies & Market Insights

Companies are implementing various strategies, such as strategic alliances, oil and gas storage service market forecast, partnerships, mergers and acquisitions, geographical expansion, and product/service launches, to enhance their presence in the industry.

Brooge Energy Ltd. - The company specializes in providing comprehensive oil and gas storage solutions through the operation of sophisticated bulk liquid storage facilities, featuring 14 strategically placed tanks.

The industry research and growth report includes detailed analyses of the competitive landscape of the market and information about key companies, including:

  • Brooge Energy Ltd.
  • Buckeye Partners LP
  • Burns and McDonnell
  • Compagnie Industrielle Maritime
  • Emirates National Oil Co. Ltd. LLC.
  • Enbridge Inc.
  • Energy Transfer LP
  • Exolum Corp. S.A.
  • Fluor Corp.
  • IMTT
  • Kinder Morgan Inc.
  • Koninklijke Vopak NV
  • LBC Tank Terminals
  • Marquard and Bahls AG
  • McDermott International Ltd.
  • NOV Inc.
  • NuStar Energy L.P.
  • Odfjell SE
  • ONEOK Inc.
  • Plains All American Pipeline

Qualitative and quantitative analysis of companies has been conducted to help clients understand the wider business environment as well as the strengths and weaknesses of key industry players. Data is qualitatively analyzed to categorize companies as pure play, category-focused, industry-focused, and diversified; it is quantitatively analyzed to categorize companies as dominant, leading, strong, tentative, and weak.

Recent Development and News in Oil And Gas Storage Service Market

  • In February 2023, Shell and Qatar Petroleum announced a strategic collaboration to develop the Salalah LNG Expansion Project in Oman, which includes the construction of a new LNG storage facility with a capacity of 1.2 million cubic meters. This partnership marks a significant expansion for both companies in the LNG storage sector.
  • In August 2024, Plains All American Pipeline completed the acquisition of Magellan Midstream Partners' 50% stake in the West Texas LPG Export Terminal in Corpus Christi, Texas. This acquisition strengthened Plains All American Pipeline's position in the growing U.S. LPG export market and expanded its storage capacity.
  • In November 2024, Eni and Saipem successfully demonstrated the world's first floating storage and regasification unit (FSRU) powered by renewable energy. This technological advancement represents a crucial step towards decarbonizing the oil and gas storage industry.
  • In January 2025, India's Oil and Natural Gas Corporation (ONGC) signed a Memorandum of Understanding with Woodside Energy to explore opportunities for collaboration in the oil and gas storage sector. This agreement marks ONGC's entry into the international market and opens up opportunities for strategic partnerships and knowledge sharing.

Research Analyst Overview

The market is characterized by its continuous evolution and dynamic nature, with various sectors integrating advanced technologies and solutions to optimize operations and enhance efficiency. Pipeline infrastructure and terminal operations are at the core of this industry, with tank coatings and temperature monitoring ensuring the protection and preservation of stored products. Product traceability and fire suppression systems are crucial components in maintaining safety and regulatory compliance. Railcar loading and level monitoring enable seamless logistics and transportation, while artificial intelligence (AI) and inventory management systems facilitate data-driven decision-making and capacity utilization. Vapor recovery systems contribute to environmental protection and energy efficiency, making them essential in the petroleum product storage sector.

Third-party logistics (3PL) and storage tank maintenance services ensure optimal performance and reduce operational risks. Digital transformation, including SCADA systems, big data analytics, and remote monitoring, is revolutionizing the industry by enabling real-time insights and predictive maintenance. Corrosion control, process control systems, tank cleaning, and risk management are essential components of storage tank design and operations. Contract logistics, insulation systems, product blending, and security systems are integral to the effective management of storage facilities. Lease agreements, pricing models, tank inspection, emergency response plans, carbon footprint reduction, and storage optimization are ongoing concerns for market participants. The integration of renewable energy sources and sustainable storage solutions is a growing trend, reflecting the industry's commitment to reducing its environmental impact.

Construction materials, sampling and analysis, quality control, access control, tank refurbishment, automated tank gauging, and renewable energy integration are all critical aspects of the market, demonstrating its ongoing dynamism. The integration of advanced technologies such as automation, IoT, and predictive analytics can enhance operational efficiency and improve the overall competitiveness of these companies in the market.

Dive into Technavio's strong research methodology, blending expert interviews, extensive data synthesis, and validated models for unparalleled Oil And Gas Storage Service Market insights. See full methodology.

Market Scope

Report Coverage

Details

Page number

223

Base year

2024

Historic period

2019-2023

Forecast period

2025-2029

Growth momentum & CAGR

Accelerate at a CAGR of 5.6%

Market growth 2025-2029

USD 4.62 billion

Market structure

Fragmented

YoY growth 2024-2025(%)

5.1

Key countries

US, China, Saudi Arabia, Canada, UAE, Iran, Singapore, India, Qatar, and Russia

Competitive landscape

Leading Companies, Market Positioning of Companies, Competitive Strategies, and Industry Risks

Request Free Sample

What are the Key Data Covered in this Oil And Gas Storage Service Market Research and Growth Report?

  • CAGR of the Oil And Gas Storage Service industry during the forecast period
  • Detailed information on factors that will drive the growth and forecasting between 2025 and 2029
  • Precise estimation of the size of the market and its contribution of the industry in focus to the parent market
  • Accurate predictions about upcoming growth and trends and changes in consumer behaviour
  • Growth of the market across North America, Middle East and Africa, APAC, Europe, and South America
  • Thorough analysis of the market's competitive landscape and detailed information about companies
  • Comprehensive analysis of factors that will challenge the oil and gas storage service market growth of industry companies

We can help! Our analysts can customize this oil and gas storage service market research report to meet your requirements.

Get in touch

1 Executive Summary

  • 1.1 Market overview
    • Executive Summary - Chart on Market Overview
    • Executive Summary - Data Table on Market Overview
    • Executive Summary - Chart on Global Market Characteristics
    • Executive Summary - Chart on Market by Geography
    • Executive Summary - Chart on Market Segmentation by Application
    • Executive Summary - Chart on Market Segmentation by Service
    • Executive Summary - Chart on Market Segmentation by Type
    • Executive Summary - Chart on Incremental Growth
    • Executive Summary - Data Table on Incremental Growth
    • Executive Summary - Chart on Company Market Positioning

2 Technavio Analysis

  • 2.1 Analysis of price sensitivity, lifecycle, customer purchase basket, adoption rates, and purchase criteria
    • Analysis of price sensitivity, lifecycle, customer purchase basket, adoption rates, and purchase criteria
  • 2.2 Criticality of inputs and Factors of differentiation
    • Overview on criticality of inputs and factors of differentiation
  • 2.3 Factors of disruption
    • Overview on factors of disruption
  • 2.4 Impact of drivers and challenges
    • Impact of drivers and challenges in 2024 and 2029

3 Market Landscape

  • 3.1 Market ecosystem
    • Parent Market
    • Data Table on - Parent Market
  • 3.2 Market characteristics
    • Market characteristics analysis
  • 3.3 Value chain analysis
    • Value chain analysis

4 Market Sizing

  • 4.1 Market definition
    • Offerings of companies included in the market definition
  • 4.2 Market segment analysis
    • Market segments
  • 4.3 Market size 2024
    • 4.4 Market outlook: Forecast for 2024-2029
      • Chart on Global - Market size and forecast 2024-2029 ($ million)
      • Data Table on Global - Market size and forecast 2024-2029 ($ million)
      • Chart on Global Market: Year-over-year growth 2024-2029 (%)
      • Data Table on Global Market: Year-over-year growth 2024-2029 (%)

    5 Historic Market Size

    • 5.1 Global Oil And Gas Storage Service Market 2019 - 2023
      • Historic Market Size - Data Table on Global Oil And Gas Storage Service Market 2019 - 2023 ($ million)
    • 5.2 Application segment analysis 2019 - 2023
      • Historic Market Size - Application Segment 2019 - 2023 ($ million)
    • 5.3 Service segment analysis 2019 - 2023
      • Historic Market Size - Service Segment 2019 - 2023 ($ million)
    • 5.4 Type segment analysis 2019 - 2023
      • Historic Market Size - Type Segment 2019 - 2023 ($ million)
    • 5.5 Geography segment analysis 2019 - 2023
      • Historic Market Size - Geography Segment 2019 - 2023 ($ million)
    • 5.6 Country segment analysis 2019 - 2023
      • Historic Market Size - Country Segment 2019 - 2023 ($ million)

    6 Qualitative Analysis

    • 6.1 Impact of AI in the Global Oil and Gas Storage Service Market

      7 Five Forces Analysis

      • 7.1 Five forces summary
        • Five forces analysis - Comparison between 2024 and 2029
      • 7.2 Bargaining power of buyers
        • Bargaining power of buyers - Impact of key factors 2024 and 2029
      • 7.3 Bargaining power of suppliers
        • Bargaining power of suppliers - Impact of key factors in 2024 and 2029
      • 7.4 Threat of new entrants
        • Threat of new entrants - Impact of key factors in 2024 and 2029
      • 7.5 Threat of substitutes
        • Threat of substitutes - Impact of key factors in 2024 and 2029
      • 7.6 Threat of rivalry
        • Threat of rivalry - Impact of key factors in 2024 and 2029
      • 7.7 Market condition
        • Chart on Market condition - Five forces 2024 and 2029

      8 Market Segmentation by Application

      • 8.1 Market segments
        • Chart on Application - Market share 2024-2029 (%)
        • Data Table on Application - Market share 2024-2029 (%)
      • 8.2 Comparison by Application
        • Chart on Comparison by Application
        • Data Table on Comparison by Application
      • 8.3 Power plants - Market size and forecast 2024-2029
        • Chart on Power plants - Market size and forecast 2024-2029 ($ million)
        • Data Table on Power plants - Market size and forecast 2024-2029 ($ million)
        • Chart on Power plants - Year-over-year growth 2024-2029 (%)
        • Data Table on Power plants - Year-over-year growth 2024-2029 (%)
      • 8.4 Oil refineries - Market size and forecast 2024-2029
        • Chart on Oil refineries - Market size and forecast 2024-2029 ($ million)
        • Data Table on Oil refineries - Market size and forecast 2024-2029 ($ million)
        • Chart on Oil refineries - Year-over-year growth 2024-2029 (%)
        • Data Table on Oil refineries - Year-over-year growth 2024-2029 (%)
      • 8.5 Chemical plants - Market size and forecast 2024-2029
        • Chart on Chemical plants - Market size and forecast 2024-2029 ($ million)
        • Data Table on Chemical plants - Market size and forecast 2024-2029 ($ million)
        • Chart on Chemical plants - Year-over-year growth 2024-2029 (%)
        • Data Table on Chemical plants - Year-over-year growth 2024-2029 (%)
      • 8.6 LNG storage facilities - Market size and forecast 2024-2029
        • Chart on LNG storage facilities - Market size and forecast 2024-2029 ($ million)
        • Data Table on LNG storage facilities - Market size and forecast 2024-2029 ($ million)
        • Chart on LNG storage facilities - Year-over-year growth 2024-2029 (%)
        • Data Table on LNG storage facilities - Year-over-year growth 2024-2029 (%)
      • 8.7 Market opportunity by Application
        • Market opportunity by Application ($ million)
        • Data Table on Market opportunity by Application ($ million)

      9 Market Segmentation by Service

      • 9.1 Market segments
        • Chart on Service - Market share 2024-2029 (%)
        • Data Table on Service - Market share 2024-2029 (%)
      • 9.2 Comparison by Service
        • Chart on Comparison by Service
        • Data Table on Comparison by Service
      • 9.3 Storage services - Market size and forecast 2024-2029
        • Chart on Storage services - Market size and forecast 2024-2029 ($ million)
        • Data Table on Storage services - Market size and forecast 2024-2029 ($ million)
        • Chart on Storage services - Year-over-year growth 2024-2029 (%)
        • Data Table on Storage services - Year-over-year growth 2024-2029 (%)
      • 9.4 Ancillary services - Market size and forecast 2024-2029
        • Chart on Ancillary services - Market size and forecast 2024-2029 ($ million)
        • Data Table on Ancillary services - Market size and forecast 2024-2029 ($ million)
        • Chart on Ancillary services - Year-over-year growth 2024-2029 (%)
        • Data Table on Ancillary services - Year-over-year growth 2024-2029 (%)
      • 9.5 Market opportunity by Service
        • Market opportunity by Service ($ million)
        • Data Table on Market opportunity by Service ($ million)

      10 Market Segmentation by Type

      • 10.1 Market segments
        • Chart on Type - Market share 2024-2029 (%)
        • Data Table on Type - Market share 2024-2029 (%)
      • 10.2 Comparison by Type
        • Chart on Comparison by Type
        • Data Table on Comparison by Type
      • 10.3 Underground storage - Market size and forecast 2024-2029
        • Chart on Underground storage - Market size and forecast 2024-2029 ($ million)
        • Data Table on Underground storage - Market size and forecast 2024-2029 ($ million)
        • Chart on Underground storage - Year-over-year growth 2024-2029 (%)
        • Data Table on Underground storage - Year-over-year growth 2024-2029 (%)
      • 10.4 Aboveground storage - Market size and forecast 2024-2029
        • Chart on Aboveground storage - Market size and forecast 2024-2029 ($ million)
        • Data Table on Aboveground storage - Market size and forecast 2024-2029 ($ million)
        • Chart on Aboveground storage - Year-over-year growth 2024-2029 (%)
        • Data Table on Aboveground storage - Year-over-year growth 2024-2029 (%)
      • 10.5 Market opportunity by Type
        • Market opportunity by Type ($ million)
        • Data Table on Market opportunity by Type ($ million)

      11 Customer Landscape

      • 11.1 Customer landscape overview
        • Analysis of price sensitivity, lifecycle, customer purchase basket, adoption rates, and purchase criteria

      12 Geographic Landscape

      • 12.1 Geographic segmentation
        • Chart on Market share by geography 2024-2029 (%)
        • Data Table on Market share by geography 2024-2029 (%)
      • 12.2 Geographic comparison
        • Chart on Geographic comparison
        • Data Table on Geographic comparison
      • 12.3 North America - Market size and forecast 2024-2029
        • Chart on North America - Market size and forecast 2024-2029 ($ million)
        • Data Table on North America - Market size and forecast 2024-2029 ($ million)
        • Chart on North America - Year-over-year growth 2024-2029 (%)
        • Data Table on North America - Year-over-year growth 2024-2029 (%)
      • 12.4 Middle East and Africa - Market size and forecast 2024-2029
        • Chart on Middle East and Africa - Market size and forecast 2024-2029 ($ million)
        • Data Table on Middle East and Africa - Market size and forecast 2024-2029 ($ million)
        • Chart on Middle East and Africa - Year-over-year growth 2024-2029 (%)
        • Data Table on Middle East and Africa - Year-over-year growth 2024-2029 (%)
      • 12.5 APAC - Market size and forecast 2024-2029
        • Chart on APAC - Market size and forecast 2024-2029 ($ million)
        • Data Table on APAC - Market size and forecast 2024-2029 ($ million)
        • Chart on APAC - Year-over-year growth 2024-2029 (%)
        • Data Table on APAC - Year-over-year growth 2024-2029 (%)
      • 12.6 Europe - Market size and forecast 2024-2029
        • Chart on Europe - Market size and forecast 2024-2029 ($ million)
        • Data Table on Europe - Market size and forecast 2024-2029 ($ million)
        • Chart on Europe - Year-over-year growth 2024-2029 (%)
        • Data Table on Europe - Year-over-year growth 2024-2029 (%)
      • 12.7 South America - Market size and forecast 2024-2029
        • Chart on South America - Market size and forecast 2024-2029 ($ million)
        • Data Table on South America - Market size and forecast 2024-2029 ($ million)
        • Chart on South America - Year-over-year growth 2024-2029 (%)
        • Data Table on South America - Year-over-year growth 2024-2029 (%)
      • 12.8 US - Market size and forecast 2024-2029
        • Chart on US - Market size and forecast 2024-2029 ($ million)
        • Data Table on US - Market size and forecast 2024-2029 ($ million)
        • Chart on US - Year-over-year growth 2024-2029 (%)
        • Data Table on US - Year-over-year growth 2024-2029 (%)
      • 12.9 China - Market size and forecast 2024-2029
        • Chart on China - Market size and forecast 2024-2029 ($ million)
        • Data Table on China - Market size and forecast 2024-2029 ($ million)
        • Chart on China - Year-over-year growth 2024-2029 (%)
        • Data Table on China - Year-over-year growth 2024-2029 (%)
      • 12.10 Saudi Arabia - Market size and forecast 2024-2029
        • Chart on Saudi Arabia - Market size and forecast 2024-2029 ($ million)
        • Data Table on Saudi Arabia - Market size and forecast 2024-2029 ($ million)
        • Chart on Saudi Arabia - Year-over-year growth 2024-2029 (%)
        • Data Table on Saudi Arabia - Year-over-year growth 2024-2029 (%)
      • 12.11 UAE - Market size and forecast 2024-2029
        • Chart on UAE - Market size and forecast 2024-2029 ($ million)
        • Data Table on UAE - Market size and forecast 2024-2029 ($ million)
        • Chart on UAE - Year-over-year growth 2024-2029 (%)
        • Data Table on UAE - Year-over-year growth 2024-2029 (%)
      • 12.12 Canada - Market size and forecast 2024-2029
        • Chart on Canada - Market size and forecast 2024-2029 ($ million)
        • Data Table on Canada - Market size and forecast 2024-2029 ($ million)
        • Chart on Canada - Year-over-year growth 2024-2029 (%)
        • Data Table on Canada - Year-over-year growth 2024-2029 (%)
      • 12.13 Iran - Market size and forecast 2024-2029
        • Chart on Iran - Market size and forecast 2024-2029 ($ million)
        • Data Table on Iran - Market size and forecast 2024-2029 ($ million)
        • Chart on Iran - Year-over-year growth 2024-2029 (%)
        • Data Table on Iran - Year-over-year growth 2024-2029 (%)
      • 12.14 Singapore - Market size and forecast 2024-2029
        • Chart on Singapore - Market size and forecast 2024-2029 ($ million)
        • Data Table on Singapore - Market size and forecast 2024-2029 ($ million)
        • Chart on Singapore - Year-over-year growth 2024-2029 (%)
        • Data Table on Singapore - Year-over-year growth 2024-2029 (%)
      • 12.15 India - Market size and forecast 2024-2029
        • Chart on India - Market size and forecast 2024-2029 ($ million)
        • Data Table on India - Market size and forecast 2024-2029 ($ million)
        • Chart on India - Year-over-year growth 2024-2029 (%)
        • Data Table on India - Year-over-year growth 2024-2029 (%)
      • 12.16 Qatar - Market size and forecast 2024-2029
        • Chart on Qatar - Market size and forecast 2024-2029 ($ million)
        • Data Table on Qatar - Market size and forecast 2024-2029 ($ million)
        • Chart on Qatar - Year-over-year growth 2024-2029 (%)
        • Data Table on Qatar - Year-over-year growth 2024-2029 (%)
      • 12.17 Russia - Market size and forecast 2024-2029
        • Chart on Russia - Market size and forecast 2024-2029 ($ million)
        • Data Table on Russia - Market size and forecast 2024-2029 ($ million)
        • Chart on Russia - Year-over-year growth 2024-2029 (%)
        • Data Table on Russia - Year-over-year growth 2024-2029 (%)
      • 12.18 Market opportunity by geography
        • Market opportunity by geography ($ million)
        • Data Tables on Market opportunity by geography ($ million)

      13 Drivers, Challenges, and Opportunity/Restraints

      • 13.1 Market drivers
        • 13.2 Market challenges
          • 13.3 Impact of drivers and challenges
            • Impact of drivers and challenges in 2024 and 2029
          • 13.4 Market opportunities/restraints

            14 Competitive Landscape

            • 14.1 Overview
              • 14.2 Competitive Landscape
                • Overview on criticality of inputs and factors of differentiation
              • 14.3 Landscape disruption
                • Overview on factors of disruption
              • 14.4 Industry risks
                • Impact of key risks on business

              15 Competitive Analysis

              • 15.1 Companies profiled
                • Companies covered
              • 15.2 Company ranking index
                • Company ranking index
              • 15.3 Market positioning of companies
                • Matrix on companies position and classification
              • 15.4 Brooge Energy Ltd.
                • Brooge Energy Ltd. - Overview
                • Brooge Energy Ltd. - Product / Service
                • Brooge Energy Ltd. - Key offerings
                • SWOT
              • 15.5 Buckeye Partners LP
                • Buckeye Partners LP - Overview
                • Buckeye Partners LP - Product / Service
                • Buckeye Partners LP - Key offerings
                • SWOT
              • 15.6 Compagnie Industrielle Maritime
                • Compagnie Industrielle Maritime - Overview
                • Compagnie Industrielle Maritime - Product / Service
                • Compagnie Industrielle Maritime - Key offerings
                • SWOT
              • 15.7 Enbridge Inc.
                • Enbridge Inc. - Overview
                • Enbridge Inc. - Business segments
                • Enbridge Inc. - Key news
                • Enbridge Inc. - Key offerings
                • Enbridge Inc. - Segment focus
                • SWOT
              • 15.8 Energy Transfer LP
                • Energy Transfer LP - Overview
                • Energy Transfer LP - Product / Service
                • Energy Transfer LP - Key news
                • Energy Transfer LP - Key offerings
                • SWOT
              • 15.9 Exolum Corp. S.A.
                • Exolum Corp. S.A. - Overview
                • Exolum Corp. S.A. - Product / Service
                • Exolum Corp. S.A. - Key offerings
                • SWOT
              • 15.10 Fluor Corp.
                • Fluor Corp. - Overview
                • Fluor Corp. - Business segments
                • Fluor Corp. - Key news
                • Fluor Corp. - Key offerings
                • Fluor Corp. - Segment focus
                • SWOT
              • 15.11 Kinder Morgan Inc.
                • Kinder Morgan Inc. - Overview
                • Kinder Morgan Inc. - Business segments
                • Kinder Morgan Inc. - Key news
                • Kinder Morgan Inc. - Key offerings
                • Kinder Morgan Inc. - Segment focus
                • SWOT
              • 15.12 Koninklijke Vopak NV
                • Koninklijke Vopak NV - Overview
                • Koninklijke Vopak NV - Business segments
                • Koninklijke Vopak NV - Key news
                • Koninklijke Vopak NV - Key offerings
                • Koninklijke Vopak NV - Segment focus
                • SWOT
              • 15.13 Marquard and Bahls AG
                • Marquard and Bahls AG - Overview
                • Marquard and Bahls AG - Product / Service
                • Marquard and Bahls AG - Key offerings
                • SWOT
              • 15.14 McDermott International Ltd.
                • McDermott International Ltd. - Overview
                • McDermott International Ltd. - Product / Service
                • McDermott International Ltd. - Key offerings
                • SWOT
              • 15.15 NOV Inc.
                • NOV Inc. - Overview
                • NOV Inc. - Business segments
                • NOV Inc. - Key news
                • NOV Inc. - Key offerings
                • NOV Inc. - Segment focus
                • SWOT
              • 15.16 Odfjell SE
                • Odfjell SE - Overview
                • Odfjell SE - Product / Service
                • Odfjell SE - Key news
                • Odfjell SE - Key offerings
                • SWOT
              • 15.17 ONEOK Inc.
                • ONEOK Inc. - Overview
                • ONEOK Inc. - Business segments
                • ONEOK Inc. - Key offerings
                • ONEOK Inc. - Segment focus
                • SWOT
              • 15.18 Plains All American Pipeline
                • Plains All American Pipeline - Overview
                • Plains All American Pipeline - Business segments
                • Plains All American Pipeline - Key offerings
                • Plains All American Pipeline - Segment focus
                • SWOT

              16 Appendix

              • 16.1 Scope of the report
                • 16.2 Inclusions and exclusions checklist
                  • Inclusions checklist
                  • Exclusions checklist
                • 16.3 Currency conversion rates for US$
                  • Currency conversion rates for US$
                • 16.4 Research methodology
                  • Research methodology
                • 16.5 Data procurement
                  • Information sources
                • 16.6 Data validation
                  • Data validation
                • 16.7 Validation techniques employed for market sizing
                  • Validation techniques employed for market sizing
                • 16.8 Data synthesis
                  • Data synthesis
                • 16.9 360 degree market analysis
                  • 360 degree market analysis
                • 16.10 List of abbreviations
                  • List of abbreviations

                Research Methodology

                Technavio presents a detailed picture of the market by way of study, synthesis, and summation of data from multiple sources. The analysts have presented the various facets of the market with a particular focus on identifying the key industry influencers. The data thus presented is comprehensive, reliable, and the result of extensive research, both primary and secondary.

                INFORMATION SOURCES

                Primary sources

                • Manufacturers and suppliers
                • Channel partners
                • Industry experts
                • Strategic decision makers

                Secondary sources

                • Industry journals and periodicals
                • Government data
                • Financial reports of key industry players
                • Historical data
                • Press releases

                DATA ANALYSIS

                Data Synthesis

                • Collation of data
                • Estimation of key figures
                • Analysis of derived insights

                Data Validation

                • Triangulation with data models
                • Reference against proprietary databases
                • Corroboration with industry experts

                REPORT WRITING

                Qualitative

                • Market drivers
                • Market challenges
                • Market trends
                • Five forces analysis

                Quantitative

                • Market size and forecast
                • Market segmentation
                • Geographical insights
                • Competitive landscape

                Interested in this report?

                Get your sample now to see our research methodology and insights!

                Download Now

                Frequently Asked Questions

                Oil And Gas Storage Service market growth will increase by $ 4620.4 mn during 2025-2029 .

                The Oil And Gas Storage Service market is expected to grow at a CAGR of 5.6% during 2025-2029 .

                Oil And Gas Storage Service market is segmented by Application( Power plants, Oil refineries, Chemical plants, LNG storage facilities) Service( Storage services, Ancillary services, Europe, MEA, South America) Type( Underground storage, Aboveground storage, APAC, Europe, South America)

                Brooge Energy Ltd., Buckeye Partners LP, Burns and McDonnell, Compagnie Industrielle Maritime, Emirates National Oil Co. Ltd. LLC., Enbridge Inc., Energy Transfer LP, Exolum Corp. S.A., Fluor Corp., IMTT, Kinder Morgan Inc., Koninklijke Vopak NV, LBC Tank Terminals, Marquard and Bahls AG, McDermott International Ltd., NOV Inc., NuStar Energy L.P., Odfjell SE, ONEOK Inc., Plains All American Pipeline are a few of the key vendors in the Oil And Gas Storage Service market.

                North America will register the highest growth rate of 29% among the other regions. Therefore, the Oil And Gas Storage Service market in North America is expected to garner significant business opportunities for the vendors during the forecast period.

                US, China, Saudi Arabia, Canada, UAE, Iran, Singapore, India, Qatar, Russia

                • Increase in global oil and gas demandAs developing countries are urbanizing rapidly is the driving factor this market.
                • these countries are also witnessing substantial growth in the demand for energy. Thus is the driving factor this market.
                • the consumption of liquid fuels and natural gas has increased. According to The World Bank Group is the driving factor this market.
                • the percentage of the urban population in China grew by 6.25% in 2023. The rising consumption of fuel and electricity worldwide has led to a high demand for oil and natural gas. According to the US EIA is the driving factor this market.
                • global liquid fuel consumption has increased to 1.6 mbpd in 2023 and is expected to reach 1.7 mbpd in 2024. The strong demand for petroleum products is the driving factor this market.
                • especially in developing countries such as China is the driving factor this market.
                • India is the driving factor this market.
                • and Indonesia is the driving factor this market.
                • due to rising consumption in the transportation sector is a major factor driving the demand for fossil fuel is the driving factor this market.
                • which is increasing the need for storage services. Hence is the driving factor this market.
                • investments in oil and gas storage services are growing.Oil producers is the driving factor this market.
                • especially OPEC countries and the US is the driving factor this market.
                • have been increasing their production or drilling new wells to meet the rising fuel demand. Most of the oil-producing countries do not have large additional capacities. Hence is the driving factor this market.
                • to meet the high fuel demand is the driving factor this market.
                • they will require oil companies to explore and drill greenfield wells in new and existing oil fields. These new drilling ventures will result in increased demand for oil and gas storage services. Similarly is the driving factor this market.
                • the global consumption of natural gas has also seen a significant rise due to the increased adoption of natural gas as a fuel. In addition is the driving factor this market.
                • the rise in fuel consumption in developing economies such as China and India is also expected to drive the demand for natural gas during the forecast period. As per the IEA is the driving factor this market.
                • the demand for oil and gas will continue to grow till 2040 is the driving factor this market.
                • and the use of natural gas will record a 45% increase by 2040 is the driving factor this market.
                • with a high scope to expand in the industrial and power generation sectors. The increasing demand for oil and natural gas will drive related exploration and production activities in the oil and gas sector during the forecast period. With new discoveries is the driving factor this market.
                • which are yet to be explored and drilled for production is the driving factor this market.
                • the midstream sector is expected to observe an increase in demand for oil and gas storage services is the driving factor this market.
                • thereby contributing to the growth of the global oil and gas storage service market during the forecast period. is the driving factor this market.

                The Oil And Gas Storage Service market vendors should focus on grabbing business opportunities from the Power plants segment as it accounted for the largest market share in the base year.