Oil And Gas Transportation Market Size 2025-2029
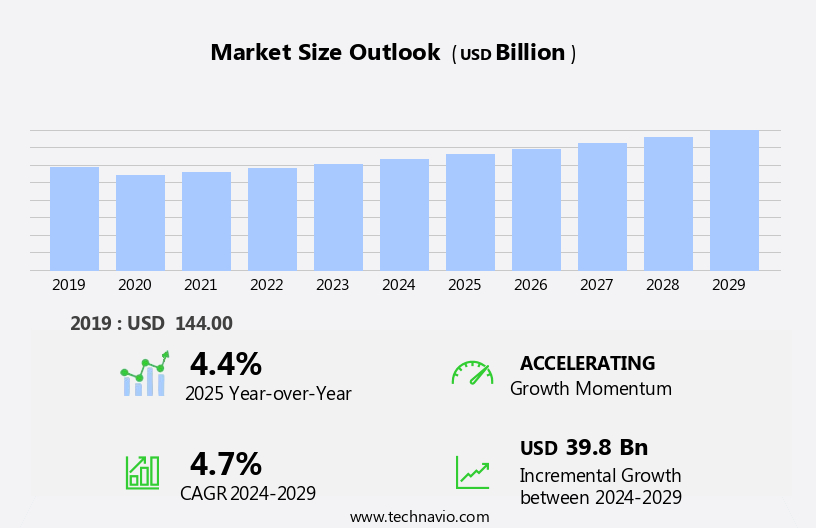
The oil and gas transportation market size is forecast to increase by USD 39.8 billion at a CAGR of 4.7% between 2024 and 2029.
- The market is witnessing significant expansion due to substantial investments in infrastructure development. This trend is driven by the increasing demand for crude oil and natural gas, necessitating the need for advanced and efficient transportation systems. However, the market faces technical challenges that require careful consideration. The transportation of crude oil and natural gas involves complex logistical processes and requires specialized infrastructure to ensure safe and efficient transfer. Crude oil, in particular, presents unique challenges due to its viscosity and volatility.
- Addressing these challenges will be crucial for market participants seeking to capitalize on opportunities in this dynamic industry. Effective solutions may include the adoption of advanced technologies, such as pipeline automation and the integration of renewable energy sources into transportation systems. Companies that can navigate these challenges and adapt to evolving market conditions will be well-positioned for success in the market.
What will be the Size of the Oil And Gas Transportation Market during the forecast period?
- The market continues to evolve, driven by various dynamics and applications across multiple sectors. Tanker capacity expansion and optimization play a crucial role in accommodating changing supply demands. Electric vehicles and renewable energy are reshaping the energy landscape, necessitating adjustments in transportation methods. Environmental compliance and data analytics are increasingly important for reducing emissions and improving operational efficiency. Energy trading and risk management are essential tools for navigating market volatility. Logistics management, including railcar capacity and transportation costs, is a critical factor in ensuring timely delivery. Hydrogen energy and natural gas transportation are gaining traction as Alternative Fuels. Offshore transportation, pipeline construction, and pipeline networks are integral to midstream infrastructure development.
- Contract management, artificial intelligence, and remote monitoring are streamlining operations and enhancing safety. Inventory management, pipeline maintenance, and tanker charter rates are key areas of focus for cost optimization. Transportation services, including truck transportation, pipeline safety, and truck Fleet Management, are vital components of the supply chain. Maritime transportation, railcar manufacturing, terminal operations, and transportation costs are continually evolving. Pipeline expansion and pipeline capacity are essential for meeting growing energy demands. The ongoing integration of alternative fuels, logistics services, and green transportation is transforming the market. LPG transportation, carbon capture, and infrastructure development are shaping the future of the oil and gas transportation industry.
- Tanker vessels, pipeline integrity, safety regulations, and tanker shipbuilding are all areas of continuous innovation.
How is this Oil And Gas Transportation Industry segmented?
The oil and gas transportation industry research report provides comprehensive data (region-wise segment analysis), with forecasts and estimates in "USD billion" for the period 2025-2029, as well as historical data from 2019-2023 for the following segments.
- Mode Of Transportation
- Pipelines
- Railroads
- Tankers and trucks
- Type
- Crude Oil
- Natural Gas
- Refined Products
- Geography
- North America
- US
- Canada
- Europe
- Norway
- Russia
- UK
- Middle East and Africa
- UAE
- APAC
- Australia
- China
- India
- South America
- Brazil
- Rest of World (ROW)
- North America
By Mode Of Transportation Insights
The pipelines segment is estimated to witness significant growth during the forecast period.
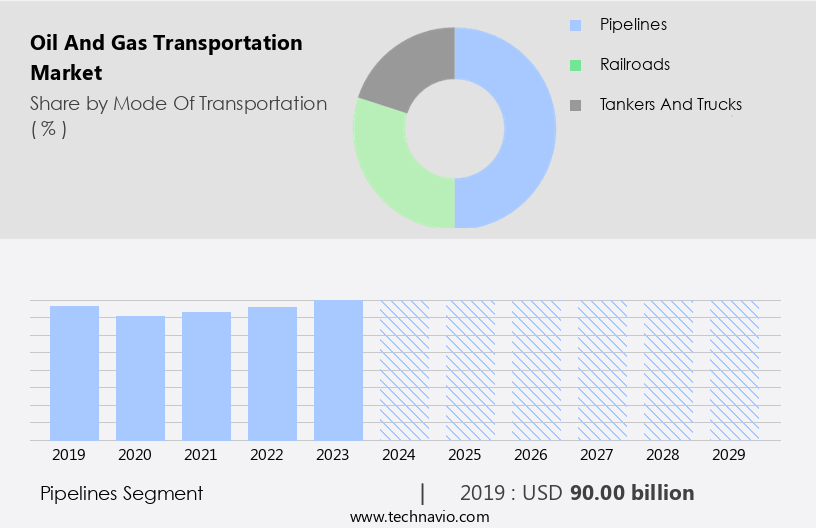
The Pipelines segment was valued at USD 90.00 billion in 2019 and showed a gradual increase during the forecast period.
Regional Analysis
APAC is estimated to contribute 42% to the growth of the global market during the forecast period.Technavio's analysts have elaborately explained the regional trends and drivers that shape the market during the forecast period.
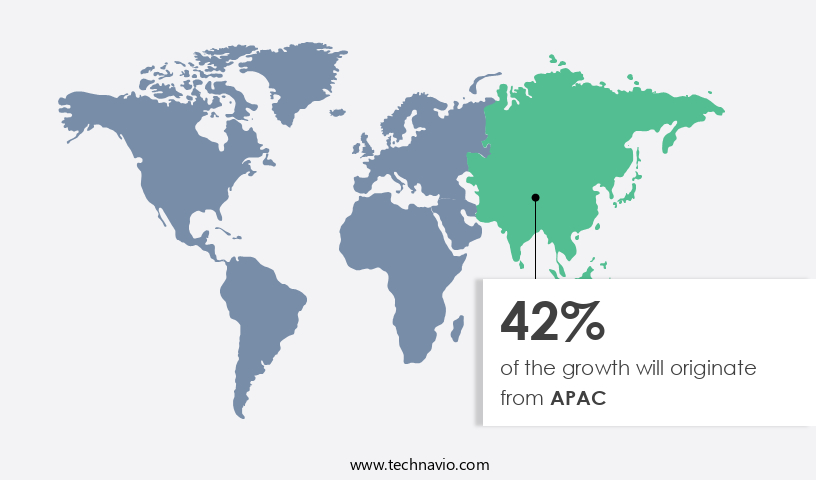
The market is witnessing significant developments in various regions, with the Asia-Pacific area experiencing the fastest growth. This region's substantial energy demand and continuous infrastructure development are driving this expansion. China, India, and Japan, as major consumers of oil and gas, necessitate extensive transportation networks to ensure a reliable supply. To address transportation bottlenecks, substantial investments in new pipeline infrastructure are being made. For instance, China's China-Russia East-Route Natural Gas Pipeline became operational in 2023, enhancing energy security and reducing reliance on maritime routes. India, too, is actively expanding its natural gas pipeline network, with the Kochi-Mangalore Natural Gas Pipeline's completion in January 2023, aiming to support growing energy needs and promote cleaner energy sources.
Fuel efficiency and environmental compliance are crucial factors shaping the market. Renewable energy and alternative fuels, such as hydrogen and liquefied petroleum gas (LPG), are gaining traction as sustainable transportation solutions. Data analytics, energy trading, risk management, logistics management, and pipeline construction are essential components of the market's evolution. Contract management, artificial intelligence, and blockchain technology are also being employed to optimize supply chain operations and improve pipeline integrity. Tanker fleets, liquefied natural gas (LNG) transportation, offshore transportation, and maritime transportation are key sectors undergoing transformation. Tanker charter rates, truck transportation, railcar transportation, and pipeline expansion are essential factors influencing market dynamics.
Infrastructure development, including pipeline networks, terminal operations, storage facilities, and railcar manufacturing, is a critical aspect of the market's growth. Pipeline maintenance, pipeline safety, and remote monitoring are essential for ensuring efficient and reliable transportation services. Emissions reduction and carbon capture are essential considerations for market participants. Midstream infrastructure, LPG transportation, and green transportation are emerging trends, as the industry adapts to changing market conditions and regulatory requirements. Crude oil transportation, LNG transportation, and pipeline transportation continue to dominate the market landscape. Safety regulations and tanker shipbuilding are essential aspects of the market's evolution.
Market Dynamics
Our researchers analyzed the data with 2024 as the base year, along with the key drivers, trends, and challenges. A holistic analysis of drivers will help companies refine their marketing strategies to gain a competitive advantage.
What are the key market drivers leading to the rise in the adoption of Oil And Gas Transportation Industry?
- The expansion of oil terminals serves as the primary catalyst for market growth.
- The market is driven by the increasing global energy demand, leading to the construction of new oil terminals and pipelines, particularly in Asia Pacific and Africa. Saudi Aramco, for instance, recently extended its investment program, Aramco Namaat, with 23 new MoUs and one joint venture, focusing on capacity building in sectors such as advanced materials, technology, industrial and energy services, and sustainability. Moreover, the oil and gas industry is undergoing significant transformations to enhance supply chain optimization, fuel efficiency, and environmental compliance. Renewable energy and alternative fuels, including electric vehicles, hydrogen energy, and liquefied natural gas, are gaining traction.
- Data analytics, energy trading, risk management, and logistics management play crucial roles in the oil and gas transportation sector, ensuring efficient operations and minimizing risks. Tanker fleets are also evolving, with a shift towards larger tankers and advanced technologies to improve fuel efficiency and reduce emissions. The integration of renewable energy sources and alternative fuels into the oil and gas transportation sector will continue to shape the market dynamics. As the industry adapts to these changes, it will require innovative solutions to meet the evolving demands of the energy market while ensuring sustainability and compliance with environmental regulations.
What are the market trends shaping the Oil And Gas Transportation Industry?
- The trend in the market involves increased investments in the infrastructure development sector, specifically in oil and gas transportation. This focus on infrastructure is a significant development in the industry.
- The market witnesses continuous investments in infrastructure development to optimize efficiency, safety, and reliability. This trend includes expanding and constructing new pipelines, terminals, storage facilities, and transportation routes. These investments cater to evolving energy demands, connect new production sites to end markets, and enhance connectivity between regions. Modernization efforts incorporate advanced technologies into oil and gas transportation infrastructure, such as smart monitoring systems, automation, and digitalization. One of the significant technological advancements is the application of blockchain technology for contract management, ensuring transparency and security. Artificial Intelligence (AI) and Inventory Management systems are also integrated to streamline operations and reduce emissions.
- Additionally, the petrochemical industry focuses on railcar manufacturing and railcar capacity expansion to transport petrochemicals more efficiently. Pipeline networks undergo upgrades to accommodate increasing demand and improve pipeline network efficiency. Terminal operations and transportation services are also digitized to improve operational efficiency and reduce costs. Overall, these investments and modernization efforts aim to create a robust and sustainable oil and gas transportation infrastructure.
What challenges does the Oil And Gas Transportation Industry face during its growth?
- The transportation of crude oil and natural gas presents significant technical challenges that significantly impact the growth of the industry.
- The global oil and gas industry is experiencing a shift from onshore to offshore drilling due to declining onshore reserves. Operators are moving their operations to seabeds or offshore rigs, necessitating specialized pipelaying vessels equipped with tools such as welding apparatus, inspection equipment, remotely operated vehicles, risers, flowlines, control systems, and guidewires for pipe installation. This transition increases the complexity of oil and gas transportation, influencing transportation costs. Pipeline maintenance is crucial to ensure safety and capacity. Remote monitoring technologies enable operators to detect leaks and other issues promptly, reducing downtime and associated costs.
- Tanker charter rates, truck transportation, railcar transportation, and maritime transportation are essential logistics services for transporting oil and gas. Pipeline expansion is ongoing to meet the growing demand for oil and gas, especially with the increasing adoption of alternative fuels. Pipeline safety is a significant concern, leading to stringent regulations and investments in pipeline maintenance and upgrades. Truck fleet management and railcar transportation are alternative options for transporting oil and gas when pipelines are not feasible. Tanker transportation remains a crucial method for transporting large volumes of oil and gas, especially for offshore drilling operations.
- The market dynamics of oil and gas transportation are influenced by various factors, including transportation costs, pipeline maintenance, remote monitoring, tanker charter rates, truck transportation, railcar transportation, pipeline expansion, pipeline capacity, and the adoption of alternative fuels.
Exclusive Customer Landscape
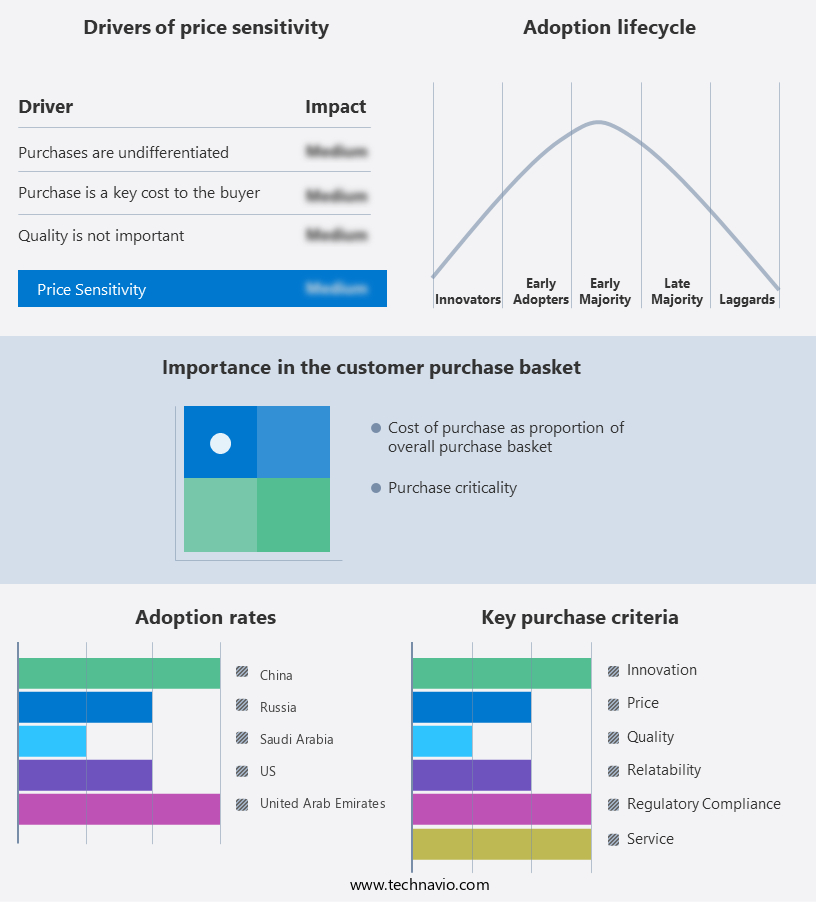
The oil and gas transportation market forecasting report includes the adoption lifecycle of the market, covering from the innovator's stage to the laggard's stage. It focuses on adoption rates in different regions based on penetration. Furthermore, the oil and gas transportation market report also includes key purchase criteria and drivers of price sensitivity to help companies evaluate and develop their market growth analysis strategies.
Customer Landscape
Key Companies & Market Insights
Companies are implementing various strategies, such as strategic alliances, oil and gas transportation market forecast, partnerships, mergers and acquisitions, geographical expansion, and product/service launches, to enhance their presence in the industry.
BP Plc - The company specializes in oil and gas transportation services, utilizing pipelines, ships, and rail cars as primary modes. Furthermore, it operates a fleet of specialized gas carriers, including the NW Shearwater, for the transport of liquefied natural gas. This diverse range of offerings ensures efficient and reliable energy transportation solutions.
The industry research and growth report includes detailed analyses of the competitive landscape of the market and information about key companies, including:
- BP Plc
- Chevron Corp.
- Enbridge Inc.
- Energy Transfer LP
- Euronav NV
- Exxon Mobil Corp.
- Frontline plc
- INTERNATIONAL SEAWAYS INC.
- Kinder Morgan Inc.
- Mitsui and Co. Ltd.
- Nippon Yusen Kabushiki Kaisha
- Pembina Pipeline Corp.
- PetroChina Co. Ltd.
- Petroleo Brasileiro SA
- Saudi Arabian Oil Co.
- Scorpio Tankers Inc.
- Shell plc
- TotalEnergies SE
- Tsakos Energy Navigation Ltd.
- Valero Energy Corp.
Qualitative and quantitative analysis of companies has been conducted to help clients understand the wider business environment as well as the strengths and weaknesses of key industry players. Data is qualitatively analyzed to categorize companies as pure play, category-focused, industry-focused, and diversified; it is quantitatively analyzed to categorize companies as dominant, leading, strong, tentative, and weak.
Recent Development and News in Oil And Gas Transportation Market
- In February 2024, Royal Dutch Shell and Qatar Petroleum announced a strategic collaboration to develop the Pearl Gas-to-Liquids (GTL) project in Qatar, marking a significant expansion in the oil and gas transportation sector. This joint venture aims to convert natural gas into liquid fuels, reducing the carbon footprint and enhancing energy security (Shell press release, 2024).
- In August 2024, Enbridge Inc. And Enterprise Products Partners LP entered into a definitive agreement to merge their midstream and marketing businesses, creating an entity with an extensive North American footprint. This merger, valued at approximately USD31 billion, will strengthen their market position and improve operational efficiencies (Enbridge press release, 2024).
- In October 2024, the United States Department of Transportation's Pipeline and Hazardous Materials Safety Administration (PHMSA) approved the construction of the Mountain Valley Pipeline, a 303-mile natural gas pipeline project connecting West Virginia, Virginia, and North Carolina. This approval marks a significant milestone in the development of the pipeline, which is expected to create thousands of jobs and boost the regional economy (PHMSA press release, 2024).
- In December 2024, Siemens Energy and Baker Hughes announced the successful deployment of their new Siemens SGT-800 gas turbine at a Baker Hughes facility in Louisiana. This technological advancement, which features advanced combustion technology, is expected to increase efficiency and reduce emissions in the oil and gas transportation sector (Siemens Energy press release, 2025).
Research Analyst Overview
The market is experiencing significant shifts as the energy sector transitions towards greener technologies. Pipeline leak detection and monitoring systems are crucial for maintaining pipeline integrity, mitigating risks, and ensuring energy security. Pipeline corrosion remains a challenge, driving innovation in pipeline integrity management. Carbon emissions trading schemes and environmental regulations are shaping the industry, pushing for more sustainable transportation solutions. Tanker safety standards are evolving, with new designs for tankers and LPG carriers prioritizing safety and reducing emissions. Railcar safety and maintenance are also essential components of supply chain resilience, especially for crude oil and liquefied natural gas (LNG) transportation.
The integration of renewable energy sources and the expansion of regasification terminals and liquefaction plants are transforming the market landscape. Transportation risk, including tanker ship operations and truck safety regulations, is a growing concern for industry players.
Dive into Technavio's robust research methodology, blending expert interviews, extensive data synthesis, and validated models for unparalleled Oil And Gas Transportation Market insights. See full methodology.
|
Market Scope |
|
|
Report Coverage |
Details |
|
Page number |
191 |
|
Base year |
2024 |
|
Historic period |
2019-2023 |
|
Forecast period |
2025-2029 |
|
Growth momentum & CAGR |
Accelerate at a CAGR of 4.7% |
|
Market growth 2025-2029 |
USD 39.8 billion |
|
Market structure |
Fragmented |
|
YoY growth 2024-2025(%) |
4.4 |
|
Key countries |
US, China, India, Brazil, Canada, Norway, Russia, Saudi Arabia, UK, Australia, and UAE |
|
Competitive landscape |
Leading Companies, Market Positioning of Companies, Competitive Strategies, and Industry Risks |
What are the Key Data Covered in this Oil And Gas Transportation Market Research and Growth Report?
- CAGR of the Oil And Gas Transportation industry during the forecast period
- Detailed information on factors that will drive the growth and forecasting between 2025 and 2029
- Precise estimation of the size of the market and its contribution of the industry in focus to the parent market
- Accurate predictions about upcoming growth and trends and changes in consumer behaviour
- Growth of the market across APAC, North America, Middle East and Africa, Europe, and South America
- Thorough analysis of the market's competitive landscape and detailed information about companies
- Comprehensive analysis of factors that will challenge the oil and gas transportation market growth of industry companies
We can help! Our analysts can customize this oil and gas transportation market research report to meet your requirements.
 RIA -
RIA - 
