
Oil Pollution Soil Treatment Market Size 2024-2028
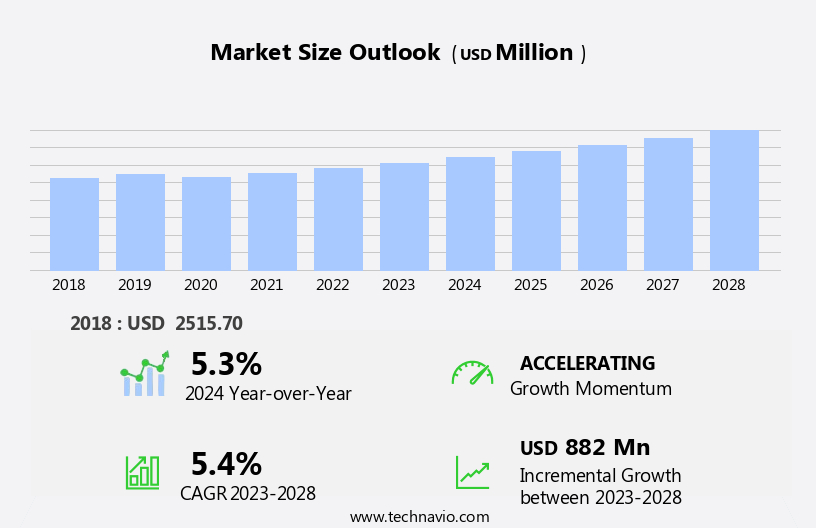
The oil pollution soil treatment market size is forecast to increase by USD 882 million at a CAGR of 5.4% between 2023 and 2028.
- The market is driven by the increasing incidence of oil spills and industrial contamination, which necessitates effective soil remediation solutions. The integration of advanced technologies, such as data analytics, remote sensing, and geographic information systems, into monitoring soil conditions is a key trend in this market, enabling early detection and efficient response to contamination incidents. However, the high cost of excavation equipment poses a significant challenge to market growth, as these costs can significantly increase the overall remediation project expenses.
- Companies seeking to capitalize on market opportunities and navigate challenges effectively must focus on technological innovation to reduce the reliance on expensive equipment, while also collaborating with regulatory bodies and industry associations to develop and implement effective policies and standards for oil spill prevention and soil remediation.
What will be the Size of the Oil Pollution Soil Treatment Market during the forecast period?
- The market continues to evolve, driven by the constant need for effective remediation solutions in various sectors. Site assessments are a crucial first step in identifying the extent of contamination, with public health and environmental protection being primary concerns. Remediation costs vary, depending on the severity of the contamination and the chosen technology. Soil flushing and air sparging are common remediation techniques, with environmental regulations guiding their implementation. Innovative remediation methods, such as in-situ and ex-situ technologies, are gaining popularity for their effectiveness in addressing hydrocarbon contamination in industrial sites, residential properties, and agricultural land. Regulatory compliance and sustainable remediation practices are increasingly important, with green remediation techniques, such as microbial degradation and soil washing, offering eco-friendly alternatives.
- Remediation planning and monitoring are essential components of the process, ensuring the successful removal of contaminants, including polycyclic aromatic hydrocarbons, heavy metals, and organic contaminants. Technologies like permeable reactive barriers, thermal desorption, and soil vapor extraction are continually improving, offering more efficient and cost-effective solutions for oil spill cleanup and remediation at gas stations, manufacturing facilities, and oil refineries. The ongoing unfolding of market activities underscores the dynamic nature of the market.
How is this Oil Pollution Soil Treatment Industry segmented?
The oil pollution soil treatment industry research report provides comprehensive data (region-wise segment analysis), with forecasts and estimates in "USD million" for the period 2024-2028, as well as historical data from 2018-2022 for the following segments.
- Method
- Bioremediation
- Thermal treatment
- Chemical treatment
- Physical treatment
- Electrokinetic treatment
- End-user
- Oil and gas
- Industrial manufacturing
- Agriculture
- Waste management
- Construction and infrastructure
- Site Type
- Brownfield Sites
- Superfund Sites
- Abandoned Mines
- Geography
- North America
- US
- Canada
- Europe
- France
- Germany
- Italy
- UK
- Middle East and Africa
- Egypt
- KSA
- Oman
- UAE
- APAC
- China
- India
- Japan
- South America
- Argentina
- Brazil
- Rest of World (ROW)
- North America
By Method Insights
The bioremediation segment is estimated to witness significant growth during the forecast period.
The market encompasses various remediation techniques, with bioremediation gaining prominence due to its effectiveness and economic viability. Bioremediation utilizes biological processes to eliminate contaminants, primarily oil pollutants, from soil and water. Microorganisms, such as bacteria and fungi, are employed to metabolize contaminants, converting them into less harmful substances or consuming them entirely. This method is particularly effective for addressing organic pollutants, including hydrocarbons, petroleum products, and organic contaminants. Environmental regulations mandate the implementation of remediation strategies to protect public health and the environment. Remediation planning, monitoring, and completion are crucial aspects of this process. In-situ and ex-situ remediation methods are commonly used, depending on the extent of contamination and site conditions.
In-situ techniques include soil flushing, air sparging, and permeable reactive barriers, while ex-situ methods involve soil washing, thermal desorption, and soil vapor extraction. Industrial sites, such as manufacturing facilities, oil refineries, and gas stations, are significant contributors to soil contamination. Contaminants, including heavy metals and polycyclic aromatic hydrocarbons (PAHs), pose health risks and require remediation. Innovative remediation technologies, such as green remediation and sustainable remediation, are increasingly being adopted to minimize environmental impact and reduce remediation costs. Regulatory compliance is essential in the market, ensuring effective contaminant removal and minimizing potential health risks. Remediation effectiveness and technologies continue to evolve, with ongoing research focusing on improving remediation time and enhancing the overall process efficiency.
Soil analysis is crucial in the remediation process, enabling accurate identification and quantification of contaminants. Hydrocarbon contamination in agricultural land and residential properties also necessitates remediation to ensure safe and productive use. Oil spill cleanup remains a significant application area for soil treatment methods, emphasizing the importance of efficient and cost-effective remediation solutions.
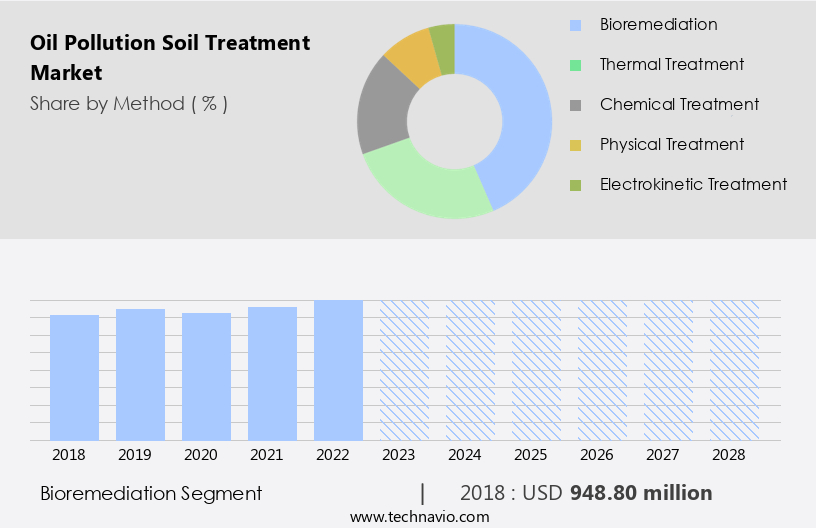
The Bioremediation segment was valued at USD 948.80 million in 2018 and showed a gradual increase during the forecast period.
Regional Analysis
North America is estimated to contribute 29% to the growth of the global market during the forecast period.Technavio's analysts have elaborately explained the regional trends and drivers that shape the market during the forecast period.

The North American the market is witnessing significant activity, with Canada and the US being key contributors. In Canada, the expansion of oil transportation and processing infrastructure, such as Cenovus's 17-kilometer pipeline project, necessitates the implementation of effective soil remediation solutions to mitigate potential oil spills and contamination. This infrastructure growth underscores the market's demand for advanced remediation technologies. In the US, both government initiatives and private sector investments are driving market growth. Environmental regulations mandate stringent remediation measures for sites contaminated with petroleum hydrocarbons, organic contaminants, heavy metals, and polycyclic aromatic hydrocarbons. Innovative remediation techniques, such as soil flushing, air sparging, in-situ remediation, permeable reactive barriers, soil washing, and thermal desorption, are being employed to enhance contaminant removal and ensure regulatory compliance.
The US Environmental Protection Agency (EPA) encourages sustainable remediation methods, such as microbial degradation and green remediation, to minimize environmental impact. Remediation planning, monitoring, implementation, and completion are crucial aspects of the market, with remediation effectiveness and cost being key considerations. The market encompasses various sectors, including industrial sites, oil refineries, gas stations, manufacturing facilities, agricultural land, and residential properties. Remediation technologies are continually evolving to address the complexities of hydrocarbon contamination, with ex-situ and in-situ approaches offering distinct advantages based on site-specific conditions and remediation time requirements.
Market Dynamics
The Oil pollution soil treatment market is experiencing significant growth, driven by increasing environmental concerns and stricter regulations. Bioremediation for oil contaminated soil is a leading technology, leveraging natural processes for effective cleanup. Demand for comprehensive hydrocarbon remediation services and advanced oil spill cleanup technologies remains high. Methods like thermal desorption soil treatment and chemical oxidation for soil pollution are crucial for effective remediation, alongside soil washing for oil contamination. The broader environmental remediation oil spills sector focuses on contaminated land restoration oil with emphasis on in-situ soil treatment oil for minimal disruption. Current oil pollution soil treatment market trends indicate a rising interest in innovative solutions such as nanoparticles for soil remediation oil to improve efficiency. The need for cost-effective soil remediation oil is paramount for large-scale incidents like industrial oil spill remediation and pipeline spill remediation services. Utilizing biostimulants for oil spills enhances bioremediation, contributing to sustainable oil remediation techniques for hazardous waste soil treatment and refinery soil contamination cleanup. These drivers collectively shape the global oil pollution soil treatment market.
Our researchers analyzed the data with 2023 as the base year, along with the key drivers, trends, and challenges. A holistic analysis of drivers will help companies refine their marketing strategies to gain a competitive advantage.
What are the key market drivers leading to the rise in the adoption of Oil Pollution Soil Treatment Industry?
- The escalating occurrences of oil spills and industrial contamination serve as the primary catalyst for market growth in this sector.
- The issue of oil pollution and its impact on soil health is a pressing concern due to the increasing number of incidents resulting from transportation accidents, oil well leaks, and industrial discharges. The global reliance on petroleum as a primary energy resource has led to a rise in these incidents, necessitating effective soil treatment strategies. Oil spills can have detrimental effects on soil ecosystems, disrupting microbial communities essential for nutrient cycling and organic matter decomposition. Contaminants, such as polycyclic aromatic hydrocarbons (PAHs) and other petroleum hydrocarbons, can persist in the soil for extended periods, altering soil chemistry and causing toxicity that harms plant growth and biodiversity.
- These contaminants can also pose significant risks to human health through potential groundwater contamination. To mitigate the effects of oil pollution on soil, various remediation techniques have been developed. Site assessment is a crucial initial step to determine the extent of contamination and select the most effective remediation method. Technologies such as soil flushing, air sparging, and innovative remediation methods are employed to enhance the effectiveness of remediation efforts. Environmental regulations mandate the implementation of these remediation strategies to protect public health and the environment. The cost of remediation can be substantial, but the long-term benefits of restoring contaminated soil far outweigh the costs.
- In conclusion, the urgent need for effective soil treatment strategies to address oil pollution is clear, and ongoing research and innovation in remediation technologies will continue to play a vital role in mitigating the negative impacts on soil health and the environment.
What are the market trends shaping the Oil Pollution Soil Treatment Industry?
- The integration of data analytics, remote sensing, and geographic information systems (GIS) is a significant market trend in monitoring soil conditions. These advanced technologies enable more accurate and efficient assessment of soil properties and conditions. (Alternatively, Soil monitoring is undergoing a transformation with the integration of data analytics, remote sensing, and geographic information systems (GIS), which are becoming essential tools for enhancing accuracy and efficiency in assessing soil properties and conditions.)
- The market has been significantly advanced by the integration of data analytics, remote sensing, and Geographic Information Systems (GIS) in monitoring soil conditions. Remote sensing technology collects extensive spatial data over vast landscapes, identifying oil pollution hotspots through changes in soil characteristics. High-resolution satellite imagery and aerial data are utilized to detect these changes, enabling proactive environmental impact monitoring. Data analytics plays a pivotal role in interpreting this data by applying advanced statistical and machine learning techniques to identify contamination patterns and trends. This integration facilitates the development of predictive models, allowing for the forecasting of potential contamination scenarios based on current data trends.
- Proactive management strategies can then be implemented, reducing the need for reactive measures. Regulatory compliance is a critical driver in the market, as contaminated soil poses a significant risk to human health and the environment. Sustainable remediation methods, such as bioremediation and phytoremediation, are increasingly being adopted to minimize the ecological impact of cleanup efforts. The completion of remediation projects is closely monitored to ensure regulatory requirements are met and to maintain public trust. Polycyclic aromatic hydrocarbons (PAHs) are a significant contaminant in oil spills, posing a significant health risk. Effective contaminant removal is essential to mitigate the long-term consequences of oil spills on residential properties and the environment.
- The market continues to evolve, driven by advancements in technology and the growing need for sustainable, cost-effective solutions to address the complex challenges of oil spill cleanup and remediation.
What challenges does the Oil Pollution Soil Treatment Industry face during its growth?
- The high cost of excavation equipment poses a significant challenge to the growth of the industry, as this essential infrastructure comes with a substantial financial investment.
- The market faces a substantial challenge due to the high cost of excavation equipment. The price tag for excavation machinery, such as bulldozers, excavators, and trucks, can range from tens of thousands to several million dollars, depending on their size, capabilities, and features. For instance, backhoes cost between USD 50,000 and USD 200,000, excavators range from USD 70,000 to USD 500,000, bulldozers can be priced from USD 100,000 to USD 1 million, and skid-steer loaders range from USD 20,000 to USD 100,000. Beyond the initial purchase or leasing costs, ongoing expenses like maintenance, repairs, and fuel add to the financial burden. Effective remediation strategies for oil pollution in soil include microbial degradation, soil washing, in-situ remediation, permeable reactive barriers, and soil vapor extraction.
- Industrial sites, such as gas stations, often require environmental consulting to address heavy metal contamination. These methods can be cost-effective alternatives to excavation, especially when considering the long-term savings from reduced ongoing expenses. For instance, in-situ remediation techniques, like soil vapor extraction, can effectively remove contaminants without the need for excavation. By focusing on these innovative solutions, the market can mitigate the financial challenges associated with excavation equipment costs.
Exclusive Customer Landscape
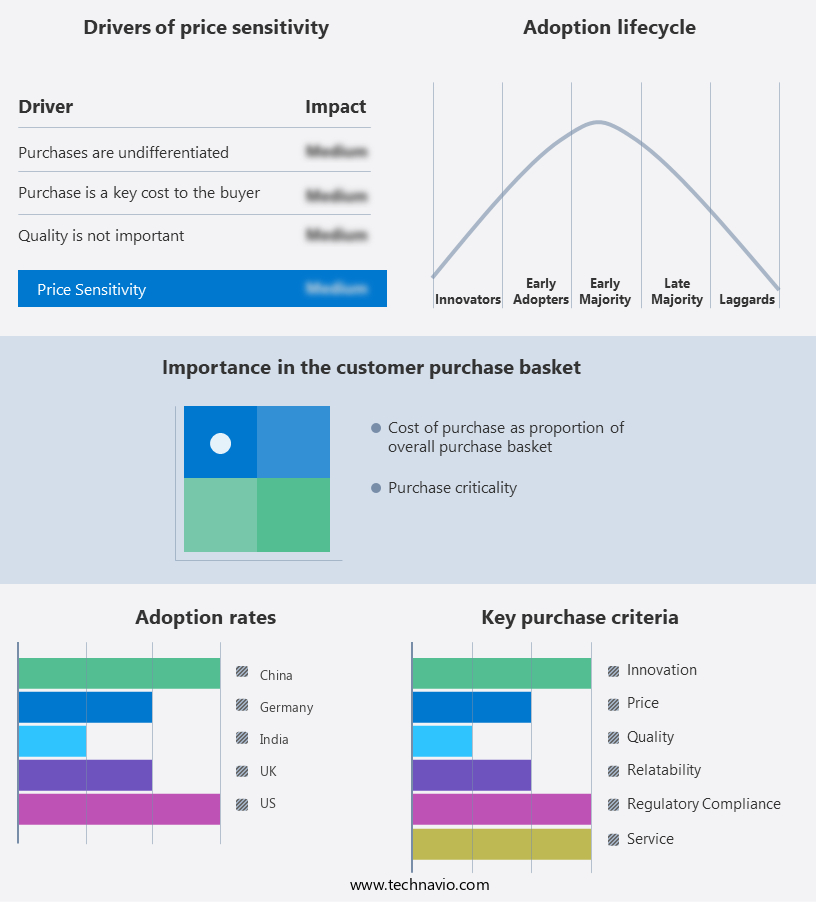
The oil pollution soil treatment market forecasting report includes the adoption lifecycle of the market, covering from the innovator's stage to the laggard's stage. It focuses on adoption rates in different regions based on penetration. Furthermore, the oil pollution soil treatment market report also includes key purchase criteria and drivers of price sensitivity to help companies evaluate and develop their market growth analysis strategies.
Customer Landscape
Key Companies & Market Insights
Companies are implementing various strategies, such as strategic alliances, oil pollution soil treatment market forecast, partnerships, mergers and acquisitions, geographical expansion, and product/service launches, to enhance their presence in the industry.
AECOM - This company specializes in the remediation of oil pollution in soil utilizing innovative techniques, including bioremediation, thermal desorption, and in-situ thermal technology.
The industry research and growth report includes detailed analyses of the competitive landscape of the market and information about key companies, including:
- AECOM
- Arcadis
- Bechtel Corporation
- BioSolve
- Clean Harbors
- ENI S.p.A.
- EnviroServ
- ERM Group
- Golder Associates
- Ivey International
- Jacobs Engineering
- Lamor Corporation
- Ramboll Group
- Regenesis
- Soilworks
- Stantec
- SUEZ
- Tetra Tech
- Veolia Environnement
- Wood PLC
Qualitative and quantitative analysis of companies has been conducted to help clients understand the wider business environment as well as the strengths and weaknesses of key industry players. Data is qualitatively analyzed to categorize companies as pure play, category-focused, industry-focused, and diversified; it is quantitatively analyzed to categorize companies as dominant, leading, strong, tentative, and weak.
Recent Development and News in Oil Pollution Soil Treatment Market
- In February 2024, Nano Remed360, a leading player in the market, introduced its innovative nanotechnology-based product, "NanoClean," which effectively removes heavy metals and hydrocarbons from contaminated soil (Nano Remed360 Press Release).
- In July 2024, Shell Global Solutions International B.V. And SUEZ, two major players in the oil industry and water treatment sectors, respectively, announced a strategic collaboration to develop and commercialize advanced technologies for treating contaminated soils, focusing on the oil and gas sector (Shell Global Solutions International B.V. Press Release).
- In October 2024, Tetra Tech, a leading provider of environmental services, completed the acquisition of Geosyntec, significantly expanding its capabilities in soil remediation and contaminated site management (Tetra Tech Press Release).
- In December 2024, the European Union passed the Soil Strategy, aiming to prevent further soil degradation and restore degraded soils, creating substantial opportunities for market growth in Europe (European Commission Press Release). These developments highlight strategic collaborations, innovative product launches, and regulatory initiatives driving growth in the market.
Research Analyst Overview
The market is experiencing significant activity and trends in response to the growing concern for groundwater contamination. Remediation project management plays a crucial role in ensuring effective and efficient remediation processes. Remediation research continues to uncover innovations, such as nutrient supplements and bioremediation enzymes, to enhance remediation performance. Environmental impact assessments and liability are key considerations in remediation project planning. Remediation reporting and certification are essential for demonstrating compliance with soil quality standards and regulatory requirements. Remediation feasibility studies and cost-benefit analyses help determine the best remediation technologies and practices for specific sites. Soil moisture, temperature, permeability, and vapor intrusion are critical factors affecting remediation success criteria.
Microbial consortia and bioaugmentation agents are increasingly used to enhance bioremediation processes. Risk management and auditing are essential components of remediation project planning and execution. The remediation future lies in continuous research and innovation, with trends towards advanced technologies, such as soil amendments and remediation performance indicators. Comparing and contrasting different remediation technologies and best practices is crucial for making informed decisions and overcoming remediation challenges.
Dive into Technavio's robust research methodology, blending expert interviews, extensive data synthesis, and validated models for unparalleled Oil Pollution Soil Treatment Market insights. See full methodology.
|
Market Scope |
|
|
Report Coverage |
Details |
|
Page number |
218 |
|
Base year |
2023 |
|
Historic period |
2018-2022 |
|
Forecast period |
2024-2028 |
|
Growth momentum & CAGR |
Accelerate at a CAGR of 5.4% |
|
Market growth 2024-2028 |
USD 882 million |
|
Market structure |
Fragmented |
|
YoY growth 2023-2024(%) |
5.3 |
|
Key countries |
US, Canada, Germany, UK, Italy, France, China, India, Japan, Egypt, Oman, Argentina, KSA, UAE, and Brazil |
|
Competitive landscape |
Leading Companies, Market Positioning of Companies, Competitive Strategies, and Industry Risks |
What are the Key Data Covered in this Oil Pollution Soil Treatment Market Research and Growth Report?
- CAGR of the Oil Pollution Soil Treatment industry during the forecast period
- Detailed information on factors that will drive the growth and forecasting between 2024 and 2028
- Precise estimation of the size of the market and its contribution of the industry in focus to the parent market
- Accurate predictions about upcoming growth and trends and changes in consumer behaviour
- Growth of the market across North America, Europe, APAC, South America, and Middle East and Africa
- Thorough analysis of the market's competitive landscape and detailed information about companies
- Comprehensive analysis of factors that will challenge the oil pollution soil treatment market growth of industry companies
We can help! Our analysts can customize this oil pollution soil treatment market research report to meet your requirements.
 RIA -
RIA - 
