Open System MRI Market Analysis, Size, and Forecast 2025-2029: North America (US, Canada, and Mexico), Europe (Germany, UK, and France), APAC (China, India, and Japan), South America (Brazil, Argentina, and Colombia), Middle East and Africa (Saudi Arabia, UAE, and Turkey), Asia, Rest of World (ROW)

Open System MRI Market Analysis, Size, and Forecast 2025-2029:
North America (US, Canada, and Mexico), Europe (Germany, UK, and France), APAC (China, India, and Japan), South America (Brazil, Argentina, and Colombia), Middle East and Africa (Saudi Arabia, UAE, and Turkey), Asia, Rest of World (ROW)

Published: Dec 2025 290 Pages SKU: IRTNTR74150

Market Overview at a Glance

$288.5 Mn
Market Opportunity
4.6%
CAGR 2024 - 2029
36.8%
North America Growth
$551.3 Mn
Low field scanner segment 2023

Open System MRI Market Size 2025-2029

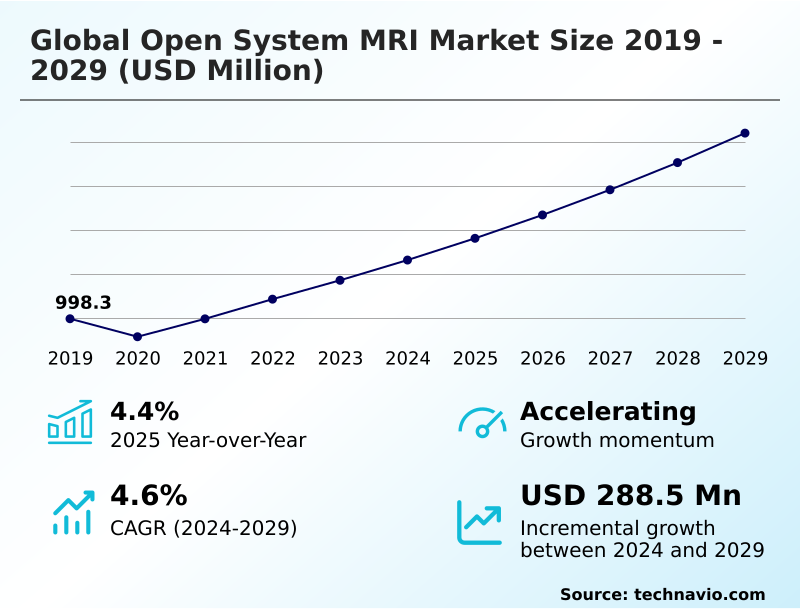
The open system mri market size is valued to increase by USD 288.5 million, at a CAGR of 4.6% from 2024 to 2029. Increasing prevalence of diseases coupled with growing geriatric population will drive the open system mri market.

Major Market Trends & Insights

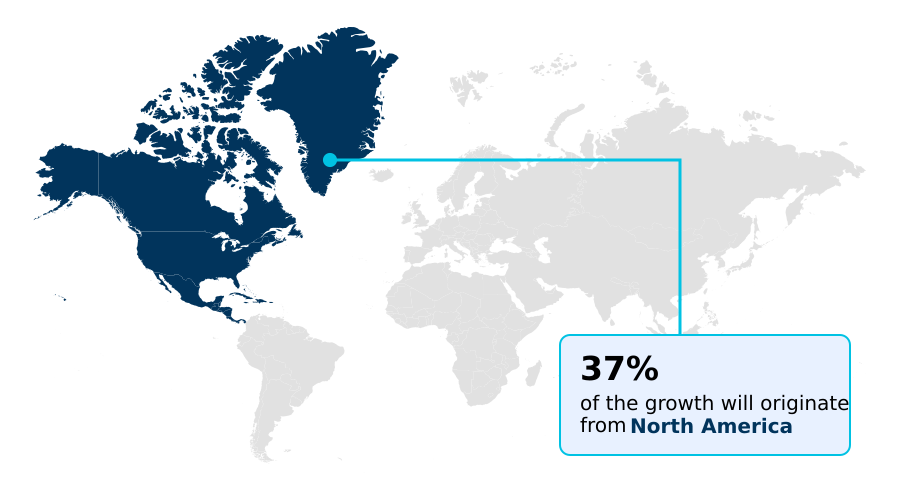
  • North America dominated the market and accounted for a 36.8% growth during the forecast period.
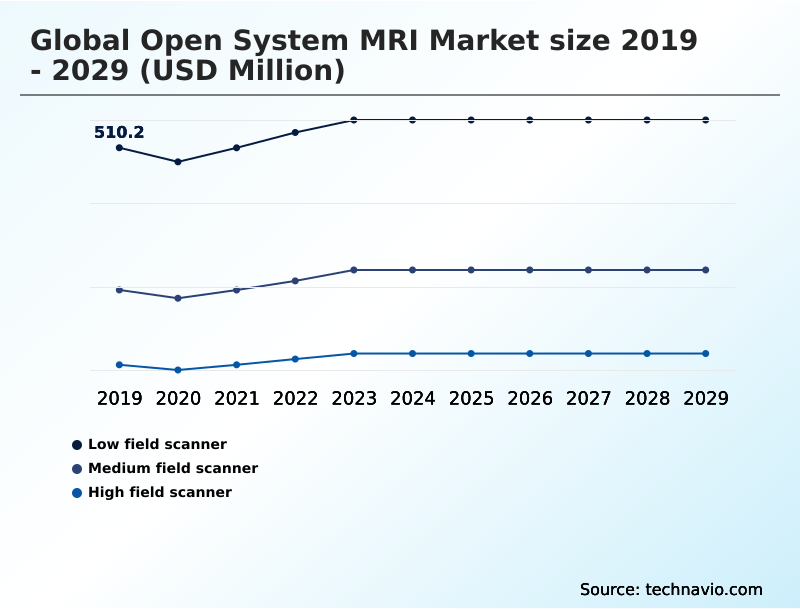
  • By Type - Low field scanner segment was valued at USD 551.3 million in 2023
  • By Technology - Superconducting magnet segment accounted for the largest market revenue share in 2023

Market Size & Forecast

  • Market Opportunities: USD 421.9 million
  • Market Future Opportunities: USD 288.5 million
  • CAGR from 2024 to 2029 : 4.6%

Market Summary

  • The open system MRI market is defined by its patient-centric approach to diagnostic imaging, fundamentally designed to alleviate the claustrophobia and anxiety often associated with traditional closed-bore scanners.
  • This focus on patient comfort is a primary driver, particularly with the rising global prevalence of chronic conditions requiring imaging and an expanding geriatric and bariatric population that benefits from more accessible system designs.
  • Technological innovation is a key theme, with advancements in software and AI-powered reconstruction engines enhancing image quality and reducing scan times, directly challenging the historical performance gap with closed systems. For instance, an outpatient imaging center can leverage these innovations to improve patient throughput and satisfaction, strengthening its competitive position.
  • However, the market grapples with the inherent physics-based challenge of balancing field strength and homogeneity with an open architecture, which can impact the signal-to-noise ratio in some systems. The high capital cost of advanced scanners also remains a significant barrier to widespread adoption, leading to a dynamic interplay between clinical need, patient experience, and economic realities for healthcare providers.

What will be the Size of the Open System MRI Market during the forecast period?

Get Key Insights on Market Forecast (PDF) Request Free Sample

How is the Open System MRI Market Segmented?

The open system mri industry research report provides comprehensive data (region-wise segment analysis), with forecasts and estimates in "USD million" for the period 2025-2029, as well as historical data from 2019-2023 for the following segments.

  • Type
    • Low field scanner
    • Medium field scanner
    • High field scanner
  • Technology
    • Superconducting magnet
    • Permanent magnet
    • Hybrid systems
  • End-user
    • Neurology
    • Oncology
    • Cardiology
    • Others
  • Geography
    • North America
      • US
      • Canada
      • Mexico
    • Europe
      • Germany
      • UK
      • France
    • Asia
    • Rest of World (ROW)

By Type Insights

The low field scanner segment is estimated to witness significant growth during the forecast period.

The low-field scanner segment is experiencing a resurgence, driven by technological advancements that enhance its clinical utility.

Initially perceived as having lower performance, modern low-field MRI scanner models now incorporate sophisticated hardware and software, making them viable for a range of applications previously reserved for high-field systems.

Innovations in advanced imaging sequences and image reconstruction engine technology are improving diagnostic confidence. These systems, often featuring a wide-bore MRI design, address critical needs in outpatient imaging centers by improving patient compliance rates and expanding healthcare accessibility.

Their adoption is also driven by the significant operational cost reduction they offer, with some systems demonstrating a 15% lower total cost of ownership, making advanced imaging more feasible for a wider range of healthcare providers.

Request Free Sample

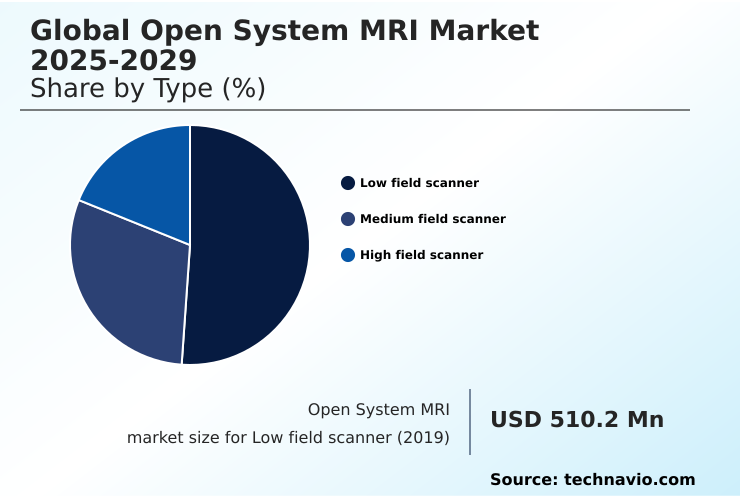
The Low field scanner segment was valued at USD 551.3 million in 2023 and showed a gradual increase during the forecast period.

Request Free Sample

Regional Analysis

North America is estimated to contribute 36.8% to the growth of the global market during the forecast period.Technavio’s analysts have elaborately explained the regional trends and drivers that shape the market during the forecast period.

See How Open System MRI Market Demand is Rising in North America Request Free Sample

The geographic landscape of the open system MRI market is characterized by mature, high-adoption regions and rapidly emerging growth areas.

North America currently dominates, accounting for over 36% of the market opportunity, driven by advanced healthcare infrastructure and a strong emphasis on patient-centric design in a competitive provider environment.

Europe follows, with established markets focused on upgrading to systems with better magnetic field homogeneity and diagnostic confidence.

However, the highest growth is concentrated in Asia, where expanding healthcare access and rising investments are increasing the adoption of systems utilizing both superconducting magnet and cost-effective permanent magnet MRI technology.

This regional expansion is broadening the availability of specialized services like interventional MRI procedures and weight-bearing MRI scans.

Market Dynamics

Our researchers analyzed the data with 2024 as the base year, along with the key drivers, trends, and challenges. A holistic analysis of drivers will help companies refine their marketing strategies to gain a competitive advantage.

  • Healthcare providers evaluating imaging technologies must weigh numerous factors, beginning with the clear benefits of open mri for claustrophobic patients. The decision extends to specific populations, with open system mri for bariatric patients becoming a critical service offering.
  • A thorough cost-benefit analysis of low-field mri is often the next step, leading to a technical evaluation of superconducting vs permanent magnet open mri designs. The promise of ai-enabled open mri for faster scans is a compelling driver, directly impacting patient scheduling and throughput.
  • Many are now exploring cryogen-free open mri system advantages to lower long-term operational costs, which is a key element in the future of helium-free mri technology. The clinical utility is further demonstrated by the upright mri scanner for spinal instability diagnosis and the growing use of interventional procedures using open architecture mri.
  • For specialized demographics, pediatric imaging with reduced sedation mri represents a significant advancement in patient safety. Facilities also conduct high-field open mri image quality assessment to ensure diagnostic efficacy, constantly seeking ways of improving signal-to-noise ratio in open mri.
  • This technology has found new niches, with growing open mri applications in sports medicine and demand for weight-bearing mri for orthopedic assessment. The operational model, particularly the open mri workflow in outpatient centers, is optimized when comparing open mri vendors and technology.
  • This leads to a deeper look at integrating ai into existing mri systems and calculating the roi on advanced open mri scanners, especially as regulatory requirements for mri installation become more complex. Ultimately, the focus remains on managing patient anxiety during mri scans and minimizing motion artifacts in open mri to ensure high-quality outcomes.
  • New applications such as open mri for cardiac stress testing are enabled by advanced software suites for open mri, which also help in optimizing patient scheduling for mri. Facilities that adopt these comprehensive strategies often see a greater return, with some reporting that AI-assisted workflows nearly double the diagnostic yield for complex cases compared to older, manual processes.

What are the key market drivers leading to the rise in the adoption of Open System MRI Industry?

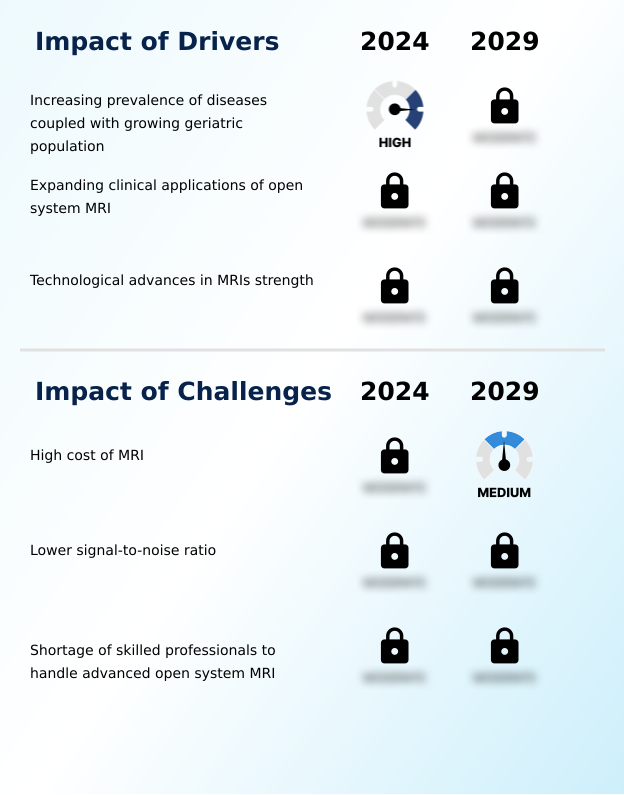
  • The increasing prevalence of chronic diseases, combined with a growing global geriatric population, serves as a key driver for market growth.

  • The rising prevalence of chronic conditions and an aging population are significant market drivers.
  • There is growing demand for systems that accommodate specific patient groups, such as those requiring bariatric patient imaging and pediatric neuroimaging, where comfort and accessibility are paramount.
  • Open MRI is crucial for expanding cardiac MRI applications and oncology imaging solutions, as it allows for better patient monitoring and positioning. An upright MRI scanner, for instance, is invaluable for diagnosing spinal conditions under natural weight-bearing load.
  • The need for advanced diagnostic techniques like diffusion tensor imaging and blood oxygenation level dependent imaging for neurological assessment further propels demand.
  • These systems improve diagnostic access, with some facilities reporting a 20% increase in scan success rates for anxious or larger patients.

What are the market trends shaping the Open System MRI Industry?

  • Significant software advancements are a key trend shaping the MRI technology landscape, enhancing imaging capabilities and driving market evolution.

  • Software advancements are fundamentally reshaping the market, with AI-enabled reconstruction and motion correction algorithms at the forefront. These innovations directly address historical limitations by enhancing diagnostic procedure accuracy and enabling faster, more detailed scans. For example, simultaneous multi-slice imaging can accelerate 2D acquisition by a factor of three, significantly boosting patient throughput improvement.
  • This focus on software enhances clinical workflow efficiency, with some platforms reducing scan setup time by over 25%. Furthermore, capabilities like real-time image processing support the move toward value-based healthcare by providing actionable data more quickly and supporting easier tele-radiology integration, which expands diagnostic reach.

What challenges does the Open System MRI Industry face during its growth?

  • The high acquisition and maintenance costs associated with MRI systems present a significant challenge to market growth and wider adoption.

  • The substantial capital equipment investment required for high-field open MRI systems remains a primary market challenge. High costs for acquisition, installation, and maintenance limit adoption, especially in smaller healthcare facilities. While innovations like the cryogen-free magnet aim to reduce long-term expenses, the initial outlay is significant.
  • This has led to a robust market for refurbished MRI systems, which can offer savings of up to 50% compared to new equipment. Another challenge is managing patient motion artifacts, although designs focused on claustrophobia reduction help mitigate this.
  • Vendors must balance advanced gradient coil design and radiofrequency coil technology with cost-effectiveness to broaden market penetration and align with evolving radiological society guidelines.

Exclusive Technavio Analysis on Customer Landscape

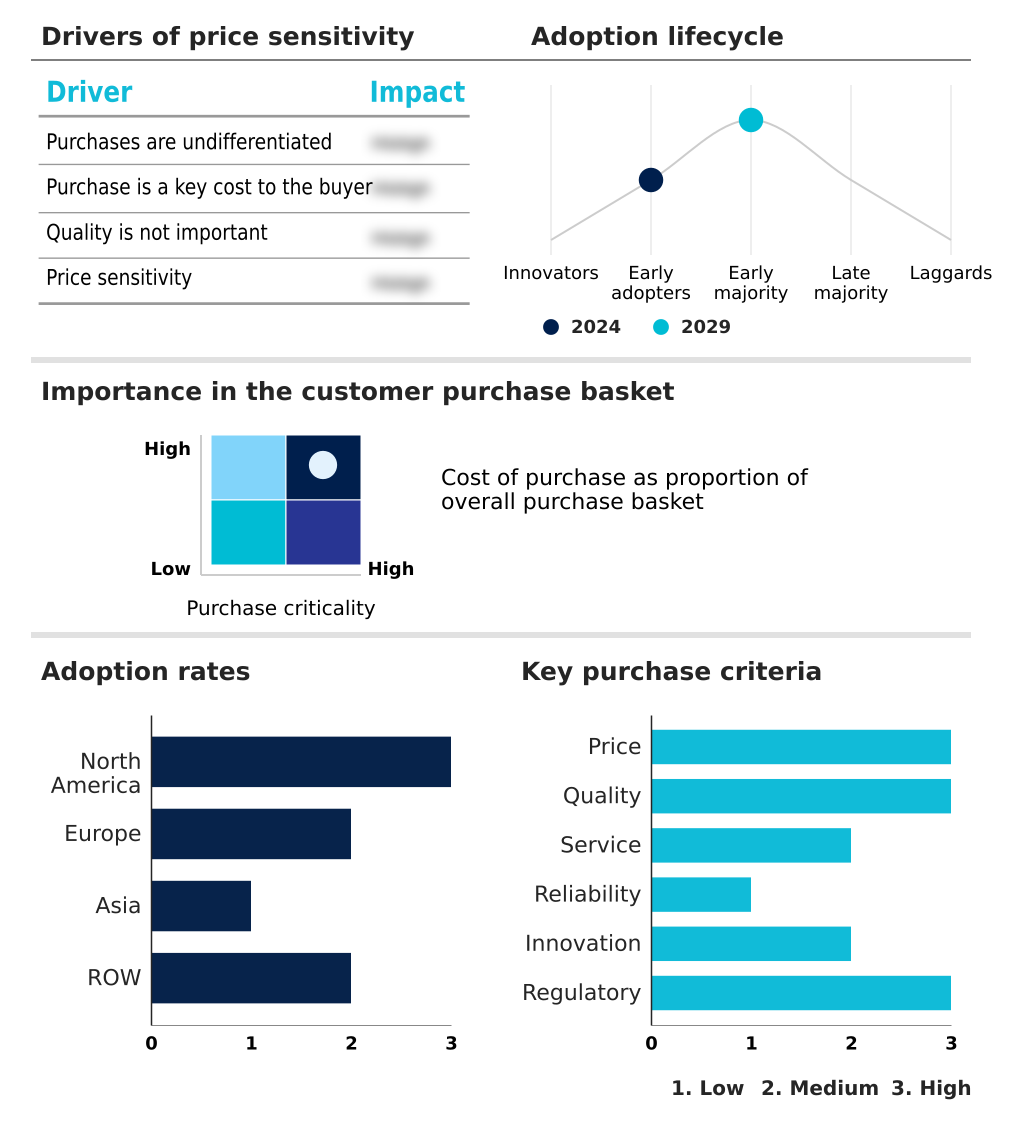
The open system mri market forecasting report includes the adoption lifecycle of the market, covering from the innovator’s stage to the laggard’s stage. It focuses on adoption rates in different regions based on penetration. Furthermore, the open system mri market report also includes key purchase criteria and drivers of price sensitivity to help companies evaluate and develop their market growth analysis strategies.

Customer Landscape of Open System MRI Industry

Competitive Landscape

Companies are implementing various strategies, such as strategic alliances, open system mri market forecast, partnerships, mergers and acquisitions, geographical expansion, and product/service launches, to enhance their presence in the industry.

Alltech Inc. - Key offerings are centered on advanced open MRI systems that enhance diagnostic accuracy and patient comfort, expanding clinical applications in neurology and oncology.

The industry research and growth report includes detailed analyses of the competitive landscape of the market and information about key companies, including:

  • Alltech Inc.
  • ASG Superconductors Spa
  • Aspect Imaging Ltd.
  • AURORA HEALTHCARE US Corp.
  • Beijing Wandong Medical Technology Co. Ltd.
  • Canon Inc.
  • Esaote Spa
  • FONAR Corp.
  • FUJIFILM Holdings Corp.
  • General Electric Co.
  • Hitachi Ltd.
  • Koninklijke Philips NV
  • Medonica Co. Ltd.
  • Neusoft Corp.
  • Siemens AG
  • Toshiba Corp.

Qualitative and quantitative analysis of companies has been conducted to help clients understand the wider business environment as well as the strengths and weaknesses of key industry players. Data is qualitatively analyzed to categorize companies as pure play, category-focused, industry-focused, and diversified; it is quantitatively analyzed to categorize companies as dominant, leading, strong, tentative, and weak.

Recent Development and News in Open system mri market

  • In November 2024, Siemens AG announced the launch of the MAGNETOM Aura, a next-generation 1.5T open MRI system featuring a cryogen-free superconducting magnet and an AI-powered reconstruction engine that reduces scan times by up to 40%.
  • In January 2025, Koninklijke Philips NV entered into a strategic partnership with NVIDIA to integrate the NVIDIA Clara Holoscan platform into its next-generation open MRI systems, aiming to accelerate real-time image processing and enable AI-assisted diagnostics at the edge.
  • In March 2025, FONAR Corp. received FDA 510(k) clearance for its new motion-compensated imaging software suite for its Upright Multi-Position MRI, allowing for high-resolution scans of patients in weight-bearing positions to better diagnose spinal instabilities.
  • In May 2025, Hitachi Ltd. announced the opening of a new manufacturing and R&D facility in Singapore, dedicated to producing its latest line of mid-field open MRI systems tailored for the specific clinical and economic needs of the Southeast Asian market.

Dive into Technavio’s robust research methodology, blending expert interviews, extensive data synthesis, and validated models for unparalleled Open System MRI Market insights. See full methodology.

Market Scope
Page number 290
Base year 2024
Historic period 2019-2023
Forecast period 2025-2029
Growth momentum & CAGR Accelerate at a CAGR of 4.6%
Market growth 2025-2029 USD 288.5 million
Market structure Fragmented
YoY growth 2024-2025(%) 4.4%
Key countries US, Canada, Mexico, Germany, UK, France, Italy, Spain, The Netherlands, China, India, Japan, South Korea, Thailand, Indonesia, Brazil, Saudi Arabia, UAE, Turkey, Argentina, Colombia, South Africa and Israel
Competitive landscape Leading Companies, Market Positioning of Companies, Competitive Strategies, and Industry Risks

Request Free Sample

Research Analyst Overview

  • The open system MRI market is advancing beyond its traditional role of accommodating claustrophobic patients. The integration of advanced imaging sequences and sophisticated image reconstruction engine technology in both low-field MRI scanner and high-field open MRI systems is enhancing diagnostic capabilities.
  • At a technical level, innovations in gradient coil design, radiofrequency coil technology, and cryogen-free magnet engineering are central to this evolution. A high-field open MRI utilizing a superconducting magnet now rivals closed-bore systems in certain applications, while permanent magnet MRI and hybrid MRI systems offer cost-effective alternatives.
  • For boardroom consideration, the adoption of AI-enabled reconstruction is a strategic imperative, directly impacting operational budgets. The use of simultaneous multi-slice imaging and motion correction algorithms has demonstrated a 25% reduction in non-diagnostic scans, reducing repeat appointments and increasing asset utilization.
  • Advanced applications like diffusion tensor imaging, blood oxygenation level dependent imaging, and dynamic contrast-enhanced MRI are becoming standard, while the upright MRI scanner with its vertical field magnet opens new diagnostic pathways. This push towards higher performance, evident in improved signal-to-noise ratio and magnetic field homogeneity, is making wide-bore MRI a cornerstone of modern radiology.

What are the Key Data Covered in this Open System MRI Market Research and Growth Report?

  • What is the expected growth of the Open System MRI Market between 2025 and 2029?

    • USD 288.5 million, at a CAGR of 4.6%

  • What segmentation does the market report cover?

    • The report is segmented by Type (Low field scanner, Medium field scanner, and High field scanner), Technology (Superconducting magnet, Permanent magnet, and Hybrid systems), End-user (Neurology, Oncology, Cardiology, and Others) and Geography (North America, Europe, Asia, Rest of World (ROW))

  • Which regions are analyzed in the report?

    • North America, Europe, Asia and Rest of World (ROW)

  • What are the key growth drivers and market challenges?

    • Increasing prevalence of diseases coupled with growing geriatric population, High cost of MRI

  • Who are the major players in the Open System MRI Market?

    • Alltech Inc., ASG Superconductors Spa, Aspect Imaging Ltd., AURORA HEALTHCARE US Corp., Beijing Wandong Medical Technology Co. Ltd., Canon Inc., Esaote Spa, FONAR Corp., FUJIFILM Holdings Corp., General Electric Co., Hitachi Ltd., Koninklijke Philips NV, Medonica Co. Ltd., Neusoft Corp., Siemens AG and Toshiba Corp.

Market Research Insights

  • The market's momentum is increasingly tied to demonstrating value beyond patient comfort. A strong focus on patient-centric design has led to measurable improvements in care, with some facilities reporting a 25% reduction in aborted scans due to claustrophobia reduction.
  • Innovations are also targeting clinical workflow efficiency, as AI-driven protocols have been shown to accelerate patient throughput improvement by over 30% for routine examinations. This aligns with the principles of value-based healthcare by linking technological investment to operational cost reduction.
  • Furthermore, systems tailored for bariatric patient imaging are expanding service access, contributing to greater diagnostic confidence across a wider patient demographic and reinforcing the strategic importance of open architecture in modern radiology.

We can help! Our analysts can customize this open system mri market research report to meet your requirements.

Get in touch

1. Executive Summary

1.1 Market overview

Executive Summary - Chart on Market Overview
Executive Summary - Data Table on Market Overview
Executive Summary - Chart on Global Market Characteristics
Executive Summary - Chart on Market by Geography
Executive Summary - Chart on Market Segmentation by Type
Executive Summary - Chart on Market Segmentation by Technology
Executive Summary - Chart on Market Segmentation by End-user
Executive Summary - Chart on Incremental Growth
Executive Summary - Data Table on Incremental Growth
Executive Summary - Chart on Company Market Positioning

2. Technavio Analysis

2.1 Analysis of price sensitivity, lifecycle, customer purchase basket, adoption rates, and purchase criteria

2.2 Criticality of inputs and Factors of differentiation

Chart on Overview on criticality of inputs and factors of differentiation

2.3 Factors of disruption

Chart on Overview on factors of disruption

2.4 Impact of drivers and challenges

Chart on Impact of drivers and challenges in 2024 and 2029

3. Market Landscape

3.1 Market ecosystem

Chart on Parent Market
Data Table on - Parent Market

3.2 Market characteristics

Chart on Market characteristics analysis

3.3 Value chain analysis

Chart on Value chain analysis

4. Market Sizing

4.1 Market definition

Data Table on Offerings of companies included in the market definition

4.2 Market segment analysis

Market segments

4.3 Market size 2024

4.4 Market outlook: Forecast for 2024-2029

Chart on Global - Market size and forecast 2024-2029 ($ million)
Data Table on Global - Market size and forecast 2024-2029 ($ million)
Chart on Global Market: Year-over-year growth 2024-2029 (%)
Data Table on Global Market: Year-over-year growth 2024-2029 (%)

5. Historic Market Size

5.1 Global Open System MRI Market 2019 - 2023

Historic Market Size - Data Table on Global Open System MRI Market 2019 - 2023 ($ million)

5.2 Type segment analysis 2019 - 2023

Historic Market Size - Type Segment 2019 - 2023 ($ million)

5.3 Technology segment analysis 2019 - 2023

Historic Market Size - Technology Segment 2019 - 2023 ($ million)

5.4 End-user segment analysis 2019 - 2023

Historic Market Size - End-user Segment 2019 - 2023 ($ million)

5.5 Geography segment analysis 2019 - 2023

Historic Market Size - Geography Segment 2019 - 2023 ($ million)

5.6 Country segment analysis 2019 - 2023

Historic Market Size - Country Segment 2019 - 2023 ($ million)

6. Qualitative Analysis

6.1 The AI impact on Global Open System MRI Market

7. Five Forces Analysis

7.1 Five forces summary

Five forces analysis - Comparison between 2024 and 2029

7.2 Bargaining power of buyers

Bargaining power of buyers - Impact of key factors 2024 and 2029

7.3 Bargaining power of suppliers

Bargaining power of suppliers - Impact of key factors in 2024 and 2029

7.4 Threat of new entrants

Threat of new entrants - Impact of key factors in 2024 and 2029

7.5 Threat of substitutes

Threat of substitutes - Impact of key factors in 2024 and 2029

7.6 Threat of rivalry

Threat of rivalry - Impact of key factors in 2024 and 2029

7.7 Market condition

Chart on Market condition - Five forces 2024 and 2029

8. Market Segmentation by Type

8.1 Market segments

Chart on Type - Market share 2024-2029 (%)
Data Table on Type - Market share 2024-2029 (%)

8.2 Comparison by Type

Chart on Comparison by Type
Data Table on Comparison by Type

8.3 Low field scanner - Market size and forecast 2024-2029

Chart on Low field scanner - Market size and forecast 2024-2029 ($ million)
Data Table on Low field scanner - Market size and forecast 2024-2029 ($ million)
Chart on Low field scanner - Year-over-year growth 2024-2029 (%)
Data Table on Low field scanner - Year-over-year growth 2024-2029 (%)

8.4 Medium field scanner - Market size and forecast 2024-2029

Chart on Medium field scanner - Market size and forecast 2024-2029 ($ million)
Data Table on Medium field scanner - Market size and forecast 2024-2029 ($ million)
Chart on Medium field scanner - Year-over-year growth 2024-2029 (%)
Data Table on Medium field scanner - Year-over-year growth 2024-2029 (%)

8.5 High field scanner - Market size and forecast 2024-2029

Chart on High field scanner - Market size and forecast 2024-2029 ($ million)
Data Table on High field scanner - Market size and forecast 2024-2029 ($ million)
Chart on High field scanner - Year-over-year growth 2024-2029 (%)
Data Table on High field scanner - Year-over-year growth 2024-2029 (%)

8.6 Market opportunity by Type

Market opportunity by Type ($ million)
Data Table on Market opportunity by Type ($ million)

9. Market Segmentation by Technology

9.1 Market segments

Chart on Technology - Market share 2024-2029 (%)
Data Table on Technology - Market share 2024-2029 (%)

9.2 Comparison by Technology

Chart on Comparison by Technology
Data Table on Comparison by Technology

9.3 Superconducting magnet - Market size and forecast 2024-2029

Chart on Superconducting magnet - Market size and forecast 2024-2029 ($ million)
Data Table on Superconducting magnet - Market size and forecast 2024-2029 ($ million)
Chart on Superconducting magnet - Year-over-year growth 2024-2029 (%)
Data Table on Superconducting magnet - Year-over-year growth 2024-2029 (%)

9.4 Permanent magnet - Market size and forecast 2024-2029

Chart on Permanent magnet - Market size and forecast 2024-2029 ($ million)
Data Table on Permanent magnet - Market size and forecast 2024-2029 ($ million)
Chart on Permanent magnet - Year-over-year growth 2024-2029 (%)
Data Table on Permanent magnet - Year-over-year growth 2024-2029 (%)

9.5 Hybrid systems - Market size and forecast 2024-2029

Chart on Hybrid systems - Market size and forecast 2024-2029 ($ million)
Data Table on Hybrid systems - Market size and forecast 2024-2029 ($ million)
Chart on Hybrid systems - Year-over-year growth 2024-2029 (%)
Data Table on Hybrid systems - Year-over-year growth 2024-2029 (%)

9.6 Market opportunity by Technology

Market opportunity by Technology ($ million)
Data Table on Market opportunity by Technology ($ million)

10. Market Segmentation by End-user

10.1 Market segments

Chart on End-user - Market share 2024-2029 (%)
Data Table on End-user - Market share 2024-2029 (%)

10.2 Comparison by End-user

Chart on Comparison by End-user
Data Table on Comparison by End-user

10.3 Neurology - Market size and forecast 2024-2029

Chart on Neurology - Market size and forecast 2024-2029 ($ million)
Data Table on Neurology - Market size and forecast 2024-2029 ($ million)
Chart on Neurology - Year-over-year growth 2024-2029 (%)
Data Table on Neurology - Year-over-year growth 2024-2029 (%)

10.4 Oncology - Market size and forecast 2024-2029

Chart on Oncology - Market size and forecast 2024-2029 ($ million)
Data Table on Oncology - Market size and forecast 2024-2029 ($ million)
Chart on Oncology - Year-over-year growth 2024-2029 (%)
Data Table on Oncology - Year-over-year growth 2024-2029 (%)

10.5 Cardiology - Market size and forecast 2024-2029

Chart on Cardiology - Market size and forecast 2024-2029 ($ million)
Data Table on Cardiology - Market size and forecast 2024-2029 ($ million)
Chart on Cardiology - Year-over-year growth 2024-2029 (%)
Data Table on Cardiology - Year-over-year growth 2024-2029 (%)

10.6 Others - Market size and forecast 2024-2029

Chart on Others - Market size and forecast 2024-2029 ($ million)
Data Table on Others - Market size and forecast 2024-2029 ($ million)
Chart on Others - Year-over-year growth 2024-2029 (%)
Data Table on Others - Year-over-year growth 2024-2029 (%)

10.7 Market opportunity by End-user

Market opportunity by End-user ($ million)
Data Table on Market opportunity by End-user ($ million)

11. Customer Landscape

11.1 Customer landscape overview

Analysis of price sensitivity, lifecycle, customer purchase basket, adoption rates, and purchase criteria

12. Geographic Landscape

12.1 Geographic segmentation

Chart on Market share by geography 2024-2029 (%)
Data Table on Market share by geography 2024-2029 (%)

12.2 Geographic comparison

Chart on Geographic comparison
Data Table on Geographic comparison

12.3 North America - Market size and forecast 2024-2029

Chart on North America - Market size and forecast 2024-2029 ($ million)
Data Table on North America - Market size and forecast 2024-2029 ($ million)
Chart on North America - Year-over-year growth 2024-2029 (%)
Data Table on North America - Year-over-year growth 2024-2029 (%)
Chart on Regional Comparison - North America
Data Table on Regional Comparison - North America

12.3.1 US - Market size and forecast 2024-2029

Chart on US - Market size and forecast 2024-2029 ($ million)
Data Table on US - Market size and forecast 2024-2029 ($ million)
Chart on US - Year-over-year growth 2024-2029 (%)
Data Table on US - Year-over-year growth 2024-2029 (%)

12.3.2 Canada - Market size and forecast 2024-2029

Chart on Canada - Market size and forecast 2024-2029 ($ million)
Data Table on Canada - Market size and forecast 2024-2029 ($ million)
Chart on Canada - Year-over-year growth 2024-2029 (%)
Data Table on Canada - Year-over-year growth 2024-2029 (%)

12.3.3 Mexico - Market size and forecast 2024-2029

Chart on Mexico - Market size and forecast 2024-2029 ($ million)
Data Table on Mexico - Market size and forecast 2024-2029 ($ million)
Chart on Mexico - Year-over-year growth 2024-2029 (%)
Data Table on Mexico - Year-over-year growth 2024-2029 (%)

12.4 Europe - Market size and forecast 2024-2029

Chart on Europe - Market size and forecast 2024-2029 ($ million)
Data Table on Europe - Market size and forecast 2024-2029 ($ million)
Chart on Europe - Year-over-year growth 2024-2029 (%)
Data Table on Europe - Year-over-year growth 2024-2029 (%)
Chart on Regional Comparison - Europe
Data Table on Regional Comparison - Europe

12.4.1 Germany - Market size and forecast 2024-2029

Chart on Germany - Market size and forecast 2024-2029 ($ million)
Data Table on Germany - Market size and forecast 2024-2029 ($ million)
Chart on Germany - Year-over-year growth 2024-2029 (%)
Data Table on Germany - Year-over-year growth 2024-2029 (%)

12.4.2 UK - Market size and forecast 2024-2029

Chart on UK - Market size and forecast 2024-2029 ($ million)
Data Table on UK - Market size and forecast 2024-2029 ($ million)
Chart on UK - Year-over-year growth 2024-2029 (%)
Data Table on UK - Year-over-year growth 2024-2029 (%)

12.4.3 France - Market size and forecast 2024-2029

Chart on France - Market size and forecast 2024-2029 ($ million)
Data Table on France - Market size and forecast 2024-2029 ($ million)
Chart on France - Year-over-year growth 2024-2029 (%)
Data Table on France - Year-over-year growth 2024-2029 (%)

12.4.4 Italy - Market size and forecast 2024-2029

Chart on Italy - Market size and forecast 2024-2029 ($ million)
Data Table on Italy - Market size and forecast 2024-2029 ($ million)
Chart on Italy - Year-over-year growth 2024-2029 (%)
Data Table on Italy - Year-over-year growth 2024-2029 (%)

12.4.5 Spain - Market size and forecast 2024-2029

Chart on Spain - Market size and forecast 2024-2029 ($ million)
Data Table on Spain - Market size and forecast 2024-2029 ($ million)
Chart on Spain - Year-over-year growth 2024-2029 (%)
Data Table on Spain - Year-over-year growth 2024-2029 (%)

12.4.6 The Netherlands - Market size and forecast 2024-2029

Chart on The Netherlands - Market size and forecast 2024-2029 ($ million)
Data Table on The Netherlands - Market size and forecast 2024-2029 ($ million)
Chart on The Netherlands - Year-over-year growth 2024-2029 (%)
Data Table on The Netherlands - Year-over-year growth 2024-2029 (%)

12.5 Asia - Market size and forecast 2024-2029

Chart on Asia - Market size and forecast 2024-2029 ($ million)
Data Table on Asia - Market size and forecast 2024-2029 ($ million)
Chart on Asia - Year-over-year growth 2024-2029 (%)
Data Table on Asia - Year-over-year growth 2024-2029 (%)
Chart on Regional Comparison - Asia
Data Table on Regional Comparison - Asia

12.5.1 China - Market size and forecast 2024-2029

Chart on China - Market size and forecast 2024-2029 ($ million)
Data Table on China - Market size and forecast 2024-2029 ($ million)
Chart on China - Year-over-year growth 2024-2029 (%)
Data Table on China - Year-over-year growth 2024-2029 (%)

12.5.2 India - Market size and forecast 2024-2029

Chart on India - Market size and forecast 2024-2029 ($ million)
Data Table on India - Market size and forecast 2024-2029 ($ million)
Chart on India - Year-over-year growth 2024-2029 (%)
Data Table on India - Year-over-year growth 2024-2029 (%)

12.5.3 Japan - Market size and forecast 2024-2029

Chart on Japan - Market size and forecast 2024-2029 ($ million)
Data Table on Japan - Market size and forecast 2024-2029 ($ million)
Chart on Japan - Year-over-year growth 2024-2029 (%)
Data Table on Japan - Year-over-year growth 2024-2029 (%)

12.5.4 South Korea - Market size and forecast 2024-2029

Chart on South Korea - Market size and forecast 2024-2029 ($ million)
Data Table on South Korea - Market size and forecast 2024-2029 ($ million)
Chart on South Korea - Year-over-year growth 2024-2029 (%)
Data Table on South Korea - Year-over-year growth 2024-2029 (%)

12.5.5 Thailand - Market size and forecast 2024-2029

Chart on Thailand - Market size and forecast 2024-2029 ($ million)
Data Table on Thailand - Market size and forecast 2024-2029 ($ million)
Chart on Thailand - Year-over-year growth 2024-2029 (%)
Data Table on Thailand - Year-over-year growth 2024-2029 (%)

12.5.6 Indonesia - Market size and forecast 2024-2029

Chart on Indonesia - Market size and forecast 2024-2029 ($ million)
Data Table on Indonesia - Market size and forecast 2024-2029 ($ million)
Chart on Indonesia - Year-over-year growth 2024-2029 (%)
Data Table on Indonesia - Year-over-year growth 2024-2029 (%)

12.6 Rest of World (ROW) - Market size and forecast 2024-2029

Chart on Rest of World (ROW) - Market size and forecast 2024-2029 ($ million)
Data Table on Rest of World (ROW) - Market size and forecast 2024-2029 ($ million)
Chart on Rest of World (ROW) - Year-over-year growth 2024-2029 (%)
Data Table on Rest of World (ROW) - Year-over-year growth 2024-2029 (%)
Chart on Regional Comparison - Rest of World (ROW)
Data Table on Regional Comparison - Rest of World (ROW)

12.6.1 Brazil - Market size and forecast 2024-2029

Chart on Brazil - Market size and forecast 2024-2029 ($ million)
Data Table on Brazil - Market size and forecast 2024-2029 ($ million)
Chart on Brazil - Year-over-year growth 2024-2029 (%)
Data Table on Brazil - Year-over-year growth 2024-2029 (%)

12.6.2 Saudi Arabia - Market size and forecast 2024-2029

Chart on Saudi Arabia - Market size and forecast 2024-2029 ($ million)
Data Table on Saudi Arabia - Market size and forecast 2024-2029 ($ million)
Chart on Saudi Arabia - Year-over-year growth 2024-2029 (%)
Data Table on Saudi Arabia - Year-over-year growth 2024-2029 (%)

12.6.3 UAE - Market size and forecast 2024-2029

Chart on UAE - Market size and forecast 2024-2029 ($ million)
Data Table on UAE - Market size and forecast 2024-2029 ($ million)
Chart on UAE - Year-over-year growth 2024-2029 (%)
Data Table on UAE - Year-over-year growth 2024-2029 (%)

12.6.4 Turkey - Market size and forecast 2024-2029

Chart on Turkey - Market size and forecast 2024-2029 ($ million)
Data Table on Turkey - Market size and forecast 2024-2029 ($ million)
Chart on Turkey - Year-over-year growth 2024-2029 (%)
Data Table on Turkey - Year-over-year growth 2024-2029 (%)

12.6.5 Argentina - Market size and forecast 2024-2029

Chart on Argentina - Market size and forecast 2024-2029 ($ million)
Data Table on Argentina - Market size and forecast 2024-2029 ($ million)
Chart on Argentina - Year-over-year growth 2024-2029 (%)
Data Table on Argentina - Year-over-year growth 2024-2029 (%)

12.6.6 Colombia - Market size and forecast 2024-2029

Chart on Colombia - Market size and forecast 2024-2029 ($ million)
Data Table on Colombia - Market size and forecast 2024-2029 ($ million)
Chart on Colombia - Year-over-year growth 2024-2029 (%)
Data Table on Colombia - Year-over-year growth 2024-2029 (%)

12.6.7 South Africa - Market size and forecast 2024-2029

Chart on South Africa - Market size and forecast 2024-2029 ($ million)
Data Table on South Africa - Market size and forecast 2024-2029 ($ million)
Chart on South Africa - Year-over-year growth 2024-2029 (%)
Data Table on South Africa - Year-over-year growth 2024-2029 (%)

12.6.8 Israel - Market size and forecast 2024-2029

Chart on Israel - Market size and forecast 2024-2029 ($ million)
Data Table on Israel - Market size and forecast 2024-2029 ($ million)
Chart on Israel - Year-over-year growth 2024-2029 (%)
Data Table on Israel - Year-over-year growth 2024-2029 (%)

12.7 Market opportunity by geography

Market opportunity by geography ($ million)
Data Tables on Market opportunity by geography ($ million)

13. Drivers, Challenges, and Opportunity

13.1 Market drivers

Increasing prevalence of diseases coupled with growing geriatric population
Expanding clinical applications of open system MRI
Technological advances in MRIs strength

13.2 Market challenges

High cost of MRI
Lower signal-to-noise ratio
Shortage of skilled professionals to handle advanced open system MRI

13.3 Impact of drivers and challenges

Impact of drivers and challenges in 2024 and 2029

13.4 Market opportunities

Software advancement in MRI technology
Emerging potential market in Asia
Focus on development of helium-free open system MRI

14. Competitive Landscape

14.1 Overview

14.2

Overview on criticality of inputs and factors of differentiation

14.3 Landscape disruption

Overview on factors of disruption

14.4 Industry risks

Impact of key risks on business

15. Competitive Analysis

15.1 Companies profiled

Companies covered

15.2 Company ranking index

15.3 Market positioning of companies

Matrix on companies position and classification

15.4 Alltech Inc.

Alltech Inc. - Overview
Alltech Inc. - Product / Service
Alltech Inc. - Key news
Alltech Inc. - Key offerings
SWOT

15.5 ASG Superconductors Spa

ASG Superconductors Spa - Overview
ASG Superconductors Spa - Product / Service
ASG Superconductors Spa - Key offerings
SWOT

15.6 Aspect Imaging Ltd.

Aspect Imaging Ltd. - Overview
Aspect Imaging Ltd. - Product / Service
Aspect Imaging Ltd. - Key offerings
SWOT

15.7 AURORA HEALTHCARE US Corp.

AURORA HEALTHCARE US Corp. - Overview
AURORA HEALTHCARE US Corp. - Product / Service
AURORA HEALTHCARE US Corp. - Key offerings
SWOT

15.8 Beijing Wandong Medical Technology Co. Ltd.

Beijing Wandong Medical Technology Co. Ltd. - Overview
Beijing Wandong Medical Technology Co. Ltd. - Product / Service
Beijing Wandong Medical Technology Co. Ltd. - Key offerings
SWOT

15.9 Canon Inc.

Canon Inc. - Overview
Canon Inc. - Business segments
Canon Inc. - Key news
Canon Inc. - Key offerings
Canon Inc. - Segment focus
SWOT

15.10 Esaote Spa

Esaote Spa - Overview
Esaote Spa - Product / Service
Esaote Spa - Key offerings
SWOT

15.11 FONAR Corp.

FONAR Corp. - Overview
FONAR Corp. - Product / Service
FONAR Corp. - Key offerings
SWOT

15.12 FUJIFILM Holdings Corp.

FUJIFILM Holdings Corp. - Overview
FUJIFILM Holdings Corp. - Business segments
FUJIFILM Holdings Corp. - Key news
FUJIFILM Holdings Corp. - Key offerings
FUJIFILM Holdings Corp. - Segment focus
SWOT

15.13 General Electric Co.

General Electric Co. - Overview
General Electric Co. - Business segments
General Electric Co. - Key news
General Electric Co. - Key offerings
General Electric Co. - Segment focus
SWOT

15.14 Hitachi Ltd.

Hitachi Ltd. - Overview
Hitachi Ltd. - Business segments
Hitachi Ltd. - Key news
Hitachi Ltd. - Key offerings
Hitachi Ltd. - Segment focus
SWOT

15.15 Koninklijke Philips NV

Koninklijke Philips NV - Overview
Koninklijke Philips NV - Business segments
Koninklijke Philips NV - Key news
Koninklijke Philips NV - Key offerings
Koninklijke Philips NV - Segment focus
SWOT

15.16 Neusoft Corp.

Neusoft Corp. - Overview
Neusoft Corp. - Product / Service
Neusoft Corp. - Key offerings
SWOT

15.17 Siemens AG

Siemens AG - Overview
Siemens AG - Business segments
Siemens AG - Key news
Siemens AG - Key offerings
Siemens AG - Segment focus
SWOT

15.18 Toshiba Corp.

Toshiba Corp. - Overview
Toshiba Corp. - Business segments
Toshiba Corp. - Key news
Toshiba Corp. - Key offerings
Toshiba Corp. - Segment focus
SWOT

16. Appendix

16.1 Scope of the report

Market definition
Objectives
Notes and caveats

16.2 Inclusions and exclusions checklist

Inclusions checklist
Exclusions checklist

16.3 Currency conversion rates for US$

16.4 Research methodology

16.5 Data procurement

Information sources

16.6 Data validation

16.7 Validation techniques employed for market sizing

16.8 Data synthesis

16.9 360 degree market analysis

16.10 List of abbreviations

Research Methodology

Technavio presents a detailed picture of the market by way of study, synthesis, and summation of data from multiple sources. The analysts have presented the various facets of the market with a particular focus on identifying the key industry influencers. The data thus presented is comprehensive, reliable, and the result of extensive research, both primary and secondary.

INFORMATION SOURCES

Primary sources

  • Manufacturers and suppliers
  • Channel partners
  • Industry experts
  • Strategic decision makers

Secondary sources

  • Industry journals and periodicals
  • Government data
  • Financial reports of key industry players
  • Historical data
  • Press releases

DATA ANALYSIS

Data Synthesis

  • Collation of data
  • Estimation of key figures
  • Analysis of derived insights

Data Validation

  • Triangulation with data models
  • Reference against proprietary databases
  • Corroboration with industry experts

REPORT WRITING

Qualitative

  • Market drivers
  • Market challenges
  • Market trends
  • Five forces analysis

Quantitative

  • Market size and forecast
  • Market segmentation
  • Geographical insights
  • Competitive landscape

Interested in this report?

Get your sample now to see our research methodology and insights!

Download Now

Frequently Asked Questions

Open System MRI market growth will increase by USD 288.5 million during 2025-2029 .

The Open System MRI market is expected to grow at a CAGR of 4.6% during 2025-2029 .

Open System MRI market is segmented by Type (Low field scanner, Medium field scanner, High field scanner) Technology (Superconducting magnet, Permanent magnet, Hybrid systems) End-user (Neurology, Oncology, Cardiology, Others)

Alltech Inc., ASG Superconductors Spa, Aspect Imaging Ltd., AURORA HEALTHCARE US Corp., Beijing Wandong Medical Technology Co. Ltd., Canon Inc., Esaote Spa, FONAR Corp., FUJIFILM Holdings Corp., General Electric Co., Hitachi Ltd., Koninklijke Philips NV, Medonica Co. Ltd., Neusoft Corp., Siemens AG, Toshiba Corp. are a few of the key vendors in the Open System MRI market.

North America will register the highest growth rate of 36.8% among the other regions. Therefore, the Open System MRI market in North America is expected to garner significant business opportunities for the vendors during the forecast period.

US, Canada, Mexico, Germany, UK, France, Italy, Spain, The Netherlands, China, India, Japan, South Korea, Thailand, Indonesia, Brazil, Saudi Arabia, UAE, Turkey, Argentina, Colombia, South Africa, Israel

  • Increasing prevalence of diseases coupled with growing geriatric population is the driving factor this market.

The Open System MRI market vendors should focus on grabbing business opportunities from the Type segment as it accounted for the largest market share in the base year.