Organic Dyes Market Size 2025-2029
The organic dyes market size is forecast to increase by USD 1.31 billion at a CAGR of 5.8% between 2024 and 2029.
- The market is experiencing significant growth, driven by the rising awareness and preference for organic and natural dyes. Consumers are increasingly conscious of the environmental impact of synthetic dyes and are seeking sustainable alternatives. This trend is further fueled by innovations in dyeing technologies, which enable the production of brighter and more vibrant colors from organic sources. However, the high costs associated with organic dyes pose a significant challenge for market growth. Producers must find ways to reduce production costs while maintaining quality and sustainability to remain competitive.
- Additionally, meeting the increasing demand for organic dyes requires significant investment in research and development to improve efficiency and scalability. Companies that can effectively navigate these challenges and capitalize on the growing demand for organic dyes will be well-positioned to succeed in this market.
What will be the Size of the Organic Dyes Market during the forecast period?

- Organic dyes continue to gain momentum in various industries, with textiles leading the charge. The dynamic nature of the market is driven by the evolving preferences for eco-friendly and sustainable products. Acid dyes, a type of organic dye, have found extensive applications in textiles due to their ability to form strong chemical bonds with fibers, ensuring durability and vibrant colors. Simultaneously, reactive dyes, another organic dye variant, have been instrumental in the pulp industries, contributing to the production of paper with enhanced aesthetic appeal. The availability of organic dyes in grams and pounds caters to the diverse requirements of industries, from cotton textiles to synthetic dyes for roof tiles.
- Moreover, soluble organic dyes have been gaining traction in sectors like floor tiles and printing inks, offering advantages such as ease of application and superior color consistency. The surge in demand for organic dyes is driven by factors like increased investment in research and development activities and the growing consumer awareness towards health and environmental concerns. Organic dyes, derived from natural substances, offer several advantages over synthetic dyes. They are known for their eco-friendliness and reduced risk of allergic reactions. However, the raw materials used in organic dyes may vary based on the product type, with some derived from carbon-based molecules and others from natural sources.
- The ongoing evolution of the market is marked by continuous innovation and the introduction of new products. For instance, water-based inks have gained popularity in Digital textile printing, offering advantages like reduced environmental impact and improved color accuracy. In summary, the market is a dynamic and evolving landscape, with various sectors adopting organic dyes for their unique properties and benefits. From textiles and pulp industries to roof tiles and printing inks, organic dyes continue to unfold new possibilities and patterns, driven by consumer preferences, technological advancements, and investment in research and development activities.
How is this Organic Dyes Industry segmented?
The organic dyes industry research report provides comprehensive data (region-wise segment analysis), with forecasts and estimates in "USD million" for the period 2025-2029, as well as historical data from 2019-2023 for the following segments.
- Source
- Plants
- Animals
- Others
- End-user
- Paints and coatings
- Textiles
- Printing inks
- Plastics
- Others
- Product Type
- Reactive
- Acid
- Basic
- Disperse
- Others
- Distribution Channel
- Direct Sales
- Distributors
- Online Platforms
- Retail Stores
- Others
- Geography
- North America
- US
- Canada
- Europe
- France
- Germany
- Italy
- UK
- Middle East and Africa
- Egypt
- KSA
- Oman
- UAE
- APAC
- China
- India
- Japan
- South America
- Argentina
- Brazil
- Rest of World (ROW)
- North America
By Source Insights
The plants segment is estimated to witness significant growth during the forecast period.
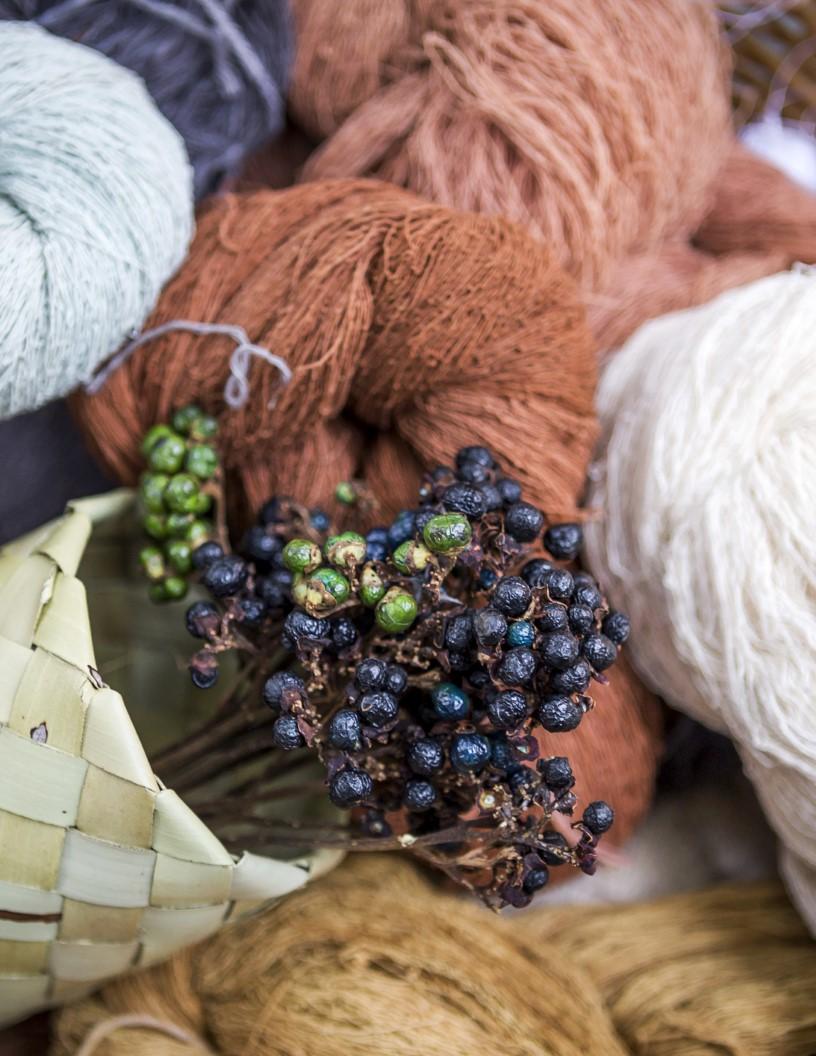
Organic dyes, derived from natural sources, have gained popularity due to their aesthetic appeal and eco-friendly nature. Among these, plant-based dyes have a long-standing history in various industries. Henna, derived from the leaves of Lawsonia inermis, offers an orangish-yellow color and is commonly used for dying silk and woolen fibers. Indigo, known as the king of natural dyes, imparts a blue hue and is widely used across industries. Masonry and paper industries utilize vat dyes, which are insoluble in water and require a mordant to bind the dye to the substance. Inorganic dyes, on the other hand, are derived from minerals and are known for their durability.
However, they pose potential health risks, including vomiting and abdominal distension. The driving force behind the surge in demand for organic dyes is the growing awareness of allergic reactions to synthetic dyes and the need for eco-friendly products. Research and development activities have led to advancements in digital textile printing and mordant dyes, making organic dyes increasingly accessible to industries such as textiles, pulp, and floor and roof tiles. Organic dyes are available in various forms, including water-based inks and reactive dyes. These dyes are used in various applications, from textiles and printing inks to floor and roof tiles.
The availability of raw materials and the investment in research and development activities have propelled the market, with industry players focusing on carbon-based molecules and carbon atoms to create eco-friendly products. Despite the benefits, organic dyes face challenges, such as their higher cost compared to synthetic dyes and their limited availability in certain colors. However, the durability and safety of organic dyes make them a preferred choice for industries and consumers seeking sustainable and safe dyeing practices. Infants' clothing and textiles, in particular, have seen a significant shift towards organic dyes due to concerns over potential health risks associated with synthetic dyes.
In conclusion, the market is evolving, with a focus on sustainable and eco-friendly practices. Plant-based dyes, such as henna and indigo, offer a rich history and a natural alternative to synthetic dyes. The availability of raw materials, investment in research and development activities, and growing consumer awareness are driving the market forward. However, challenges such as higher costs and limited availability in certain colors remain. Nonetheless, the benefits of organic dyes, including their durability and safety, make them a preferred choice for various industries and consumers.
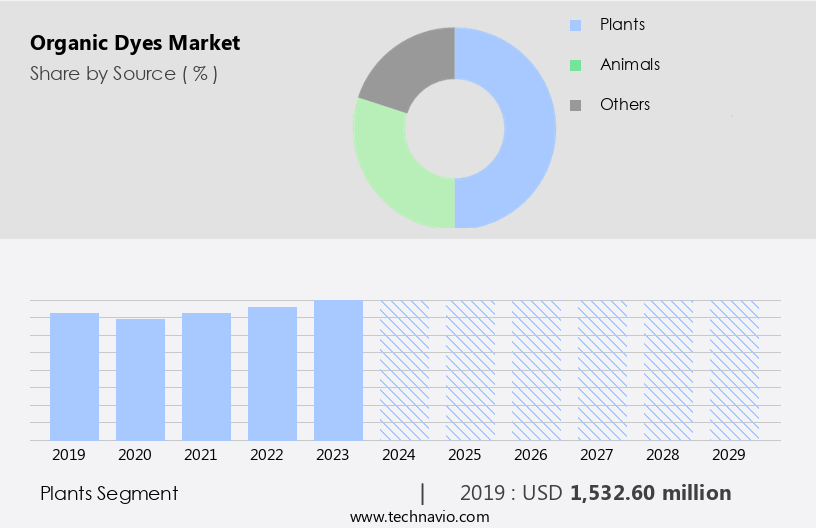
The Plants segment was valued at USD 1.53 billion in 2019 and showed a gradual increase during the forecast period.
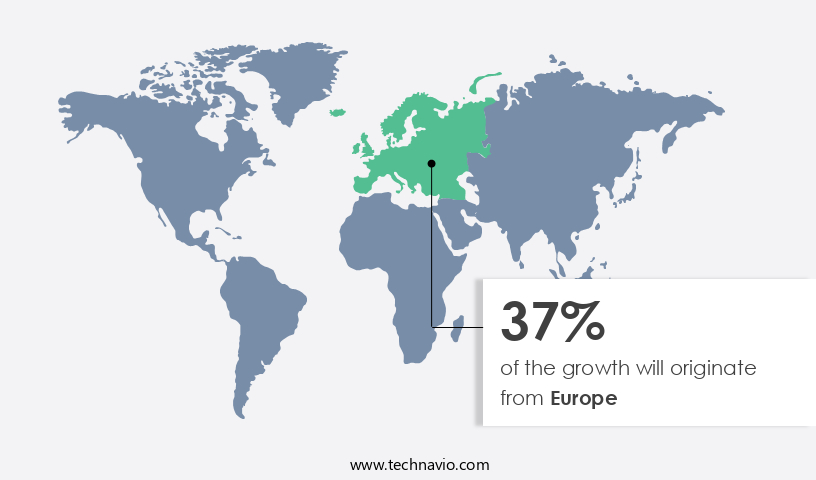
Regional Analysis
Europe is estimated to contribute 37% to the growth of the global market during the forecast period.Technavio's analysts have elaborately explained the regional trends and drivers that shape the market during the forecast period.
The market experiences notable growth, particularly in the Asia Pacific (APAC) region. Textiles and garment industries, primarily in China, India, and Bangladesh, significantly drive demand for organic dyes. The vast scale of these industries and the regions expanding population fuel the markets expansion. Advanced manufacturing infrastructure in countries like China, India, and Japan, established through substantial investment, enables production of superior quality organic dyes at competitive prices. Organic dyes appeal to consumers due to their eco-friendly nature, as they are derived from natural substances. In contrast, inorganic dyes contain synthetic compounds, which can lead to allergic reactions and health issues, such as cyanosis, vomiting, and abdominal distension.
Organic dyes offer enhanced durability for various applications, including masonry, paper, floor tiles, walls, and digital textile printing. In the textile sector, organic dyes are increasingly preferred for their superior colorfastness and reduced environmental impact. In the pulp industries, organic dyes are used for water-based inks, contributing to the markets surge in demand. The availability of organic dyes in various product types, such as acid dyes, reactive dyes, and mordant dyes, caters to the diverse needs of industries. Research and development activities continue to play a crucial role in the market, driving innovation and improving the performance and sustainability of organic dyes.
The market is expected to witness continued growth, as industries and consumers increasingly prioritize eco-friendly products and raw materials.
Market Dynamics
Our researchers analyzed the data with 2024 as the base year, along with the key drivers, trends, and challenges. A holistic analysis of drivers will help companies refine their marketing strategies to gain a competitive advantage.
What are the key market drivers leading to the rise in the adoption of Organic Dyes Industry?
- The increasing consciousness regarding the utilization of organic and natural dyes serves as the primary catalyst for market growth.
- Organic and natural dyes have emerged as a preferred choice in various industries due to growing health and environmental concerns associated with synthetic dyes. The aesthetic appeal of organic dyes, derived from natural substances, offers a more sustainable and eco-friendly alternative. Unlike inorganic dyes, which contain harmful chemicals that can cause skin irritation, allergies, and even more serious health issues, organic dyes pose minimal health risks. This driving force behind the increasing popularity of organic dyes is evident in industries such as textiles, paper, masonry, and floor tiles.
- The formation of chemical bonds in organic dyes is more stable, reducing the likelihood of health hazards. While the total cost of organic dyes may be higher than their synthetic counterparts, the long-term benefits to both human health and the environment make them a worthwhile investment.
What are the market trends shaping the Organic Dyes Industry?
- The trend in the textile industry is being shaped by advances in dyeing technologies. Innovations in this field are mandatory for staying competitive in the market.
- The market is experiencing significant innovation, driven by the increasing demand for sustainable and eco-friendly coloring solutions. One such advancement is the adoption of digital textile printing. This technology offers precise, on-demand color application, minimizing the use and wastage of resources such as dyes and water. In contrast to traditional dyeing methods that require large water baths and excessive dye usage, resulting in significant wastage, digital printing is a sustainable and cost-effective alternative. Additionally, the durability of organic dyes used in digital printing is a significant advantage, ensuring the vibrancy of colors remains intact even after multiple washes.
- Furthermore, research and development activities in the organic dyes sector continue to unveil new mordant dyes derived from natural sources, catering to the growing preference for infants' clothing and wall paints free from synthetic dyes and their associated health risks, such as abdominal distension and cyanosis.
What challenges does the Organic Dyes Industry face during its growth?
- The organic dyes industry faces significant growth impediments due to the high costs associated with their production and use.
- Organic dyes, derived from natural sources, are more costly to produce compared to synthetic dyes due to the scarcity and intricate process of obtaining their raw materials. For instance, indigo, a blue dye, is derived from the leaves of the indigo plant, primarily grown in tropical climates. Harvesting these leaves is a labor-intensive process, and the raw ingredients must undergo extensive processing to create the dye. The availability of these raw materials is limited, which increases their cost. In textile and pulp industries, where cost is a significant factor, the higher cost of organic dyes can make synthetic dyes a more attractive option.
- Despite this challenge, the demand for organic dyes is increasing due to their eco-friendly properties and consumer preference for sustainable products. In textiles, organic dyes are used for cotton and other natural fibers, while in non-textile applications, they are used in roof tiles and various other industries. Overall, the production of organic dyes is a complex and time-consuming process, contributing to their higher cost.
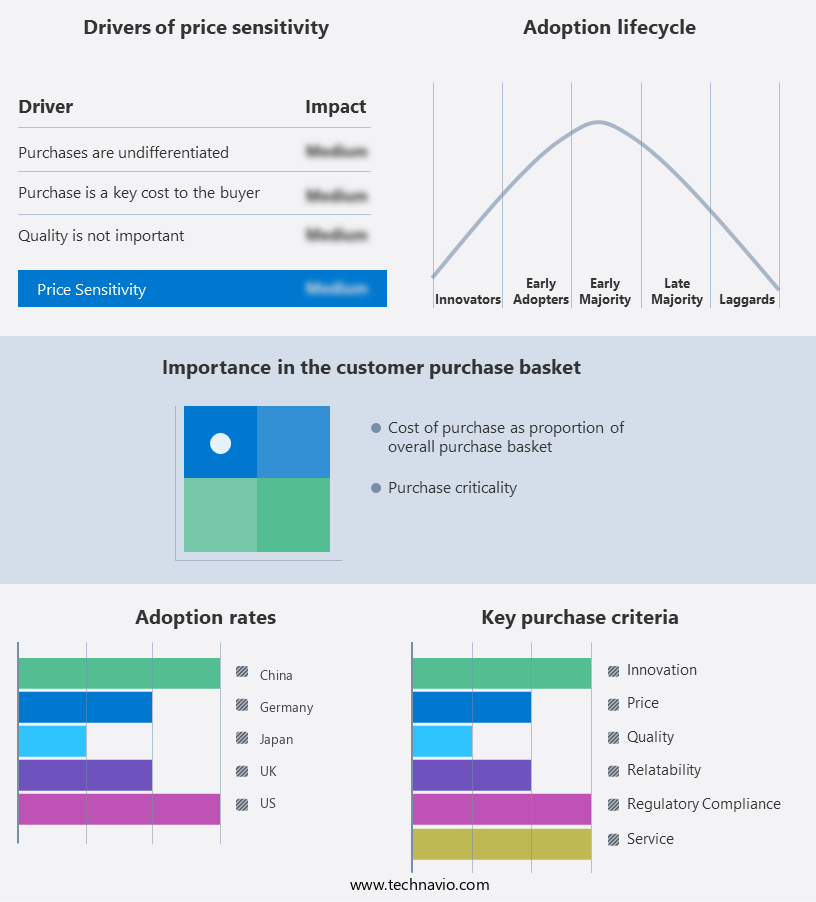
Exclusive Customer Landscape
The organic dyes market forecasting report includes the adoption lifecycle of the market, covering from the innovator's stage to the laggard's stage. It focuses on adoption rates in different regions based on penetration. Furthermore, the organic dyes market report also includes key purchase criteria and drivers of price sensitivity to help companies evaluate and develop their market growth analysis strategies.
Customer Landscape
Key Companies & Market Insights
Companies are implementing various strategies, such as strategic alliances, organic dyes market forecast, partnerships, mergers and acquisitions, geographical expansion, and product/service launches, to enhance their presence in the industry.
The industry research and growth report includes detailed analyses of the competitive landscape of the market and information about key companies, including:
- Archroma
- Atul Ltd.
- BASF SE
- CATHAY Industries
- Clariant AG
- DIC Corporation
- DyStar Group
- Everlight Chemical
- Huntsman Corporation
- Jiangsu Yabang Dyestuff
- Jihua Group
- Kiri Industries
- Kyung-In Synthetic Corporation
- LANXESS AG
- Nippon Kayaku
- Organic Dyes and Pigments
- Synthesia
- Sumitomo Chemical
- Toyo Ink SC Holdings
- Zhejiang Longsheng Group
- Zhejiang Runtu
Qualitative and quantitative analysis of companies has been conducted to help clients understand the wider business environment as well as the strengths and weaknesses of key industry players. Data is qualitatively analyzed to categorize companies as pure play, category-focused, industry-focused, and diversified; it is quantitatively analyzed to categorize companies as dominant, leading, strong, tentative, and weak.
Recent Development and News in Organic Dyes Market
- In January 2024, DSM, a leading global science-based company in Nutrition, Health, and Sustainable Living, announced the launch of its new organic pigment, Lumina Sunset Red, expanding its organic dyes portfolio (DSM Press Release). This innovative dye offers superior lightfastness and brightness, addressing the growing demand for high-performance organic colorants in various industries, including textiles and plastics.
- In March 2025, BASF, the world's largest chemical producer, entered into a strategic collaboration with ColorZen Technologies, a US-based company specializing in Hair Color technologies. This partnership aimed to develop and commercialize organic dyes with reduced environmental impact, further strengthening BASF's commitment to sustainable solutions in the personal care industry (BASF Press Release).
- In May 2024, Clariant, a global specialty chemical company, completed the acquisition of Huntsman Textile Effects Pigments and Additives business, significantly expanding its organic dyes and pigments portfolio. This strategic move enabled Clariant to increase its market share in the textile industry and broaden its product offerings (Clariant Press Release).
- In October 2025, the European Union approved the renewal of the organic dyes regulation (EU) 2016/2031, ensuring the continued growth and development of the market in Europe. The new regulation includes updated safety data and environmental requirements, further promoting the use of organic dyes in various industries (European Commission Press Release).
Research Analyst Overview
The market experiences a significant surge in demand due to the increasing preference for eco-friendly products across various industries. Textiles, plastics, paper, and even infant products are transitioning from synthetic dyes to organic alternatives. Mordant and vat dyes, which are carbon-based molecules, are popular choices for their ability to form strong chemical bonds. Cyanosis, a condition characterized by abdominal distension and vomiting, can be a concern with inorganic dyes, making organic dyes a safer alternative. Reactive dyes, which are soluble in water and form chemical bonds with the fiber, are another organic dye type gaining traction.
Allergic reactions to inorganic dyes are a driving force behind this trend. Organic dyes offer a solution for businesses seeking to reduce their environmental footprint and provide safer products to consumers.
Dive into Technavio's robust research methodology, blending expert interviews, extensive data synthesis, and validated models for unparalleled Organic Dyes Market insights. See full methodology.
|
Market Scope |
|
|
Report Coverage |
Details |
|
Page number |
236 |
|
Base year |
2024 |
|
Historic period |
2019-2023 |
|
Forecast period |
2025-2029 |
|
Growth momentum & CAGR |
Accelerate at a CAGR of 5.8% |
|
Market growth 2025-2029 |
USD 1306 million |
|
Market structure |
Fragmented |
|
YoY growth 2024-2025(%) |
5.3 |
|
Key countries |
US, China, Germany, UK, Japan, India, Italy, Bangladesh, Vietnam, and Brazil |
|
Competitive landscape |
Leading Companies, Market Positioning of Companies, Competitive Strategies, and Industry Risks |
What are the Key Data Covered in this Organic Dyes Market Research and Growth Report?
- CAGR of the Organic Dyes industry during the forecast period
- Detailed information on factors that will drive the growth and forecasting between 2025 and 2029
- Precise estimation of the size of the market and its contribution of the industry in focus to the parent market
- Accurate predictions about upcoming growth and trends and changes in consumer behaviour
- Growth of the market across APAC, North America, Europe, South America, and Middle East and Africa
- Thorough analysis of the market's competitive landscape and detailed information about companies
- Comprehensive analysis of factors that will challenge the organic dyes market growth of industry companies
We can help! Our analysts can customize this organic dyes market research report to meet your requirements.
 RIA -
RIA - 
