Organic Pesticides Market Analysis, Size, and Forecast 2025-2029: North America (US, Canada, and Mexico), Europe (Germany, UK, and France), APAC (China, Japan, and India), South America (Brazil, Argentina, and Colombia), Middle East and Africa (Saudi Arabia, UAE, and South Africa), and Rest of World (ROW)

Organic Pesticides Market Analysis, Size, and Forecast 2025-2029:
North America (US, Canada, and Mexico), Europe (Germany, UK, and France), APAC (China, Japan, and India), South America (Brazil, Argentina, and Colombia), Middle East and Africa (Saudi Arabia, UAE, and South Africa), and Rest of World (ROW)

Published: Dec 2025 281 Pages SKU: IRTNTR73817

Market Overview at a Glance

$5.01 B
Market Opportunity
12.2%
CAGR 2024 - 2029
35.7%
North America Growth
$5.25 B
Arable segment 2023

Organic Pesticides Market Size 2025-2029

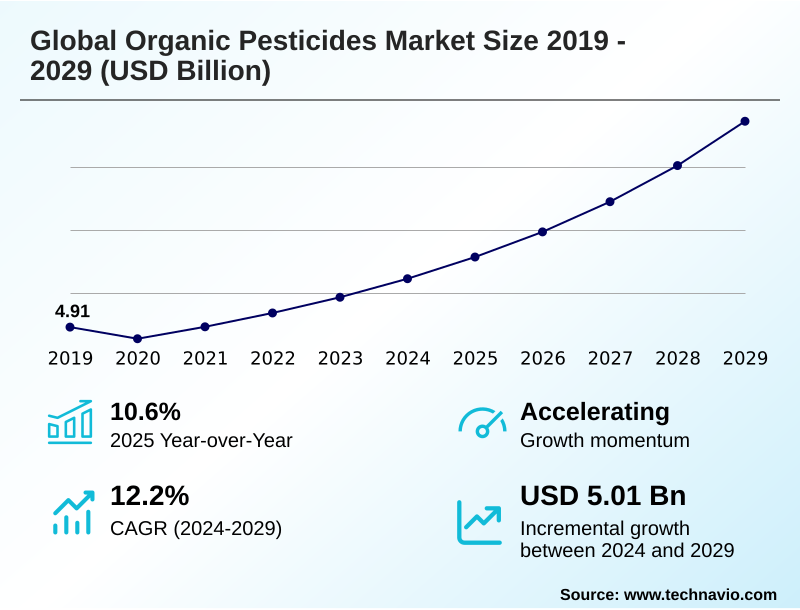
The organic pesticides market size is valued to increase by USD 5.01 billion, at a CAGR of 12.2% from 2024 to 2029. Growing interest in organic products will drive the organic pesticides market.

Major Market Trends & Insights

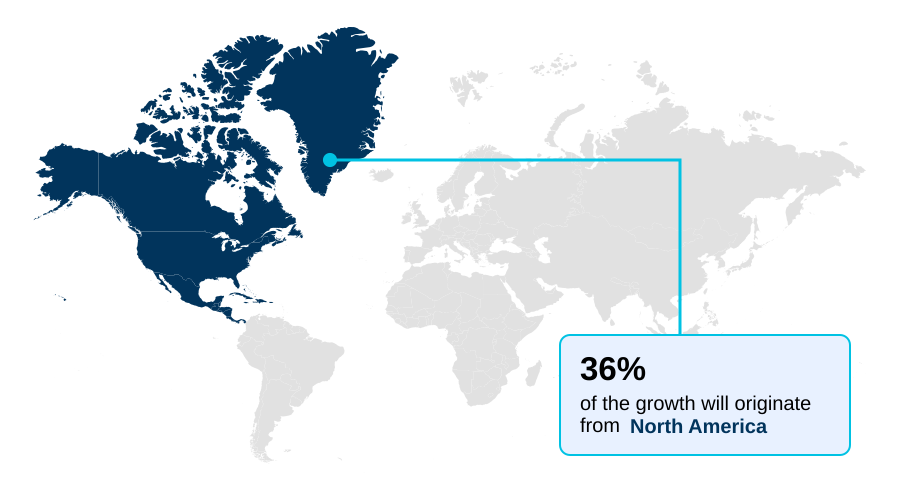
  • North America dominated the market and accounted for a 35.7% growth during the forecast period.
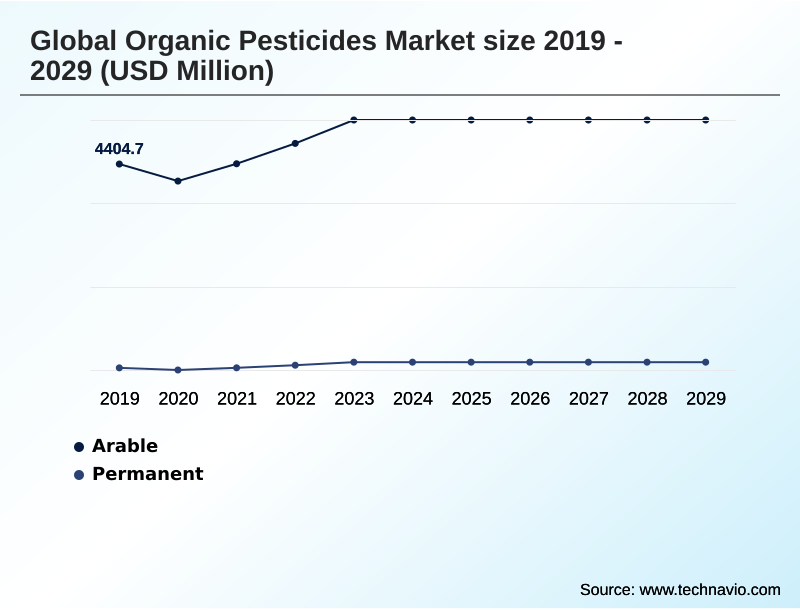
  • By Crop Type - Arable segment was valued at USD 5.25 billion in 2023
  • By Source - Microbial pesticides segment accounted for the largest market revenue share in 2023

Market Size & Forecast

  • Market Opportunities: USD 6.55 billion
  • Market Future Opportunities: USD 5.01 billion
  • CAGR from 2024 to 2029 : 12.2%

Market Summary

  • The organic pesticides market is undergoing a significant transformation, driven by escalating consumer demand for residue-free food and increasingly stringent environmental regulations. This shift is compelling the agricultural industry to move beyond conventional chemical inputs toward more sustainable alternatives.
  • Key drivers include the expansion of organic farming and the growing adoption of integrated pest management (IPM) programs, where biologicals play a crucial role. A central trend is the rapid innovation in biopesticide formulations, including microbial, botanical, and biochemical agents that offer enhanced efficacy and specificity.
  • For instance, a farming cooperative seeking to export produce to markets with strict residue limits can leverage advanced biorational solutions to manage pests effectively while maintaining its organic certification. This approach not only ensures compliance but also improves market access.
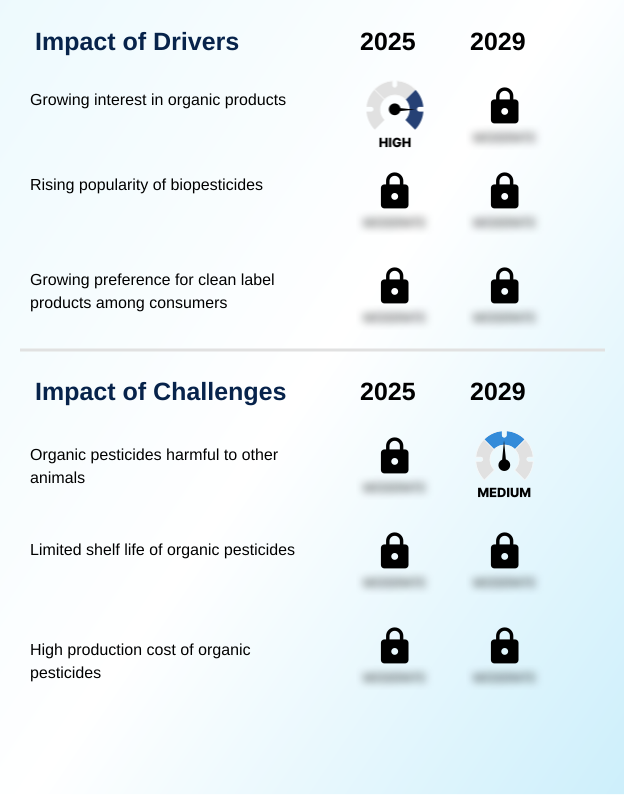
  • However, the industry faces challenges related to the shorter shelf-life of some biological products, their slower mode of action compared to synthetics, and higher initial costs. Overcoming these hurdles through continued research and development is essential for broadening the adoption of organic pesticides and securing a more sustainable future for agriculture.
  • The market's trajectory is defined by this balance between strong demand-side pull and supply-side innovation aimed at addressing practical limitations.

What will be the Size of the Organic Pesticides Market during the forecast period?

Get Key Insights on Market Forecast (PDF) Request Free Sample

How is the Organic Pesticides Market Segmented?

The organic pesticides industry research report provides comprehensive data (region-wise segment analysis), with forecasts and estimates in "USD million" for the period 2025-2029, as well as historical data from 2019-2023 for the following segments.

  • Crop type
    • Arable
    • Permanent
  • Source
    • Microbial pesticides
    • Botanical pesticides
    • Mineral pesticides
  • Application
    • Foliar spray
    • Soil treatment
    • Seed treatment
    • Post-harvest
  • Geography
    • North America
      • US
      • Canada
      • Mexico
    • Europe
      • Germany
      • UK
      • France
    • APAC
      • China
      • Japan
      • India
    • South America
      • Brazil
      • Argentina
      • Colombia
    • Middle East and Africa
      • Saudi Arabia
      • UAE
      • South Africa
    • Rest of World (ROW)

By Crop Type Insights

The arable segment is estimated to witness significant growth during the forecast period.

The arable crop segment is foundational to the organic pesticides market, driven by large-scale farming of cereals, oilseeds, and vegetables. Demand is fueled by stringent regulations on synthetic chemical residues and a growing focus on sustainable soil management.

To meet the needs of extensive acreages, research is centered on developing broad-spectrum bioinsecticides and biofungicides that offer competitive efficacy. Innovations in agricultural biologicals and microbial-based insecticide formulations are critical for this segment.

Integrating these solutions into existing farm programs is key, with microbial biopesticides now accounting for over 65% of the biopesticides sector, showcasing their importance in residue-free crop protection and enhancing plant health.

This shift toward advanced biorational solutions and biological pest control agents supports large-scale sustainable farming practices.

Request Free Sample

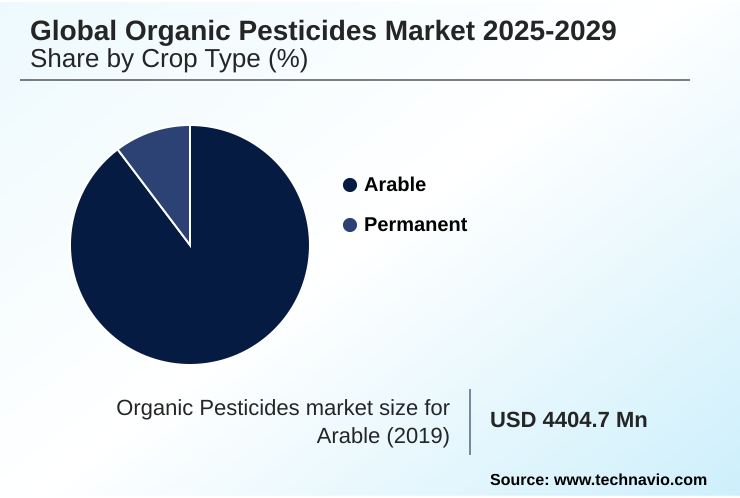
The Arable segment was valued at USD 5.25 billion in 2023 and showed a gradual increase during the forecast period.

Request Free Sample

Regional Analysis

North America is estimated to contribute 35.7% to the growth of the global market during the forecast period.Technavio’s analysts have elaborately explained the regional trends and drivers that shape the market during the forecast period.

See How Organic Pesticides Market Demand is Rising in North America Request Free Sample

The geographic landscape of the organic pesticides market is shaped by regional regulatory environments and consumer demand for organic food production.

North America is a major contributor to market growth, accounting for over 35% of the global incremental expansion, driven by strong consumer awareness and supportive government policies promoting sustainable pest solutions.

Meanwhile, APAC is projected to experience the fastest regional growth, with a CAGR of 13.6%, fueled by increasing adoption of modern agricultural techniques and a rising preference for eco-friendly farming.

Europe remains a mature market with stringent organic farming standards, fostering innovation in crop-specific formulations and pest resistance management.

The market dynamics in these regions underscore a global shift towards agricultural innovation and sustainable crop production methodologies to meet evolving consumer and regulatory expectations.

Market Dynamics

Our researchers analyzed the data with 2024 as the base year, along with the key drivers, trends, and challenges. A holistic analysis of drivers will help companies refine their marketing strategies to gain a competitive advantage.

  • The evolution of the global organic pesticides market 2025-2029 is deeply rooted in scientific advancement and shifting agricultural paradigms. Central to this is the development of new biological insecticides and continuous innovations in organic pest management, which are redefining crop protection strategies.
  • Advancements in biopesticide formulation technology are addressing historical limitations, such as the shelf life of microbial biopesticides, thereby improving their commercial viability. A thorough cost-benefit analysis of organic pesticides is becoming crucial for growers, who must weigh initial investment against long-term soil health and market access benefits.
  • The regulatory landscape for biological pesticides continues to evolve, influencing market entry and product claims. One of the primary challenges in organic pesticide adoption remains perceived efficacy gaps, especially when compared to synthetic alternatives.
  • However, the role of biopesticides in integrated pest management is expanding, particularly for organic pest control for fruit crops and in organic pesticide application in greenhouse farming. The broader impact of organic pesticides on biodiversity is a key consideration, aligning with the environmental benefits of using organic pesticides.
  • Ultimately, the consumer demand for organic produce impact is the primary force driving the adoption of biodegradable pest control methods and natural alternatives to synthetic chemical pesticides, solidifying the market growth of organic pest solutions and pushing integrated pest management for sustainable agriculture to the forefront of the industry.

What are the key market drivers leading to the rise in the adoption of Organic Pesticides Industry?

  • The growing consumer interest in organic products is a key driver for the organic pesticides market.

  • The primary driver for the organic pesticides market is the growing global demand for organic agricultural products and certified organic crops.
  • This is fueled by consumer awareness of the health benefits, as organic foods can contain up to 68% more antioxidants and have pesticide residue levels that are 48% lower than conventional products.
  • This demand incentivizes farmers to adopt organic input materials and natural pesticide ingredients. Consequently, there's a greater emphasis on soil health improvement and the use of beneficial microorganisms.
  • The adoption of mineral pesticides, foliar spray application techniques, and other organic methods reflects a broader industry commitment to meeting consumer expectations for healthier and more environmentally friendly food options.

What are the market trends shaping the Organic Pesticides Industry?

  • Biodegradation and bioremediation of organic pesticides are emerging as significant market trends. These processes support sustainable agriculture by breaking down residues and detoxifying contaminated environments.

  • Key trends in the organic pesticides market are centered on technological advancements that improve efficacy and sustainability. Innovations in biodegradation processes and bioremediation techniques are enabling the development of products with minimal environmental impact. The focus is on creating sophisticated organic pesticides like spinosad-based insecticides and pyrethrin-based insecticides that offer targeted action.
  • For example, new bacillus amyloliquefaciens strain formulations have shown up to a 40% increase in disease control efficacy in field trials. This drive for better performance is leading to the adoption of advanced seed treatment solutions and post-harvest application methods, which can reduce application frequency by 25%.
  • These trends underscore a market shift toward highly effective, scientifically-backed sustainable crop protection and pest management strategies.

What challenges does the Organic Pesticides Industry face during its growth?

  • The potential harm of some organic pesticides to non-target animals presents a key challenge to market growth.

  • A significant challenge in the organic pesticides market is overcoming performance and logistical limitations compared to synthetic alternatives. The limited shelf life of organic pesticides, particularly microbial pesticides, can lead to efficacy reductions of over 30% if not stored correctly.
  • Furthermore, the production costs for botanical pesticides and other natural plant protection (npp) solutions can be up to 50% higher, impacting their adoption by cost-sensitive growers. Formulations like those based on beauveria bassiana require precise application conditions, and improper soil treatment methods can reduce their effectiveness.
  • Addressing these issues through innovation in formulation and manufacturing is crucial for making organic pest control more competitive and accessible.

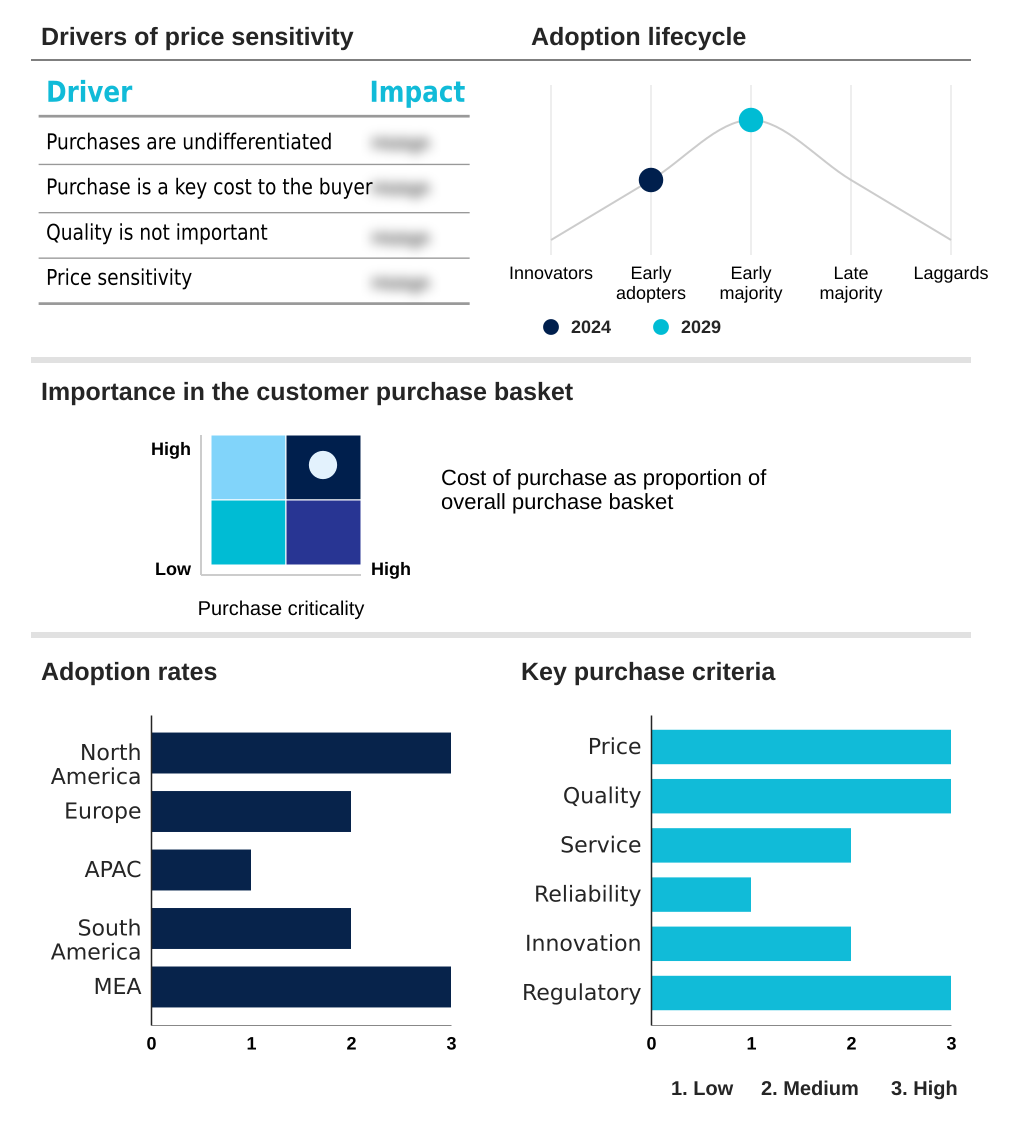
Exclusive Technavio Analysis on Customer Landscape

The organic pesticides market forecasting report includes the adoption lifecycle of the market, covering from the innovator’s stage to the laggard’s stage. It focuses on adoption rates in different regions based on penetration. Furthermore, the organic pesticides market report also includes key purchase criteria and drivers of price sensitivity to help companies evaluate and develop their market growth analysis strategies.

Customer Landscape of Organic Pesticides Industry

Competitive Landscape

Companies are implementing various strategies, such as strategic alliances, organic pesticides market forecast, partnerships, mergers and acquisitions, geographical expansion, and product/service launches, to enhance their presence in the industry.

Andermatt Group AG - Offerings include microbial and botanical-based organic pesticides, such as biofungicides and bioinsecticides, developed for sustainable crop protection and integrated pest management programs.

The industry research and growth report includes detailed analyses of the competitive landscape of the market and information about key companies, including:

  • Andermatt Group AG
  • BASF SE
  • Bayer AG
  • Certis USA LLC
  • Corteva Inc.
  • Futureco Bioscience SA
  • Gitaji Pesticides Industries
  • Greenstar Fertilizers Ltd.
  • Jaipur Bio Fertilizers
  • Nufarm Ltd.
  • Redox Industries Ltd.
  • Sahkar Pharmaceuticals Pvt. Ltd.
  • Sarasota Green Group LLC
  • Satpura Bio Fertiliser India Pvt Ltd.
  • Sikko Industries Ltd.
  • Sumitomo Chemical Co. Ltd.
  • UPL Ltd.
  • Valent BioSciences LLC

Qualitative and quantitative analysis of companies has been conducted to help clients understand the wider business environment as well as the strengths and weaknesses of key industry players. Data is qualitatively analyzed to categorize companies as pure play, category-focused, industry-focused, and diversified; it is quantitatively analyzed to categorize companies as dominant, leading, strong, tentative, and weak.

Recent Development and News in Organic pesticides market

  • In September 2024, Andermatt Group AG announced the acquisition of a leading Brazilian biopesticide firm, strengthening its footprint in the South American market and adding new microbial fermentation technology to its portfolio.
  • In November 2024, BASF SE revealed plans to construct a new state-of-the-art fermentation plant in North America dedicated to biological and biotechnology-based crop protection products, aiming to double its production capacity by 2027.
  • In February 2025, the US Environmental Protection Agency (EPA) granted regulatory approval for a novel double-stranded RNA (dsRNA) based insecticide, marking a significant milestone for next-generation biological pest control in row crops.
  • In May 2025, Futureco Bioscience SA and Sumitomo Corporation announced a strategic partnership to co-develop and globally distribute a new biological fungicide technology targeting resilient crop diseases in viticulture and horticulture.

Dive into Technavio’s robust research methodology, blending expert interviews, extensive data synthesis, and validated models for unparalleled Organic Pesticides Market insights. See full methodology.

Market Scope
Page number 281
Base year 2024
Historic period 2019-2023
Forecast period 2025-2029
Growth momentum & CAGR Accelerate at a CAGR of 12.2%
Market growth 2025-2029 USD 5007.6 million
Market structure Fragmented
YoY growth 2024-2025(%) 10.6%
Key countries US, Canada, Mexico, Germany, UK, France, Italy, The Netherlands, Spain, China, Japan, India, South Korea, Australia, Indonesia, Brazil, Argentina, Colombia, Saudi Arabia, UAE, South Africa, Israel and Turkey
Competitive landscape Leading Companies, Market Positioning of Companies, Competitive Strategies, and Industry Risks

Request Free Sample

Research Analyst Overview

  • The organic pesticides market is defined by a strategic shift towards advanced agricultural biologicals and residue-free crop protection. The development of biorational solutions, including biofungicides, bioinsecticides, and biostimulants, is accelerating, driven by the need for sustainable agriculture inputs that comply with omri certified inputs standards.
  • Innovations in microbial-based insecticide and plant-derived nematicide technologies, such as those using bacillus thuringiensis and double-stranded rna pesticide platforms, are becoming central to product portfolios.
  • A key boardroom consideration is the allocation of R&D capital toward proprietary technologies like the burkholderia platform and bacillus subtilis formulation, as firms possessing advanced microbial fermentation technology have demonstrated a 25% improvement in product stability.
  • This focus on sustainable soil management and plant health enhancement through solutions like neem-based pesticides is critical for maintaining a competitive edge in a market focused on integrated pest management (ipm) and biological pest control agents.

What are the Key Data Covered in this Organic Pesticides Market Research and Growth Report?

  • What is the expected growth of the Organic Pesticides Market between 2025 and 2029?

    • USD 5.01 billion, at a CAGR of 12.2%

  • What segmentation does the market report cover?

    • The report is segmented by Crop Type (Arable, and Permanent), Source (Microbial pesticides, Botanical pesticides, and Mineral pesticides), Application (Foliar spray, Soil treatment, Seed treatment, and Post-harvest) and Geography (North America, Europe, APAC, South America, Middle East and Africa)

  • Which regions are analyzed in the report?

    • North America, Europe, APAC, South America and Middle East and Africa

  • What are the key growth drivers and market challenges?

    • Growing interest in organic products, Organic pesticides harmful to other animals

  • Who are the major players in the Organic Pesticides Market?

    • Andermatt Group AG, BASF SE, Bayer AG, Certis USA LLC, Corteva Inc., Futureco Bioscience SA, Gitaji Pesticides Industries, Greenstar Fertilizers Ltd., Jaipur Bio Fertilizers, Nufarm Ltd., Redox Industries Ltd., Sahkar Pharmaceuticals Pvt. Ltd., Sarasota Green Group LLC, Satpura Bio Fertiliser India Pvt Ltd., Sikko Industries Ltd., Sumitomo Chemical Co. Ltd., UPL Ltd. and Valent BioSciences LLC

Market Research Insights

  • The organic pesticides market is expanding due to a strong push for sustainable farming practices and the rising popularity of eco-friendly pest management. Consumer demand for agricultural sustainability is a major factor, as organic crops are perceived as healthier, containing up to 68% more antioxidants than conventionally grown produce.
  • Furthermore, the use of certified organic inputs ensures that harmful contaminants are approximately 48% lower. This emphasis on crop quality improvement and eco-conscious agriculture is driving innovation in natural pest management and agricultural microbiology.
  • As a result, the market is seeing increased adoption of biological control systems that align with organic farming standards, promoting both environmental stewardship and enhanced crop yields.

We can help! Our analysts can customize this organic pesticides market research report to meet your requirements.

Get in touch

1. Executive Summary

1.1 Market overview

Executive Summary - Chart on Market Overview
Executive Summary - Data Table on Market Overview
Executive Summary - Chart on Global Market Characteristics
Executive Summary - Chart on Market by Geography
Executive Summary - Chart on Market Segmentation by Crop Type
Executive Summary - Chart on Market Segmentation by Source
Executive Summary - Chart on Market Segmentation by Application
Executive Summary - Chart on Incremental Growth
Executive Summary - Data Table on Incremental Growth
Executive Summary - Chart on Company Market Positioning

2. Technavio Analysis

2.1 Analysis of price sensitivity, lifecycle, customer purchase basket, adoption rates, and purchase criteria

2.2 Criticality of inputs and Factors of differentiation

Chart on Overview on criticality of inputs and factors of differentiation

2.3 Factors of disruption

Chart on Overview on factors of disruption

2.4 Impact of drivers and challenges

Chart on Impact of drivers and challenges in 2024 and 2029

3. Market Landscape

3.1 Market ecosystem

Chart on Parent Market
Data Table on - Parent Market

3.2 Market characteristics

Chart on Market characteristics analysis

3.3 Value chain analysis

Chart on Value chain analysis

4. Market Sizing

4.1 Market definition

Data Table on Offerings of companies included in the market definition

4.2 Market segment analysis

Market segments

4.3 Market size 2024

4.4 Market outlook: Forecast for 2024-2029

Chart on Global - Market size and forecast 2024-2029 ($ million)
Data Table on Global - Market size and forecast 2024-2029 ($ million)
Chart on Global Market: Year-over-year growth 2024-2029 (%)
Data Table on Global Market: Year-over-year growth 2024-2029 (%)

5. Historic Market Size

5.1 Global Organic Pesticides Market 2019 - 2023

Historic Market Size - Data Table on Global Organic Pesticides Market 2019 - 2023 ($ million)

5.2 Crop Type segment analysis 2019 - 2023

Historic Market Size - Crop Type Segment 2019 - 2023 ($ million)

5.3 Source segment analysis 2019 - 2023

Historic Market Size - Source Segment 2019 - 2023 ($ million)

5.4 Application segment analysis 2019 - 2023

Historic Market Size - Application Segment 2019 - 2023 ($ million)

5.5 Geography segment analysis 2019 - 2023

Historic Market Size - Geography Segment 2019 - 2023 ($ million)

5.6 Country segment analysis 2019 - 2023

Historic Market Size - Country Segment 2019 - 2023 ($ million)

6. Qualitative Analysis

6.1 Impact of AI on the Global Organic Pesticides Market

7. Five Forces Analysis

7.1 Five forces summary

Five forces analysis - Comparison between 2024 and 2029

7.2 Bargaining power of buyers

Bargaining power of buyers - Impact of key factors 2024 and 2029

7.3 Bargaining power of suppliers

Bargaining power of suppliers - Impact of key factors in 2024 and 2029

7.4 Threat of new entrants

Threat of new entrants - Impact of key factors in 2024 and 2029

7.5 Threat of substitutes

Threat of substitutes - Impact of key factors in 2024 and 2029

7.6 Threat of rivalry

Threat of rivalry - Impact of key factors in 2024 and 2029

7.7 Market condition

Chart on Market condition - Five forces 2024 and 2029

8. Market Segmentation by Crop Type

8.1 Market segments

Chart on Crop Type - Market share 2024-2029 (%)
Data Table on Crop Type - Market share 2024-2029 (%)

8.2 Comparison by Crop Type

Chart on Comparison by Crop Type
Data Table on Comparison by Crop Type

8.3 Arable - Market size and forecast 2024-2029

Chart on Arable - Market size and forecast 2024-2029 ($ million)
Data Table on Arable - Market size and forecast 2024-2029 ($ million)
Chart on Arable - Year-over-year growth 2024-2029 (%)
Data Table on Arable - Year-over-year growth 2024-2029 (%)

8.4 Permanent - Market size and forecast 2024-2029

Chart on Permanent - Market size and forecast 2024-2029 ($ million)
Data Table on Permanent - Market size and forecast 2024-2029 ($ million)
Chart on Permanent - Year-over-year growth 2024-2029 (%)
Data Table on Permanent - Year-over-year growth 2024-2029 (%)

8.5 Market opportunity by Crop Type

Market opportunity by Crop Type ($ million)
Data Table on Market opportunity by Crop Type ($ million)

9. Market Segmentation by Source

9.1 Market segments

Chart on Source - Market share 2024-2029 (%)
Data Table on Source - Market share 2024-2029 (%)

9.2 Comparison by Source

Chart on Comparison by Source
Data Table on Comparison by Source

9.3 Microbial pesticides - Market size and forecast 2024-2029

Chart on Microbial pesticides - Market size and forecast 2024-2029 ($ million)
Data Table on Microbial pesticides - Market size and forecast 2024-2029 ($ million)
Chart on Microbial pesticides - Year-over-year growth 2024-2029 (%)
Data Table on Microbial pesticides - Year-over-year growth 2024-2029 (%)

9.4 Botanical pesticides - Market size and forecast 2024-2029

Chart on Botanical pesticides - Market size and forecast 2024-2029 ($ million)
Data Table on Botanical pesticides - Market size and forecast 2024-2029 ($ million)
Chart on Botanical pesticides - Year-over-year growth 2024-2029 (%)
Data Table on Botanical pesticides - Year-over-year growth 2024-2029 (%)

9.5 Mineral pesticides - Market size and forecast 2024-2029

Chart on Mineral pesticides - Market size and forecast 2024-2029 ($ million)
Data Table on Mineral pesticides - Market size and forecast 2024-2029 ($ million)
Chart on Mineral pesticides - Year-over-year growth 2024-2029 (%)
Data Table on Mineral pesticides - Year-over-year growth 2024-2029 (%)

9.6 Market opportunity by Source

Market opportunity by Source ($ million)
Data Table on Market opportunity by Source ($ million)

10. Market Segmentation by Application

10.1 Market segments

Chart on Application - Market share 2024-2029 (%)
Data Table on Application - Market share 2024-2029 (%)

10.2 Comparison by Application

Chart on Comparison by Application
Data Table on Comparison by Application

10.3 Foliar spray - Market size and forecast 2024-2029

Chart on Foliar spray - Market size and forecast 2024-2029 ($ million)
Data Table on Foliar spray - Market size and forecast 2024-2029 ($ million)
Chart on Foliar spray - Year-over-year growth 2024-2029 (%)
Data Table on Foliar spray - Year-over-year growth 2024-2029 (%)

10.4 Soil treatment - Market size and forecast 2024-2029

Chart on Soil treatment - Market size and forecast 2024-2029 ($ million)
Data Table on Soil treatment - Market size and forecast 2024-2029 ($ million)
Chart on Soil treatment - Year-over-year growth 2024-2029 (%)
Data Table on Soil treatment - Year-over-year growth 2024-2029 (%)

10.5 Seed treatment - Market size and forecast 2024-2029

Chart on Seed treatment - Market size and forecast 2024-2029 ($ million)
Data Table on Seed treatment - Market size and forecast 2024-2029 ($ million)
Chart on Seed treatment - Year-over-year growth 2024-2029 (%)
Data Table on Seed treatment - Year-over-year growth 2024-2029 (%)

10.6 Post-harvest - Market size and forecast 2024-2029

Chart on Post-harvest - Market size and forecast 2024-2029 ($ million)
Data Table on Post-harvest - Market size and forecast 2024-2029 ($ million)
Chart on Post-harvest - Year-over-year growth 2024-2029 (%)
Data Table on Post-harvest - Year-over-year growth 2024-2029 (%)

10.7 Market opportunity by Application

Market opportunity by Application ($ million)
Data Table on Market opportunity by Application ($ million)

11. Customer Landscape

11.1 Customer landscape overview

Analysis of price sensitivity, lifecycle, customer purchase basket, adoption rates, and purchase criteria

12. Geographic Landscape

12.1 Geographic segmentation

Chart on Market share by geography 2024-2029 (%)
Data Table on Market share by geography 2024-2029 (%)

12.2 Geographic comparison

Chart on Geographic comparison
Data Table on Geographic comparison

12.3 North America - Market size and forecast 2024-2029

Chart on North America - Market size and forecast 2024-2029 ($ million)
Data Table on North America - Market size and forecast 2024-2029 ($ million)
Chart on North America - Year-over-year growth 2024-2029 (%)
Data Table on North America - Year-over-year growth 2024-2029 (%)
Chart on Regional Comparison - North America
Data Table on Regional Comparison - North America

12.3.1 US - Market size and forecast 2024-2029

Chart on US - Market size and forecast 2024-2029 ($ million)
Data Table on US - Market size and forecast 2024-2029 ($ million)
Chart on US - Year-over-year growth 2024-2029 (%)
Data Table on US - Year-over-year growth 2024-2029 (%)

12.3.2 Canada - Market size and forecast 2024-2029

Chart on Canada - Market size and forecast 2024-2029 ($ million)
Data Table on Canada - Market size and forecast 2024-2029 ($ million)
Chart on Canada - Year-over-year growth 2024-2029 (%)
Data Table on Canada - Year-over-year growth 2024-2029 (%)

12.3.3 Mexico - Market size and forecast 2024-2029

Chart on Mexico - Market size and forecast 2024-2029 ($ million)
Data Table on Mexico - Market size and forecast 2024-2029 ($ million)
Chart on Mexico - Year-over-year growth 2024-2029 (%)
Data Table on Mexico - Year-over-year growth 2024-2029 (%)

12.4 Europe - Market size and forecast 2024-2029

Chart on Europe - Market size and forecast 2024-2029 ($ million)
Data Table on Europe - Market size and forecast 2024-2029 ($ million)
Chart on Europe - Year-over-year growth 2024-2029 (%)
Data Table on Europe - Year-over-year growth 2024-2029 (%)
Chart on Regional Comparison - Europe
Data Table on Regional Comparison - Europe

12.4.1 Germany - Market size and forecast 2024-2029

Chart on Germany - Market size and forecast 2024-2029 ($ million)
Data Table on Germany - Market size and forecast 2024-2029 ($ million)
Chart on Germany - Year-over-year growth 2024-2029 (%)
Data Table on Germany - Year-over-year growth 2024-2029 (%)

12.4.2 UK - Market size and forecast 2024-2029

Chart on UK - Market size and forecast 2024-2029 ($ million)
Data Table on UK - Market size and forecast 2024-2029 ($ million)
Chart on UK - Year-over-year growth 2024-2029 (%)
Data Table on UK - Year-over-year growth 2024-2029 (%)

12.4.3 France - Market size and forecast 2024-2029

Chart on France - Market size and forecast 2024-2029 ($ million)
Data Table on France - Market size and forecast 2024-2029 ($ million)
Chart on France - Year-over-year growth 2024-2029 (%)
Data Table on France - Year-over-year growth 2024-2029 (%)

12.4.4 Italy - Market size and forecast 2024-2029

Chart on Italy - Market size and forecast 2024-2029 ($ million)
Data Table on Italy - Market size and forecast 2024-2029 ($ million)
Chart on Italy - Year-over-year growth 2024-2029 (%)
Data Table on Italy - Year-over-year growth 2024-2029 (%)

12.4.5 The Netherlands - Market size and forecast 2024-2029

Chart on The Netherlands - Market size and forecast 2024-2029 ($ million)
Data Table on The Netherlands - Market size and forecast 2024-2029 ($ million)
Chart on The Netherlands - Year-over-year growth 2024-2029 (%)
Data Table on The Netherlands - Year-over-year growth 2024-2029 (%)

12.4.6 Spain - Market size and forecast 2024-2029

Chart on Spain - Market size and forecast 2024-2029 ($ million)
Data Table on Spain - Market size and forecast 2024-2029 ($ million)
Chart on Spain - Year-over-year growth 2024-2029 (%)
Data Table on Spain - Year-over-year growth 2024-2029 (%)

12.5 APAC - Market size and forecast 2024-2029

Chart on APAC - Market size and forecast 2024-2029 ($ million)
Data Table on APAC - Market size and forecast 2024-2029 ($ million)
Chart on APAC - Year-over-year growth 2024-2029 (%)
Data Table on APAC - Year-over-year growth 2024-2029 (%)
Chart on Regional Comparison - APAC
Data Table on Regional Comparison - APAC

12.5.1 China - Market size and forecast 2024-2029

Chart on China - Market size and forecast 2024-2029 ($ million)
Data Table on China - Market size and forecast 2024-2029 ($ million)
Chart on China - Year-over-year growth 2024-2029 (%)
Data Table on China - Year-over-year growth 2024-2029 (%)

12.5.2 Japan - Market size and forecast 2024-2029

Chart on Japan - Market size and forecast 2024-2029 ($ million)
Data Table on Japan - Market size and forecast 2024-2029 ($ million)
Chart on Japan - Year-over-year growth 2024-2029 (%)
Data Table on Japan - Year-over-year growth 2024-2029 (%)

12.5.3 India - Market size and forecast 2024-2029

Chart on India - Market size and forecast 2024-2029 ($ million)
Data Table on India - Market size and forecast 2024-2029 ($ million)
Chart on India - Year-over-year growth 2024-2029 (%)
Data Table on India - Year-over-year growth 2024-2029 (%)

12.5.4 South Korea - Market size and forecast 2024-2029

Chart on South Korea - Market size and forecast 2024-2029 ($ million)
Data Table on South Korea - Market size and forecast 2024-2029 ($ million)
Chart on South Korea - Year-over-year growth 2024-2029 (%)
Data Table on South Korea - Year-over-year growth 2024-2029 (%)

12.5.5 Australia - Market size and forecast 2024-2029

Chart on Australia - Market size and forecast 2024-2029 ($ million)
Data Table on Australia - Market size and forecast 2024-2029 ($ million)
Chart on Australia - Year-over-year growth 2024-2029 (%)
Data Table on Australia - Year-over-year growth 2024-2029 (%)

12.5.6 Indonesia - Market size and forecast 2024-2029

Chart on Indonesia - Market size and forecast 2024-2029 ($ million)
Data Table on Indonesia - Market size and forecast 2024-2029 ($ million)
Chart on Indonesia - Year-over-year growth 2024-2029 (%)
Data Table on Indonesia - Year-over-year growth 2024-2029 (%)

12.6 South America - Market size and forecast 2024-2029

Chart on South America - Market size and forecast 2024-2029 ($ million)
Data Table on South America - Market size and forecast 2024-2029 ($ million)
Chart on South America - Year-over-year growth 2024-2029 (%)
Data Table on South America - Year-over-year growth 2024-2029 (%)
Chart on Regional Comparison - South America
Data Table on Regional Comparison - South America

12.6.1 Brazil - Market size and forecast 2024-2029

Chart on Brazil - Market size and forecast 2024-2029 ($ million)
Data Table on Brazil - Market size and forecast 2024-2029 ($ million)
Chart on Brazil - Year-over-year growth 2024-2029 (%)
Data Table on Brazil - Year-over-year growth 2024-2029 (%)

12.6.2 Argentina - Market size and forecast 2024-2029

Chart on Argentina - Market size and forecast 2024-2029 ($ million)
Data Table on Argentina - Market size and forecast 2024-2029 ($ million)
Chart on Argentina - Year-over-year growth 2024-2029 (%)
Data Table on Argentina - Year-over-year growth 2024-2029 (%)

12.6.3 Colombia - Market size and forecast 2024-2029

Chart on Colombia - Market size and forecast 2024-2029 ($ million)
Data Table on Colombia - Market size and forecast 2024-2029 ($ million)
Chart on Colombia - Year-over-year growth 2024-2029 (%)
Data Table on Colombia - Year-over-year growth 2024-2029 (%)

12.7 Middle East and Africa - Market size and forecast 2024-2029

Chart on Middle East and Africa - Market size and forecast 2024-2029 ($ million)
Data Table on Middle East and Africa - Market size and forecast 2024-2029 ($ million)
Chart on Middle East and Africa - Year-over-year growth 2024-2029 (%)
Data Table on Middle East and Africa - Year-over-year growth 2024-2029 (%)
Chart on Regional Comparison - Middle East and Africa
Data Table on Regional Comparison - Middle East and Africa

12.7.1 Saudi Arabia - Market size and forecast 2024-2029

Chart on Saudi Arabia - Market size and forecast 2024-2029 ($ million)
Data Table on Saudi Arabia - Market size and forecast 2024-2029 ($ million)
Chart on Saudi Arabia - Year-over-year growth 2024-2029 (%)
Data Table on Saudi Arabia - Year-over-year growth 2024-2029 (%)

12.7.2 UAE - Market size and forecast 2024-2029

Chart on UAE - Market size and forecast 2024-2029 ($ million)
Data Table on UAE - Market size and forecast 2024-2029 ($ million)
Chart on UAE - Year-over-year growth 2024-2029 (%)
Data Table on UAE - Year-over-year growth 2024-2029 (%)

12.7.3 South Africa - Market size and forecast 2024-2029

Chart on South Africa - Market size and forecast 2024-2029 ($ million)
Data Table on South Africa - Market size and forecast 2024-2029 ($ million)
Chart on South Africa - Year-over-year growth 2024-2029 (%)
Data Table on South Africa - Year-over-year growth 2024-2029 (%)

12.7.4 Israel - Market size and forecast 2024-2029

Chart on Israel - Market size and forecast 2024-2029 ($ million)
Data Table on Israel - Market size and forecast 2024-2029 ($ million)
Chart on Israel - Year-over-year growth 2024-2029 (%)
Data Table on Israel - Year-over-year growth 2024-2029 (%)

12.7.5 Turkey - Market size and forecast 2024-2029

Chart on Turkey - Market size and forecast 2024-2029 ($ million)
Data Table on Turkey - Market size and forecast 2024-2029 ($ million)
Chart on Turkey - Year-over-year growth 2024-2029 (%)
Data Table on Turkey - Year-over-year growth 2024-2029 (%)

12.8 Market opportunity by geography

Market opportunity by geography ($ million)
Data Tables on Market opportunity by geography ($ million)

13. Drivers, Challenges, and Opportunity

13.1 Market drivers

Growing interest in organic products
Rising popularity of biopesticides
Growing preference for clean label products among consumers

13.2 Market challenges

Organic pesticides harmful to other animals
Limited shelf life of organic pesticides
High production cost of organic pesticides

13.3 Impact of drivers and challenges

Impact of drivers and challenges in 2024 and 2029

13.4 Market opportunities

Biodegradation and bioremediation of organic pesticides
Introduction of integrated pest management
Technological advancements in biopesticides

14. Competitive Landscape

14.1 Overview

14.2

Overview on criticality of inputs and factors of differentiation

14.3 Landscape disruption

Overview on factors of disruption

14.4 Industry risks

Impact of key risks on business

15. Competitive Analysis

15.1 Companies profiled

Companies covered

15.2 Company ranking index

15.3 Market positioning of companies

Matrix on companies position and classification

15.4 Andermatt Group AG

Andermatt Group AG - Overview
Andermatt Group AG - Product / Service
Andermatt Group AG - Key offerings
SWOT

15.5 BASF SE

BASF SE - Overview
BASF SE - Business segments
BASF SE - Key news
BASF SE - Key offerings
BASF SE - Segment focus
SWOT

15.6 Bayer AG

Bayer AG - Overview
Bayer AG - Business segments
Bayer AG - Key news
Bayer AG - Key offerings
Bayer AG - Segment focus
SWOT

15.7 Certis USA LLC

Certis USA LLC - Overview
Certis USA LLC - Product / Service
Certis USA LLC - Key offerings
SWOT

15.8 Corteva Inc.

Corteva Inc. - Overview
Corteva Inc. - Business segments
Corteva Inc. - Key news
Corteva Inc. - Key offerings
Corteva Inc. - Segment focus
SWOT

15.9 Futureco Bioscience SA

Futureco Bioscience SA - Overview
Futureco Bioscience SA - Product / Service
Futureco Bioscience SA - Key offerings
SWOT

15.10 Gitaji Pesticides Industries

Gitaji Pesticides Industries - Overview
Gitaji Pesticides Industries - Product / Service
Gitaji Pesticides Industries - Key offerings
SWOT

15.11 Greenstar Fertilizers Ltd.

Greenstar Fertilizers Ltd. - Overview
Greenstar Fertilizers Ltd. - Product / Service
Greenstar Fertilizers Ltd. - Key offerings
SWOT

15.12 Jaipur Bio Fertilizers

Jaipur Bio Fertilizers - Overview
Jaipur Bio Fertilizers - Product / Service
Jaipur Bio Fertilizers - Key offerings
SWOT

15.13 Nufarm Ltd.

Nufarm Ltd. - Overview
Nufarm Ltd. - Business segments
Nufarm Ltd. - Key offerings
Nufarm Ltd. - Segment focus
SWOT

15.14 Sarasota Green Group LLC

Sarasota Green Group LLC - Overview
Sarasota Green Group LLC - Product / Service
Sarasota Green Group LLC - Key offerings
SWOT

15.15 Sikko Industries Ltd.

Sikko Industries Ltd. - Overview
Sikko Industries Ltd. - Product / Service
Sikko Industries Ltd. - Key offerings
SWOT

15.16 Sumitomo Chemical Co. Ltd.

Sumitomo Chemical Co. Ltd. - Overview
Sumitomo Chemical Co. Ltd. - Business segments
Sumitomo Chemical Co. Ltd. - Key offerings
Sumitomo Chemical Co. Ltd. - Segment focus
SWOT

15.17 UPL Ltd.

UPL Ltd. - Overview
UPL Ltd. - Business segments
UPL Ltd. - Key offerings
UPL Ltd. - Segment focus
SWOT

15.18 Valent BioSciences LLC

Valent BioSciences LLC - Overview
Valent BioSciences LLC - Product / Service
Valent BioSciences LLC - Key offerings
SWOT

16. Appendix

16.1 Scope of the report

Market definition
Objectives
Notes and caveats

16.2 Inclusions and exclusions checklist

Inclusions checklist
Exclusions checklist

16.3 Currency conversion rates for US$

16.4 Research methodology

16.5 Data procurement

Information sources

16.6 Data validation

16.7 Validation techniques employed for market sizing

16.8 Data synthesis

16.9 360 degree market analysis

16.10 List of abbreviations

Research Methodology

Technavio presents a detailed picture of the market by way of study, synthesis, and summation of data from multiple sources. The analysts have presented the various facets of the market with a particular focus on identifying the key industry influencers. The data thus presented is comprehensive, reliable, and the result of extensive research, both primary and secondary.

INFORMATION SOURCES

Primary sources

  • Manufacturers and suppliers
  • Channel partners
  • Industry experts
  • Strategic decision makers

Secondary sources

  • Industry journals and periodicals
  • Government data
  • Financial reports of key industry players
  • Historical data
  • Press releases

DATA ANALYSIS

Data Synthesis

  • Collation of data
  • Estimation of key figures
  • Analysis of derived insights

Data Validation

  • Triangulation with data models
  • Reference against proprietary databases
  • Corroboration with industry experts

REPORT WRITING

Qualitative

  • Market drivers
  • Market challenges
  • Market trends
  • Five forces analysis

Quantitative

  • Market size and forecast
  • Market segmentation
  • Geographical insights
  • Competitive landscape

Interested in this report?

Get your sample now to see our research methodology and insights!

Download Now

Frequently Asked Questions

Organic Pesticides market growth will increase by USD 5007.6 million during 2025-2029.

The Organic Pesticides market is expected to grow at a CAGR of 12.2% during 2025-2029.

Organic Pesticides market is segmented by Crop type (Arable, Permanent) Source (Microbial pesticides, Botanical pesticides, Mineral pesticides) Application (Foliar spray, Soil treatment, Seed treatment, Post-harvest)

Andermatt Group AG, BASF SE, Bayer AG, Certis USA LLC, Corteva Inc., Futureco Bioscience SA, Gitaji Pesticides Industries, Greenstar Fertilizers Ltd., Jaipur Bio Fertilizers, Nufarm Ltd., Redox Industries Ltd., Sahkar Pharmaceuticals Pvt. Ltd., Sarasota Green Group LLC, Satpura Bio Fertiliser India Pvt Ltd., Sikko Industries Ltd., Sumitomo Chemical Co. Ltd., UPL Ltd., Valent BioSciences LLC are a few of the key vendors in the Organic Pesticides market.

North America will register the highest growth rate of 35.7% among the other regions. Therefore, the Organic Pesticides market in North America is expected to garner significant business opportunities for the vendors during the forecast period.

US, Canada, Mexico, Germany, UK, France, Italy, The Netherlands, Spain, China, Japan, India, South Korea, Australia, Indonesia, Brazil, Argentina, Colombia, Saudi Arabia, UAE, South Africa, Israel, Turkey

  • Growing interest in organic products is the driving factor this market.

The Organic Pesticides market vendors should focus on grabbing business opportunities from the Crop type segment as it accounted for the largest market share in the base year.