Packaged Kale Chips Market Analysis, Size, and Forecast 2024-2028: North America (Canada), Europe (France, Germany, Italy, and UK), Middle East and Africa (Egypt, KSA, Oman, and UAE), APAC (China, India, and Japan), South America (Argentina and Brazil), and Rest of World (ROW)

Packaged Kale Chips Market Analysis, Size, and Forecast 2024-2028:
North America (Canada), Europe (France, Germany, Italy, and UK), Middle East and Africa (Egypt, KSA, Oman, and UAE), APAC (China, India, and Japan), South America (Argentina and Brazil), and Rest of World (ROW)

Published: May 2024 152 Pages SKU: IRTNTR45765

Market Overview at a Glance

$529.3 Mn
Market Opportunity
22.86%
CAGR
18.29
YoY growth 2023-2024(%)

Packaged Kale Chips Market Size 2024-2028

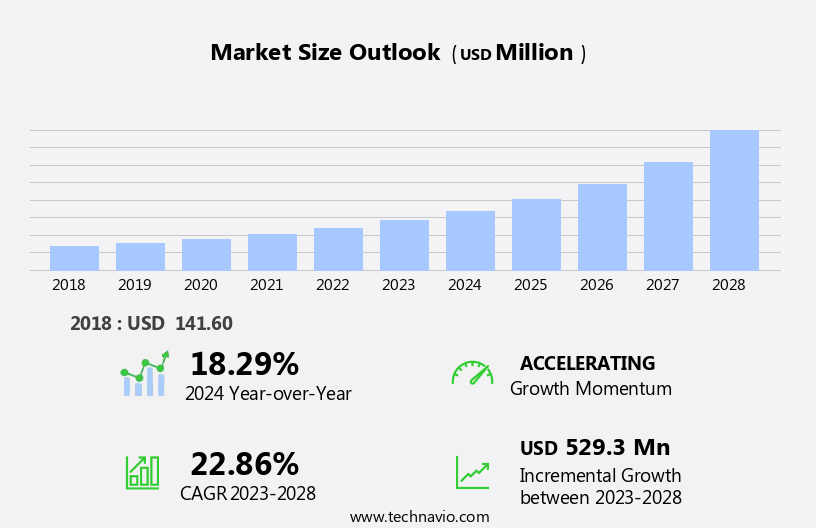
The packaged kale chips market size is forecast to increase by USD 529.3 million, at a CAGR of 22.86% between 2023 and 2028.

  • The market exhibits significant growth, driven by the expanding organized retail sector and the increasing popularity of health-conscious snacking. Online shopping is also gaining prominence, offering consumers greater convenience and accessibility. The expansion of the organized retail sector is creating new opportunities for packaged food manufacturers, including those producing kale chips. Additionally, the increasing preference for convenient and healthy snacking options, especially among millennials, is driving the demand for packaged kale chips. However, distribution challenges persist in the market, as the perishable nature of kale chips necessitates careful handling and timely delivery to maintain product quality. Companies must navigate these obstacles through strategic partnerships, robust supply chain management, and innovative packaging solutions to ensure product freshness and customer satisfaction. To capitalize on market opportunities, businesses should focus on product innovation, catering to diverse consumer preferences, and expanding their online presence.
  • Effective distribution strategies, such as collaborating with e-commerce platforms and implementing efficient logistics networks, will be crucial in overcoming distribution challenges and capturing market share.

What will be the Size of the Packaged Kale Chips Market during the forecast period?

Packaged Kale Chips Market Size

Explore in-depth regional segment analysis with market size data - historical 2018-2022 and forecasts 2024-2028 - in the full report.  
Request Free Sample

The market continues to evolve, with dynamic market activities unfolding across various sectors. Kale processing efficiency is a key focus, with energy-efficient production line optimization and high-pressure processing techniques ensuring crispiness while maintaining vitamin retention. Ingredient traceability systems and flavor compound analysis are essential for ensuring food safety regulations and consumer acceptance. Packaging material selection, thermal processing parameters, and product formulation design are critical elements in the market. Texture analysis methods and chlorophyll preservation techniques are used to enhance the consumer experience and extend shelf life. Automated packaging systems and packaging waste reduction strategies are integral to the industry's sustainability efforts.

Modifications in atmosphere packaging and microbial contamination control are ongoing, with a focus on reducing water usage optimization and vegetable dehydration methods. Oxidation prevention methods and mass production techniques are also under constant review to meet evolving consumer demands. Sensory evaluation protocols and nutrient retention methods are essential to maintaining quality control procedures and ensuring consumer satisfaction. Ingredient sourcing strategies continue to be a significant factor, with a focus on sustainability and traceability. The market's ongoing dynamism is reflected in the continuous exploration of new processing techniques, packaging technologies, and ingredient sourcing strategies. The industry's commitment to innovation and quality is evident in the evolving landscape of the market.

How is this Packaged Kale Chips Industry segmented?

The packaged kale chips industry research report provides comprehensive data (region-wise segment analysis), with forecasts and estimates in "USD million" for the period 2024-2028, as well as historical data from 2018-2022 for the following segments.

  • Product
    • Chips or crisps
    • Extruded snacks
  • Distribution Channel
    • Offline
    • Online
  • End-User
    • Health-Conscious Consumers
    • Fitness Enthusiasts
    • Vegan Consumers
    • General Snackers
  • Packaging Type
    • Single-Serve Packs
    • Family-Size Packs
    • Resealable Pouches
  • Geography
    • North America
      • US
      • Canada
    • Europe
      • France
      • Germany
      • Italy
      • UK
    • Middle East and Africa
      • Egypt
      • KSA
      • Oman
      • UAE
    • APAC
      • China
      • India
      • Japan
    • South America
      • Argentina
      • Brazil
    • Rest of World (ROW)

By Product Insights

The chips or crisps segment is estimated to witness significant growth during the forecast period.

The market has experienced notable growth in recent years, with a significant increase in consumer preference for healthier snack options. In response, manufacturers have focused on optimizing production lines for kale processing efficiency and implementing energy-efficient processing methods. Food safety regulations are strictly adhered to, ensuring the highest standards for consumer protection. High-pressure processing is employed to maintain the nutritional value of kale chips while extending their shelf life. Ingredient traceability systems and flavor compound analysis are essential components of product formulation design, ensuring transparency and consistency. Automated packaging systems and modified atmosphere packaging are utilized to minimize packaging waste and maintain product freshness.

Microbial contamination control is a top priority, with texture analysis methods and chlorophyll preservation techniques employed to ensure the desired crispy texture and vibrant color. Water usage optimization and vegetable dehydration methods are crucial for reducing production costs and minimizing environmental impact. Oxidation prevention methods and mass production techniques enable the production of large quantities while maintaining nutrient retention. Sensory evaluation protocols are implemented to assess consumer acceptance and preference, guiding product innovation and development. The market for packaged kale chips is expanding globally, with major markets including the UK, US, Germany, Canada, France, South Africa, Australia, and India.

The growth is driven by a shift towards healthier snacking and an increasing awareness of the nutritional benefits of kale. Manufacturers continue to invest in research and development, focusing on improving processing techniques, enhancing flavors, and extending shelf life to meet the evolving demands of consumers.

Packaged Kale Chips Market Size

Request Free Sample

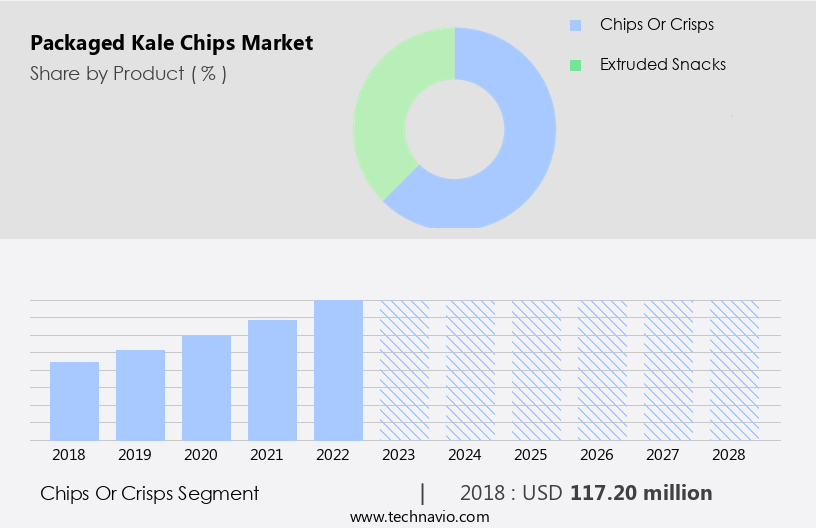
The Chips or crisps segment was valued at USD 117.20 million in 2018 and showed a gradual increase during the forecast period.
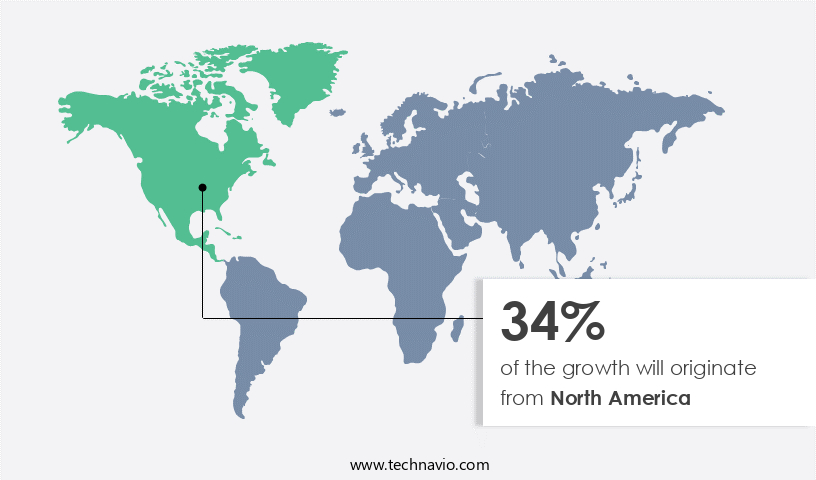
Regional Analysis

North America is estimated to contribute 34% to the growth of the global market during the forecast period.Technavio's analysts have elaborately explained the regional trends and drivers that shape the market during the forecast period.

Packaged Kale Chips Market Share by Geography

 Request Free Sample

In the dynamic North American market, packaged kale chips and other vegetable-based snacks have gained significant traction, with the US, Canada, and Mexico being the leading consumers. Major companies, including BRADS Plant Based LLC, Vermont Kale Chips, Rhythm Superfoods LLC, and The Kale Factory, contribute substantially to this trend, based in the region. The health benefits associated with kale chips, the rising preference for low-calorie, vegetable-based alternatives, and the entry of new players offering innovative snack options, such as beetroot chips, are key growth drivers. To cater to the increasing demand, companies focus on production line optimization and energy-efficient processing methods.

Food safety regulations are stringently enforced to maintain consumer trust. Kale processing efficiency is a critical factor, with high-pressure processing and other advanced techniques being employed. Ingredient traceability systems ensure transparency and compliance with regulations. Product formulation design and consumer acceptance testing play a significant role in market success. Shelf-life extension techniques, texture analysis methods, and chlorophyll preservation are essential for maintaining product quality. Vitamin retention analysis and ingredient sourcing strategies are crucial for product differentiation. Automated packaging systems and packaging waste reduction are essential for cost-effective, large-scale production. Modified atmosphere packaging and microbial contamination control are critical for maintaining product freshness and safety.

Water usage optimization and vegetable dehydration methods are essential for sustainability and cost efficiency. Oxidation prevention methods and mass production techniques ensure consistent product quality and affordability. Sensory evaluation protocols and nutrient retention methods are used to meet consumer expectations and maintain product integrity. The market's evolution reflects a focus on innovation, efficiency, and consumer health.

Market Dynamics

The Global packaged kale chips market is experiencing robust growth, driven by an increasing consumer focus on healthy snacking and the rising popularity of plant-based snacks. Consumers are actively seeking healthy kale chips, with organic kale chips and gluten-free kale chips being particularly popular choices. The market is witnessing a surge in demand for vegan kale chips and superfood snacks, solidifying kale crisps as a prominent alternative to traditional fried snacks. Key kale chips market trends indicate a strong preference for baked kale chips and convenient on-the-go snacks. Furthermore, the development of new kale chip flavors and a focus on sustainable kale chip packaging are shaping the industry. Analyzing the kale chips market size reveals significant opportunities, especially within the North America kale chips market, influencing global snack industry insights as low-calorie snacks gain traction, compelling kale chip manufacturers to highlight the benefits of eating kale chips.

Our researchers analyzed the data with 2023 as the base year, along with the key drivers, trends, and challenges. A holistic analysis of drivers will help companies refine their marketing strategies to gain a competitive advantage.

What are the key market drivers leading to the rise in the adoption of Packaged Kale Chips Industry?

  • The organized retail sector's growth serves as the primary catalyst for market expansion. 
  • Packaged kale chips have gained significant traction in the global food industry, with organized retailing serving as the primary distribution channel. Major players in this sector, such as Tesco Plc, Target Brands Inc., and ALDI Inc., offer a wide array of packaged food products, including packaged kale chips. The rise in the number of organized retailers providing shelf space for both branded and private-label packaged kale chips is expected to fuel market growth. Production line optimization and energy-efficient processing are crucial factors in the kale processing industry. High-pressure processing is a popular method used to preserve the nutritional value and enhance the shelf life of kale chips.
  • Food safety regulations are stringently enforced to ensure the production of safe and high-quality products. Ingredient traceability systems and flavor compound analysis are essential components of the manufacturing process, ensuring product consistency and maintaining consumer trust. Market dynamics are influenced by various factors, including production efficiency, consumer preferences, and regulatory requirements. As the demand for healthier snack options continues to rise, the market is poised for steady growth.

What are the market trends shaping the Packaged Kale Chips Industry?

  • The growing trend in the market is the increasing prominence of online shopping. This format of purchasing goods and services is becoming increasingly popular and professional.
  • The market has witnessed substantial growth in recent years, with e-commerce being a significant driving factor. Consumers now have access to a wide range of packaged kale chips brands from around the world through online retailers. The proliferation of smartphones and the increasing number of e-commerce companies globally have contributed to this trend. Amazon.Com and eBay are among the major online retailers offering packaged kale chips. Packaging material selection plays a crucial role in maintaining the product's texture, color, and flavor during thermal processing. Product formulation design and consumer acceptance testing are essential to ensure the product's quality and appeal.
  • Shelf-life extension techniques, such as chlorophyll preservation and texture analysis methods, are employed to enhance the product's longevity and freshness. Thermal processing parameters are carefully optimized to ensure the product's safety and quality. In conclusion, the market's growth is fueled by the rise of e-commerce and the increasing consumer preference for convenient, healthy snacks. To meet the growing demand, companies focus on product innovation, packaging material selection, and shelf-life extension techniques. Consumer acceptance testing and texture analysis methods are essential to maintain product quality and appeal. Chlorophyll preservation techniques help extend the product's shelf life while maintaining its vibrant green color.

What challenges does the Packaged Kale Chips Industry face during its growth?

  • The market faces significant distribution challenges, which represent a key impediment to industry growth. 
  • Packaged kale chips face significant challenges in the retail market due to increasing pressure on manufacturers regarding pricing and margins. Retailers demand frequent and smaller product deliveries to minimize warehousing costs, which can strain manufacturing operations. Innovative merchandising units, such as movable shelves, are becoming a requirement to reduce replenishment costs for retailers. Moreover, order fulfillment rates have become a crucial factor in fostering business relationships between packaged kale chip companies and retailers. To address these challenges, manufacturers focus on implementing quality control procedures during crispy kale processing to ensure consistent product quality. Vitamin retention analysis is a critical aspect of quality control, as it helps maintain the nutritional value of the product.
  • Ingredient sourcing strategies are also essential to ensure the availability of high-quality raw materials. Automated packaging systems and modified atmosphere packaging are employed to minimize packaging waste and extend the product's shelf life. By addressing these challenges, manufacturers can build strong relationships with retailers and maintain a steady market presence.

Exclusive Customer Landscape

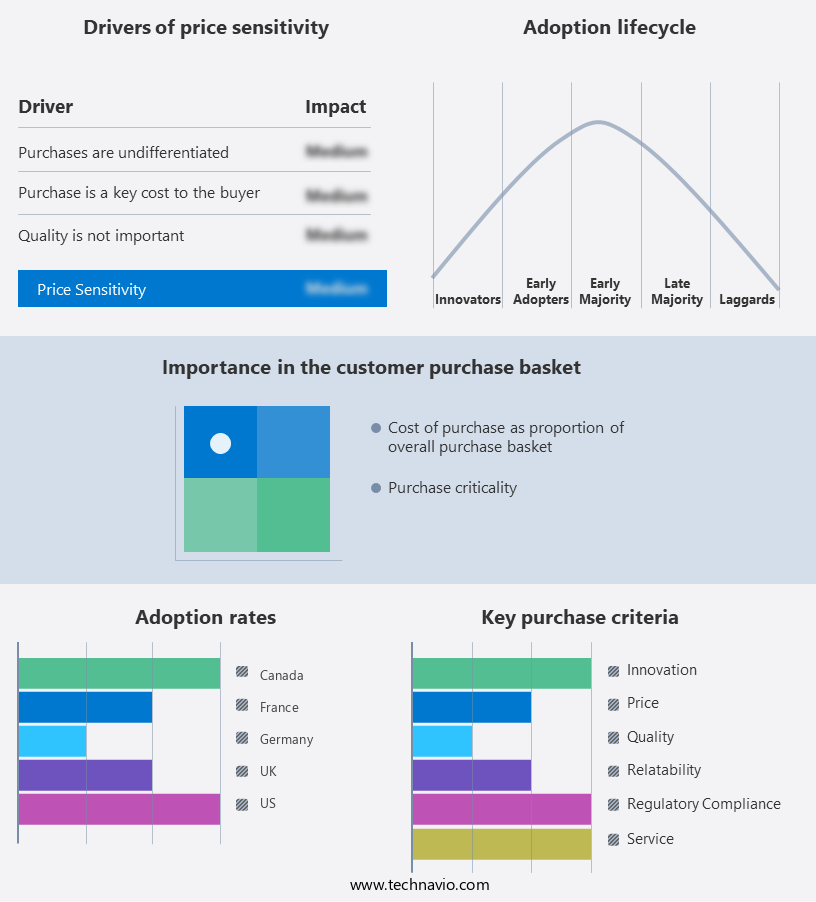
The packaged kale chips market forecasting report includes the adoption lifecycle of the market, covering from the innovator's stage to the laggard's stage. It focuses on adoption rates in different regions based on penetration. Furthermore, the packaged kale chips market report also includes key purchase criteria and drivers of price sensitivity to help companies evaluate and develop their market growth analysis strategies.

Packaged Kale Chips Market Share by Geography

 Customer Landscape

Key Companies & Market Insights

Companies are implementing various strategies, such as strategic alliances, packaged kale chips market forecast, partnerships, mergers and acquisitions, geographical expansion, and product/service launches, to enhance their presence in the industry.

BRADS PLANT BASED LLC - This company specializes in producing a range of packaged kale chip offerings, including Veggie Chips Kale, Crunchy Kale Sampler, Crunchy Kale Probiotic Bundle, Crunchy Kale Cheeze It Up, and Crunchy Kale Vampire Killer. These products showcase the company's commitment to delivering nutritious and flavorful snack alternatives. The kale chips cater to various dietary preferences and needs, expanding the market reach.

The industry research and growth report includes detailed analyses of the competitive landscape of the market and information about key companies, including:

  • BRADS PLANT BASED LLC
  • DJ and A PTY Ltd.
  • Kaleidoscope Foods
  • Koninklijke Ahold Delhaize NV
  • NATRULY
  • Rhythm Superfoods LLC
  • Simply 7 Snacks LLC
  • Smart Organic AD
  • The Kale Factory

Qualitative and quantitative analysis of companies has been conducted to help clients understand the wider business environment as well as the strengths and weaknesses of key industry players. Data is qualitatively analyzed to categorize companies as pure play, category-focused, industry-focused, and diversified; it is quantitatively analyzed to categorize companies as dominant, leading, strong, tentative, and weak.

Recent Development and News in Packaged Kale Chips Market

  • In January 2024, Hain Celestial, a leading natural and organic food company, announced the acquisition of Greenhouse Foods, a Canadian producer of plant-based snacks including kale chips (Business Wire). This strategic move expanded Hain Celestial's product portfolio and strengthened its presence in the growing plant-based snack market.
  • In March 2024, Sabra Dipping Company, in collaboration with Bolthouse Farms, launched a new line of kale chips infused with various dips such as guacamole and hummus (PR Newswire). This innovative product development catered to consumers' increasing demand for flavorful and convenient snack options.
  • In May 2024, Terra Chips, a subsidiary of Frito-Lay, unveiled a significant investment in its production capacity for kale chips, aiming to double its production capabilities (CNBC). This expansion allowed Terra Chips to meet the growing market demand and solidified its position as a major player in the market.
  • In April 2025, the European Commission approved the acquisition of Rude Health, a UK-based organic snack company, by PepsiCo (Reuters). The acquisition granted PepsiCo access to Rude Health's organic kale chip line, further expanding its presence in the European organic snack market.

Research Analyst Overview

  • The market experiences dynamic growth, driven by consumer demand for healthier snack options. Quality assurance metrics, such as production yield analysis and equipment maintenance schedules, are crucial for maintaining product consistency and meeting food safety standards. Packaging film barriers play a significant role in microbial growth inhibition and vegetable preservation methods, ensuring the freshness and longevity of the product. Leak detection systems and supply chain traceability are essential for identifying potential issues and ensuring eco-friendly packaging. Process control systems and texture profile analysis optimize the kale dehydration technology, while sensory attribute analysis caters to consumer preferences. Renewable energy sources and water recycling strategies contribute to cost reduction and sustainability.
  • Ingredient cost analysis and nutritional composition are critical factors in process optimization strategies. Chip frying alternatives and waste management systems minimize production costs and environmental impact. Food safety standards, aroma compound profiling, and process optimization strategies are key areas of focus for market players to stay competitive.

Dive into Technavio's robust research methodology, blending expert interviews, extensive data synthesis, and validated models for unparalleled Packaged Kale Chips Market insights. See full methodology.

Market Scope

Report Coverage

Details

Page number

152

Base year

2023

Historic period

2018-2022

Forecast period

2024-2028

Growth momentum & CAGR

Accelerate at a CAGR of 22.86%

Market growth 2024-2028

USD 529.3 million

Market structure

Concentrated

YoY growth 2023-2024(%)

18.29

Key countries

US, Canada, Germany, UK, Italy, France, China, India, Japan, Brazil, Egypt, UAE, Oman, Argentina, KSA, UAE, Brazil, and Rest of World (ROW)

Competitive landscape

Leading Companies, Market Positioning of Companies, Competitive Strategies, and Industry Risks

Request Free Sample

What are the Key Data Covered in this Packaged Kale Chips Market Research and Growth Report?

  • CAGR of the Packaged Kale Chips industry during the forecast period
  • Detailed information on factors that will drive the growth and forecasting between 2024 and 2028
  • Precise estimation of the size of the market and its contribution of the industry in focus to the parent market
  • Accurate predictions about upcoming growth and trends and changes in consumer behaviour
  • Growth of the market across North America, Europe, APAC, Middle East and Africa, and South America
  • Thorough analysis of the market's competitive landscape and detailed information about companies
  • Comprehensive analysis of factors that will challenge the packaged kale chips market growth of industry companies

We can help! Our analysts can customize this packaged kale chips market research report to meet your requirements.

Get in touch

1 Executive Summary

  • 1.1 Market overview
    • Executive Summary - Chart on Market Overview
    • Executive Summary - Data Table on Market Overview
    • Executive Summary - Chart on Global Market Characteristics
    • Executive Summary - Chart on Market by Geography
    • Executive Summary - Chart on Market Segmentation by Product
    • Executive Summary - Chart on Market Segmentation by Distribution Channel
    • Executive Summary - Chart on Incremental Growth
    • Executive Summary - Data Table on Incremental Growth
    • Executive Summary - Chart on Company Market Positioning

2 Market Landscape

  • 2.1 Market ecosystem
    • Parent Market
    • Data Table on - Parent Market
  • 2.2 Market characteristics
    • Market characteristics analysis
  • 2.3 Value chain analysis
    • Value Chain Analysis

3 Market Sizing

  • 3.1 Market definition
    • Offerings of companies included in the market definition
  • 3.2 Market segment analysis
    • Market segments
  • 3.3 Market size 2023
    • 3.4 Market outlook: Forecast for 2023-2028
      • Chart on Global - Market size and forecast 2023-2028 ($ million)
      • Data Table on Global - Market size and forecast 2023-2028 ($ million)
      • Chart on Global Market: Year-over-year growth 2023-2028 (%)
      • Data Table on Global Market: Year-over-year growth 2023-2028 (%)

    4 Historic Market Size

    • 4.1 Global Packaged Kale Chips Market 2018 - 2022
      • Historic Market Size - Data Table on Global Packaged Kale Chips Market 2018 - 2022 ($ million)
    • 4.2 Product segment analysis 2018 - 2022
      • Historic Market Size - Product Segment 2018 - 2022 ($ million)
    • 4.3 Distribution Channel segment analysis 2018 - 2022
      • Historic Market Size - Distribution Channel Segment 2018 - 2022 ($ million)
    • 4.4 Geography segment analysis 2018 - 2022
      • Historic Market Size - Geography Segment 2018 - 2022 ($ million)
    • 4.5 Country segment analysis 2018 - 2022
      • Historic Market Size - Country Segment 2018 - 2022 ($ million)

    5 Five Forces Analysis

    • 5.1 Five forces summary
      • Five forces analysis - Comparison between 2023 and 2028
    • 5.2 Bargaining power of buyers
      • Bargaining power of buyers - Impact of key factors 2023 and 2028
    • 5.3 Bargaining power of suppliers
      • Bargaining power of suppliers - Impact of key factors in 2023 and 2028
    • 5.4 Threat of new entrants
      • Threat of new entrants - Impact of key factors in 2023 and 2028
    • 5.5 Threat of substitutes
      • Threat of substitutes - Impact of key factors in 2023 and 2028
    • 5.6 Threat of rivalry
      • Threat of rivalry - Impact of key factors in 2023 and 2028
    • 5.7 Market condition
      • Chart on Market condition - Five forces 2023 and 2028

    6 Market Segmentation by Product

    • 6.1 Market segments
      • Chart on Product - Market share (2023-2028) (%)
      • Data Table on Product - Market share (2023-2028) (%)
    • 6.2 Comparison by Product
      • Chart on Comparison by Product
      • Data Table on Comparison by Product
    • 6.3 Chips or crisps - Market size and forecast (2023-2028)
      • Chart on Chips or crisps - Market size and forecast (2023-2028) ($ million)
      • Data Table on Chips or crisps - Market size and forecast (2023-2028) ($ million)
      • Chart on Chips or crisps - Year-over-year growth (2023-2028) (%)
      • Data Table on Chips or crisps - Year-over-year growth (2023-2028) (%)
    • 6.4 Extruded snacks - Market size and forecast (2023-2028)
      • Chart on Extruded snacks - Market size and forecast (2023-2028) ($ million)
      • Data Table on Extruded snacks - Market size and forecast (2023-2028) ($ million)
      • Chart on Extruded snacks - Year-over-year growth (2023-2028) (%)
      • Data Table on Extruded snacks - Year-over-year growth (2023-2028) (%)
    • 6.5 Market opportunity by Product
      • Market opportunity by Product ($ million)
      • Data Table on Market opportunity by Product ($ million)

    7 Market Segmentation by Distribution Channel

    • 7.1 Market segments
      • Chart on Distribution Channel - Market share (2023-2028) (%)
      • Data Table on Distribution Channel - Market share (2023-2028) (%)
    • 7.2 Comparison by Distribution Channel
      • Chart on Comparison by Distribution Channel
      • Data Table on Comparison by Distribution Channel
    • 7.3 Offline - Market size and forecast (2023-2028)
      • Chart on Offline - Market size and forecast (2023-2028) ($ million)
      • Data Table on Offline - Market size and forecast (2023-2028) ($ million)
      • Chart on Offline - Year-over-year growth (2023-2028) (%)
      • Data Table on Offline - Year-over-year growth (2023-2028) (%)
    • 7.4 Online - Market size and forecast (2023-2028)
      • Chart on Online - Market size and forecast (2023-2028) ($ million)
      • Data Table on Online - Market size and forecast (2023-2028) ($ million)
      • Chart on Online - Year-over-year growth (2023-2028) (%)
      • Data Table on Online - Year-over-year growth (2023-2028) (%)
    • 7.5 Market opportunity by Distribution Channel
      • Market opportunity by Distribution Channel ($ million)
      • Data Table on Market opportunity by Distribution Channel ($ million)

    8 Market Segmentation by End-User

    • 8.1 Market segments
      • Chart on End-User - Market share (2023-2028) (%)
      • Data Table on End-User - Market share (2023-2028) (%)
    • 8.2 Comparison by End-User
      • Chart on Comparison by End-User
      • Data Table on Comparison by End-User
    • 8.3 Health-Conscious Consumers - Market size and forecast (2023-2028)
      • Chart on Health-Conscious Consumers - Market size and forecast (2023-2028) ($ million)
      • Data Table on Health-Conscious Consumers - Market size and forecast (2023-2028) ($ million)
      • Chart on Health-Conscious Consumers - Year-over-year growth (2023-2028) (%)
      • Data Table on Health-Conscious Consumers - Year-over-year growth (2023-2028) (%)
    • 8.4 Fitness Enthusiasts - Market size and forecast (2023-2028)
      • Chart on Fitness Enthusiasts - Market size and forecast (2023-2028) ($ million)
      • Data Table on Fitness Enthusiasts - Market size and forecast (2023-2028) ($ million)
      • Chart on Fitness Enthusiasts - Year-over-year growth (2023-2028) (%)
      • Data Table on Fitness Enthusiasts - Year-over-year growth (2023-2028) (%)
    • 8.5 Vegan Consumers - Market size and forecast (2023-2028)
      • Chart on Vegan Consumers - Market size and forecast (2023-2028) ($ million)
      • Data Table on Vegan Consumers - Market size and forecast (2023-2028) ($ million)
      • Chart on Vegan Consumers - Year-over-year growth (2023-2028) (%)
      • Data Table on Vegan Consumers - Year-over-year growth (2023-2028) (%)
    • 8.6 General Snackers - Market size and forecast (2023-2028)
      • Chart on General Snackers - Market size and forecast (2023-2028) ($ million)
      • Data Table on General Snackers - Market size and forecast (2023-2028) ($ million)
      • Chart on General Snackers - Year-over-year growth (2023-2028) (%)
      • Data Table on General Snackers - Year-over-year growth (2023-2028) (%)
    • 8.7 Market opportunity by End-User
      • Market opportunity by End-User ($ million)
      • Data Table on Market opportunity by End-User ($ million)

    9 Market Segmentation by Packaging Type

    • 9.1 Market segments
      • Chart on Packaging Type - Market share (2023-2028) (%)
      • Data Table on Packaging Type - Market share (2023-2028) (%)
    • 9.2 Comparison by Packaging Type
      • Chart on Comparison by Packaging Type
      • Data Table on Comparison by Packaging Type
    • 9.3 Single-Serve Packs - Market size and forecast (2023-2028)
      • Chart on Single-Serve Packs - Market size and forecast (2023-2028) ($ million)
      • Data Table on Single-Serve Packs - Market size and forecast (2023-2028) ($ million)
      • Chart on Single-Serve Packs - Year-over-year growth (2023-2028) (%)
      • Data Table on Single-Serve Packs - Year-over-year growth (2023-2028) (%)
    • 9.4 Family-Size Packs - Market size and forecast (2023-2028)
      • Chart on Family-Size Packs - Market size and forecast (2023-2028) ($ million)
      • Data Table on Family-Size Packs - Market size and forecast (2023-2028) ($ million)
      • Chart on Family-Size Packs - Year-over-year growth (2023-2028) (%)
      • Data Table on Family-Size Packs - Year-over-year growth (2023-2028) (%)
    • 9.5 Resealable Pouches - Market size and forecast (2023-2028)
      • Chart on Resealable Pouches - Market size and forecast (2023-2028) ($ million)
      • Data Table on Resealable Pouches - Market size and forecast (2023-2028) ($ million)
      • Chart on Resealable Pouches - Year-over-year growth (2023-2028) (%)
      • Data Table on Resealable Pouches - Year-over-year growth (2023-2028) (%)
    • 9.6 Market opportunity by Packaging Type
      • Market opportunity by Packaging Type ($ million)
      • Data Table on Market opportunity by Packaging Type ($ million)

    10 Customer Landscape

    • 10.1 Customer landscape overview
      • Analysis of price sensitivity, lifecycle, customer purchase basket, adoption rates, and purchase criteria

    11 Geographic Landscape

    • 11.1 Geographic segmentation
      • Chart on Market share by geography 2023-2028 (%)
      • Data Table on Market share by geography 2023-2028 (%)
    • 11.2 Geographic comparison
      • Chart on Geographic comparison
      • Data Table on Geographic comparison
    • 11.3 North America - Market size and forecast 2023-2028
      • Chart on North America - Market size and forecast 2023-2028 ($ million)
      • Data Table on North America - Market size and forecast 2023-2028 ($ million)
      • Chart on North America - Year-over-year growth 2023-2028 (%)
      • Data Table on North America - Year-over-year growth 2023-2028 (%)
    • 11.4 Europe - Market size and forecast 2023-2028
      • Chart on Europe - Market size and forecast 2023-2028 ($ million)
      • Data Table on Europe - Market size and forecast 2023-2028 ($ million)
      • Chart on Europe - Year-over-year growth 2023-2028 (%)
      • Data Table on Europe - Year-over-year growth 2023-2028 (%)
    • 11.5 APAC - Market size and forecast 2023-2028
      • Chart on APAC - Market size and forecast 2023-2028 ($ million)
      • Data Table on APAC - Market size and forecast 2023-2028 ($ million)
      • Chart on APAC - Year-over-year growth 2023-2028 (%)
      • Data Table on APAC - Year-over-year growth 2023-2028 (%)
    • 11.6 Middle East and Africa - Market size and forecast 2023-2028
      • Chart on Middle East and Africa - Market size and forecast 2023-2028 ($ million)
      • Data Table on Middle East and Africa - Market size and forecast 2023-2028 ($ million)
      • Chart on Middle East and Africa - Year-over-year growth 2023-2028 (%)
      • Data Table on Middle East and Africa - Year-over-year growth 2023-2028 (%)
    • 11.7 South America - Market size and forecast 2023-2028
      • Chart on South America - Market size and forecast 2023-2028 ($ million)
      • Data Table on South America - Market size and forecast 2023-2028 ($ million)
      • Chart on South America - Year-over-year growth 2023-2028 (%)
      • Data Table on South America - Year-over-year growth 2023-2028 (%)
    • 11.8 US - Market size and forecast 2023-2028
      • Chart on US - Market size and forecast 2023-2028 ($ million)
      • Data Table on US - Market size and forecast 2023-2028 ($ million)
      • Chart on US - Year-over-year growth 2023-2028 (%)
      • Data Table on US - Year-over-year growth 2023-2028 (%)
    • 11.9 UK - Market size and forecast 2023-2028
      • Chart on UK - Market size and forecast 2023-2028 ($ million)
      • Data Table on UK - Market size and forecast 2023-2028 ($ million)
      • Chart on UK - Year-over-year growth 2023-2028 (%)
      • Data Table on UK - Year-over-year growth 2023-2028 (%)
    • 11.10 Canada - Market size and forecast 2023-2028
      • Chart on Canada - Market size and forecast 2023-2028 ($ million)
      • Data Table on Canada - Market size and forecast 2023-2028 ($ million)
      • Chart on Canada - Year-over-year growth 2023-2028 (%)
      • Data Table on Canada - Year-over-year growth 2023-2028 (%)
    • 11.11 Germany - Market size and forecast 2023-2028
      • Chart on Germany - Market size and forecast 2023-2028 ($ million)
      • Data Table on Germany - Market size and forecast 2023-2028 ($ million)
      • Chart on Germany - Year-over-year growth 2023-2028 (%)
      • Data Table on Germany - Year-over-year growth 2023-2028 (%)
    • 11.12 France - Market size and forecast 2023-2028
      • Chart on France - Market size and forecast 2023-2028 ($ million)
      • Data Table on France - Market size and forecast 2023-2028 ($ million)
      • Chart on France - Year-over-year growth 2023-2028 (%)
      • Data Table on France - Year-over-year growth 2023-2028 (%)
    • 11.13 Market opportunity by geography
      • Market opportunity by geography ($ million)
      • Data Tables on Market opportunity by geography ($ million)
    • 11.14 US - Market size and forecast (2023-2028)
      • Chart on US - Market size and forecast (2023-2028) ($ million)
      • Data Table on US - Market size and forecast (2023-2028) ($ million)
      • Chart on US - Year-over-year growth (2023-2028) (%)
      • Data Table on US - Year-over-year growth (2023-2028) (%)
    • 11.15 Italy - Market size and forecast (2023-2028)
      • Chart on Italy - Market size and forecast (2023-2028) ($ million)
      • Data Table on Italy - Market size and forecast (2023-2028) ($ million)
      • Chart on Italy - Year-over-year growth (2023-2028) (%)
      • Data Table on Italy - Year-over-year growth (2023-2028) (%)
    • 11.16 China - Market size and forecast (2023-2028)
      • Chart on China - Market size and forecast (2023-2028) ($ million)
      • Data Table on China - Market size and forecast (2023-2028) ($ million)
      • Chart on China - Year-over-year growth (2023-2028) (%)
      • Data Table on China - Year-over-year growth (2023-2028) (%)
    • 11.17 India - Market size and forecast (2023-2028)
      • Chart on India - Market size and forecast (2023-2028) ($ million)
      • Data Table on India - Market size and forecast (2023-2028) ($ million)
      • Chart on India - Year-over-year growth (2023-2028) (%)
      • Data Table on India - Year-over-year growth (2023-2028) (%)
    • 11.18 Japan - Market size and forecast (2023-2028)
      • Chart on Japan - Market size and forecast (2023-2028) ($ million)
      • Data Table on Japan - Market size and forecast (2023-2028) ($ million)
      • Chart on Japan - Year-over-year growth (2023-2028) (%)
      • Data Table on Japan - Year-over-year growth (2023-2028) (%)
    • 11.19 Brazil - Market size and forecast (2023-2028)
      • Chart on Brazil - Market size and forecast (2023-2028) ($ million)
      • Data Table on Brazil - Market size and forecast (2023-2028) ($ million)
      • Chart on Brazil - Year-over-year growth (2023-2028) (%)
      • Data Table on Brazil - Year-over-year growth (2023-2028) (%)
    • 11.20 Egypt - Market size and forecast (2023-2028)
      • Chart on Egypt - Market size and forecast (2023-2028) ($ million)
      • Data Table on Egypt - Market size and forecast (2023-2028) ($ million)
      • Chart on Egypt - Year-over-year growth (2023-2028) (%)
      • Data Table on Egypt - Year-over-year growth (2023-2028) (%)
    • 11.21 UAE - Market size and forecast (2023-2028)
      • Chart on UAE - Market size and forecast (2023-2028) ($ million)
      • Data Table on UAE - Market size and forecast (2023-2028) ($ million)
      • Chart on UAE - Year-over-year growth (2023-2028) (%)
      • Data Table on UAE - Year-over-year growth (2023-2028) (%)
    • 11.22 Oman - Market size and forecast (2023-2028)
      • Chart on Oman - Market size and forecast (2023-2028) ($ million)
      • Data Table on Oman - Market size and forecast (2023-2028) ($ million)
      • Chart on Oman - Year-over-year growth (2023-2028) (%)
      • Data Table on Oman - Year-over-year growth (2023-2028) (%)
    • 11.23 Argentina - Market size and forecast (2023-2028)
      • Chart on Argentina - Market size and forecast (2023-2028) ($ million)
      • Data Table on Argentina - Market size and forecast (2023-2028) ($ million)
      • Chart on Argentina - Year-over-year growth (2023-2028) (%)
      • Data Table on Argentina - Year-over-year growth (2023-2028) (%)
    • 11.24 KSA - Market size and forecast (2023-2028)
      • Chart on KSA - Market size and forecast (2023-2028) ($ million)
      • Data Table on KSA - Market size and forecast (2023-2028) ($ million)
      • Chart on KSA - Year-over-year growth (2023-2028) (%)
      • Data Table on KSA - Year-over-year growth (2023-2028) (%)
    • 11.25 Rest of World (ROW) - Market size and forecast (2023-2028)
      • Chart on Rest of World (ROW) - Market size and forecast (2023-2028) ($ million)
      • Data Table on Rest of World (ROW) - Market size and forecast (2023-2028) ($ million)
      • Chart on Rest of World (ROW) - Year-over-year growth (2023-2028) (%)
      • Data Table on Rest of World (ROW) - Year-over-year growth (2023-2028) (%)

    12 Drivers, Challenges, and Opportunity/Restraints

    • 12.1 Market drivers
      • 12.2 Market challenges
        • 12.3 Impact of drivers and challenges
          • Impact of drivers and challenges in 2023 and 2028
        • 12.4 Market opportunities/restraints

          13 Competitive Landscape

          • 13.1 Overview
            • 13.2 Competitive Landscape
              • Overview on criticality of inputs and factors of differentiation
            • 13.3 Landscape disruption
              • Overview on factors of disruption
            • 13.4 Industry risks
              • Impact of key risks on business

            14 Competitive Analysis

            • 14.1 Companies profiled
              • Companies covered
            • 14.2 Market positioning of companies
              • Matrix on companies position and classification
            • 14.3 BRADS PLANT BASED LLC
              • BRADS PLANT BASED LLC - Overview
              • BRADS PLANT BASED LLC - Product / Service
              • BRADS PLANT BASED LLC - Key offerings
            • 14.4 DJ and A PTY Ltd.
              • DJ and A PTY Ltd. - Overview
              • DJ and A PTY Ltd. - Product / Service
              • DJ and A PTY Ltd. - Key offerings
            • 14.5 Kaleidoscope Foods
              • Kaleidoscope Foods - Overview
              • Kaleidoscope Foods - Product / Service
              • Kaleidoscope Foods - Key offerings
            • 14.6 Koninklijke Ahold Delhaize NV
              • Koninklijke Ahold Delhaize NV - Overview
              • Koninklijke Ahold Delhaize NV - Business segments
              • Koninklijke Ahold Delhaize NV - Key offerings
              • Koninklijke Ahold Delhaize NV - Segment focus
            • 14.7 NATRULY
              • NATRULY - Overview
              • NATRULY - Product / Service
              • NATRULY - Key offerings
            • 14.8 Rhythm Superfoods LLC
              • Rhythm Superfoods LLC - Overview
              • Rhythm Superfoods LLC - Product / Service
              • Rhythm Superfoods LLC - Key offerings
            • 14.9 Simply 7 Snacks LLC
              • Simply 7 Snacks LLC - Overview
              • Simply 7 Snacks LLC - Product / Service
              • Simply 7 Snacks LLC - Key offerings
            • 14.10 Smart Organic AD
              • Smart Organic AD - Overview
              • Smart Organic AD - Product / Service
              • Smart Organic AD - Key offerings
            • 14.11 The Kale Factory
              • The Kale Factory - Overview
              • The Kale Factory - Product / Service
              • The Kale Factory - Key offerings

            15 Appendix

            • 15.1 Scope of the report
              • 15.2 Inclusions and exclusions checklist
                • Inclusions checklist
                • Exclusions checklist
              • 15.3 Currency conversion rates for US$
                • Currency conversion rates for US$
              • 15.4 Research methodology
                • Research methodology
              • 15.5 Data procurement
                • Information sources
              • 15.6 Data validation
                • Data validation
              • 15.7 Validation techniques employed for market sizing
                • Validation techniques employed for market sizing
              • 15.8 Data synthesis
                • Data synthesis
              • 15.9 360 degree market analysis
                • 360 degree market analysis
              • 15.10 List of abbreviations
                • List of abbreviations

              Research Methodology

              Technavio presents a detailed picture of the market by way of study, synthesis, and summation of data from multiple sources. The analysts have presented the various facets of the market with a particular focus on identifying the key industry influencers. The data thus presented is comprehensive, reliable, and the result of extensive research, both primary and secondary.

              INFORMATION SOURCES

              Primary sources

              • Manufacturers and suppliers
              • Channel partners
              • Industry experts
              • Strategic decision makers

              Secondary sources

              • Industry journals and periodicals
              • Government data
              • Financial reports of key industry players
              • Historical data
              • Press releases

              DATA ANALYSIS

              Data Synthesis

              • Collation of data
              • Estimation of key figures
              • Analysis of derived insights

              Data Validation

              • Triangulation with data models
              • Reference against proprietary databases
              • Corroboration with industry experts

              REPORT WRITING

              Qualitative

              • Market drivers
              • Market challenges
              • Market trends
              • Five forces analysis

              Quantitative

              • Market size and forecast
              • Market segmentation
              • Geographical insights
              • Competitive landscape

              Interested in this report?

              Get your sample now to see our research methodology and insights!

              Download Now

              Frequently Asked Questions

              Packaged Kale Chips market growth will increase by $ 529.3 mn during 2024-2028 .

              The Packaged Kale Chips market is expected to grow at a CAGR of 22.86% during 2024-2028 .

              Packaged Kale Chips market is segmented by Product( Chips or crisps, Extruded snacks) Distribution Channel( Offline, Online, APAC, MEA, South America)

              BRADS PLANT BASED LLC, DJ and A PTY Ltd., Kaleidoscope Foods, Koninklijke Ahold Delhaize NV, NATRULY, Rhythm Superfoods LLC, Simply 7 Snacks LLC, Smart Organic AD, The Kale Factory are a few of the key vendors in the Packaged Kale Chips market.

              North America will register the highest growth rate of 34% among the other regions. Therefore, the Packaged Kale Chips market in North America is expected to garner significant business opportunities for the vendors during the forecast period.

              US, Canada, Germany, UK, Italy, France, China, India, Japan, Brazil, Egypt, UAE, Oman, Argentina, KSA, UAE, Brazil, Rest of World (ROW)

              • Growth in organized retail sectorHypermarkets and supermarkets are the two major offline distribution channels for packaged kale chips. Organized retailing is an integral part of offline distribution channels is the driving factor this market.
              • which facilitates the purchasing process for consumers and enables them to choose from a diverse range of packaged kale chips. Tesco Plc (Tesco) is the driving factor this market.
              • Target Brands Inc. (Target) is the driving factor this market.
              • and ALDI Inc. (ALDI) are some of the major hypermarkets and supermarkets that offer a plethora of packaged food products is the driving factor this market.
              • such as packaged kale chips. An increase in the number of organized retailers that offer shelf space for branded and private-label packaged kale chips is expected to drive the growth of the market during the forecast period. Tesco is the driving factor this market.
              • a multinational grocery and general merchandise retailer is the driving factor this market.
              • offers packaged kale chips of various established regional and global brands. Similarly is the driving factor this market.
              • ALDI is the driving factor this market.
              • one of the leading global discount retail shops is the driving factor this market.
              • offers a wide range of packaged kale chips. In addition is the driving factor this market.
              • a significant expansion in the number of retail stores that offer packaged kale chips is driving the growth of the global packaged kale chips market. For instance is the driving factor this market.
              • in March 2024 is the driving factor this market.
              • ALDI announced its plan to open 900 new stores in the US by 2028. These retailers have a global presence is the driving factor this market.
              • which helps them improve the visibility of packaged kale chips and increases the demand for such plant-based products. Therefore is the driving factor this market.
              • the growth of the organized retail sector is expected to fuel the growth of the market in focus during the forecast period. is the driving factor this market.

              The Packaged Kale Chips market vendors should focus on grabbing business opportunities from the Chips or crisps segment as it accounted for the largest market share in the base year.