
PARP (Poly ADP-Ribose Polymerase) Inhibitors Market Size 2025-2029
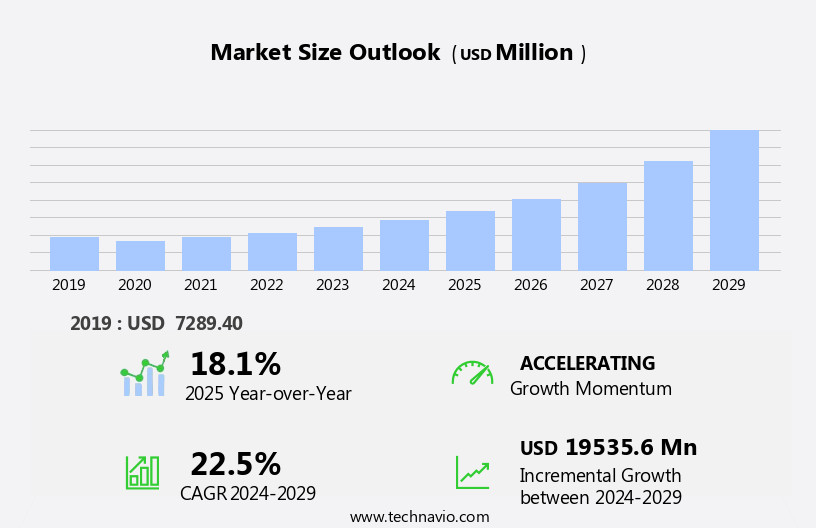
The PARP (poly ADP-ribose polymerase) inhibitors market size is forecast to increase by USD 19.54 billion at a CAGR of 22.5% between 2024 and 2029.
- The market is experiencing significant growth due to the expanding applications of these inhibitors in various therapeutic areas. PARP inhibitors have shown promising results in the treatment of various cancers, particularly in those with BRCA1 and BRCA2 gene mutations. The extensive ongoing research in this field is driving market growth, with numerous clinical trials underway to explore the potential of PARP inhibitors in combination with other therapies. Personalized medicine and precision medicine are key industry trends driving the PARP inhibitor market. However, the market faces challenges, including the development of resistance to PARP inhibitors in some patients. This resistance can limit the effectiveness of these therapies and necessitate the exploration of novel approaches to overcome it.
- Additionally, the high cost of PARP inhibitor therapies and the complexities involved in their administration can pose challenges for both patients and healthcare systems. Companies seeking to capitalize on the opportunities presented by the PARP Inhibitors Market must navigate these challenges effectively, focusing on developing more effective and cost-competitive therapies while addressing the issue of resistance. The advent of novel therapies, such as combination therapies and targeted delivery systems, holds promise in addressing these challenges and driving market growth. Artificial intelligence and advanced diagnostics are increasingly utilized to enhance the accuracy of diagnoses, enabling more effective interventions.
What will be the Size of the PARP (Poly ADP-Ribose Polymerase) Inhibitors Market during the forecast period?
Explore in-depth regional segment analysis with market size data - historical 2019-2023 and forecasts 2025-2029 - in the full report.
Request Free Sample
- The PARP inhibitor market is experiencing significant activity and trends in the realm of NGS-based diagnostics. Safety profile and data analysis play crucial roles in evaluating the efficacy and drug interactions of PARP inhibitors. Drug metabolism and resistance mechanisms continue to be key areas of research, influencing clinical trial design and combination therapies. In the preclinical phase I trials, drug efficacy against various tumor types is being explored. Liquid biopsy and circulating tumor DNA are essential tools for monitoring response and identifying biomarkers. Alcohol consumption and family history are among the lifestyle factors under investigation for their impact on PARP inhibitor response.
- Statistical significance and phase III trials are essential for determining the clinical relevance of PARP inhibitor treatments. Radiation dose, sensitivity, and planning are crucial factors in radiotherapy, with dosage and administration optimization a priority. Genetic predisposition and targeted drug delivery are also essential aspects of precision oncology, with personalized therapy tailored to individual tumor mutation burden and tumor heterogeneity. Car T-cell therapy and stereotactic radiosurgery are emerging treatment modalities, offering potential synergies with PARP inhibitors. Checkpoint inhibitors and BRCA gene mutations continue to be significant areas of research, with ongoing clinical trials investigating their role in combination with PARP inhibitors.
How is this PARP (Poly ADP-Ribose Polymerase) Inhibitors Industry segmented?
The PARP (poly ADP-ribose polymerase) inhibitors industry research report provides comprehensive data (region-wise segment analysis), with forecasts and estimates in "USD million" for the period 2025-2029, as well as historical data from 2019-2023 for the following segments.
- Distribution Channel
- Retail pharmacies
- Hospital pharmacies
- Online pharmacies
- End-user
- Ovarian cancer
- Breast cancer
- Others
- Drug Class
- Olaparib
- Niraparib
- Rucaparib
- Talazoparib
- Others
- Geography
- North America
- US
- Canada
- Mexico
- Europe
- France
- Germany
- Italy
- Spain
- UK
- APAC
- China
- Japan
- Rest of World (ROW)
- North America
By Distribution Channel Insights
The retail pharmacies segment is estimated to witness significant growth during the forecast period. In the realm of cancer therapy, PARP (poly ADP-ribose polymerase) inhibitors have emerged as a significant class of drugs, particularly in the treatment of solid tumors and genitourinary cancers. These inhibitors target the DNA damage response mechanism, specifically inhibiting PARP enzymes that help repair damaged DNA. The market for PARP inhibitors is driven by the increasing prevalence of cancer, regulatory approvals for new indications, and advancements in drug development. Patient selection is crucial in PARP inhibitor therapy, as these drugs are most effective in patients with specific genetic mutations, such as those with BRCA1 or BRCA2 gene mutations.
The high cost of these therapies, often in the range of tens of thousands of dollars per year, necessitates a robust healthcare system and market access. Genotoxic agents, such as chemotherapy and radiation, can also increase the efficacy of PARP inhibitors. Clinical trials and research continue to uncover new applications for PARP inhibitors, including in the treatment of ovarian, breast, and neurological cancers. The use of next-generation sequencing and tumor profiling has facilitated the identification of patients most likely to benefit from these therapies. Drug resistance and adverse effects are ongoing challenges in PARP inhibitor therapy, leading to the development of targeted therapies and synthetic lethality approaches.
Tumor suppressor genes, such as TP53, are also being explored as potential targets for PARP inhibitors. Liquid biopsy and diagnostic tests are enabling earlier detection and monitoring of cancer, further increasing the demand for PARP inhibitors. Despite these advancements, the PARP inhibitor market faces challenges, including intellectual property issues and regulatory hurdles. Regulatory approvals for new indications and combination therapies are essential to drive market growth. The quality of life and survival rates of patients using PARP inhibitors are significant clinical outcomes that are closely monitored. Hormone therapy and radiation therapy continue to be popular treatment options, while oncology drugs such as monoclonal antibodies, biosimilars, and vaccines are gaining popularity.
Retail pharmacies play an essential role in the distribution of PARP inhibitors, providing patients with convenient and accessible access to these specialized medications. The availability of PARP inhibitors in retail pharmacies ensures that patients can access their desired medications without the need for specialized medical care. The future of the PARP inhibitor market is promising, with ongoing research and development efforts aimed at expanding the indications and improving the efficacy and safety of these therapies.
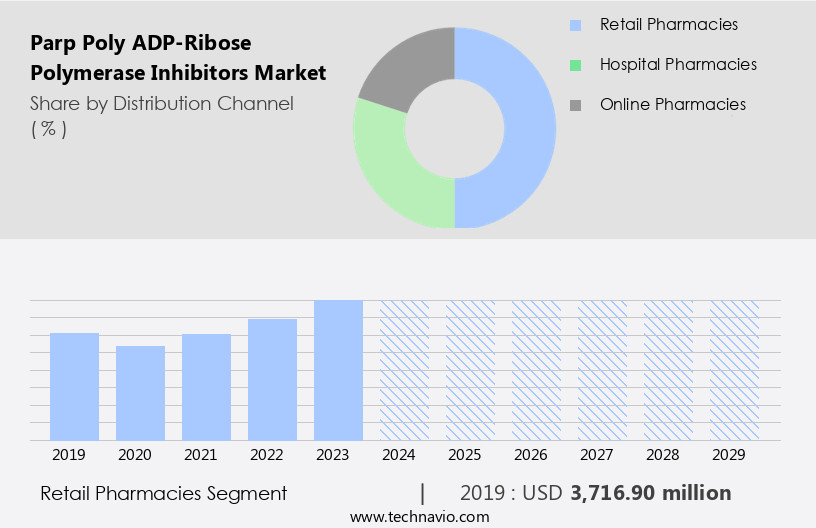
The Retail pharmacies segment was valued at USD 3716.90 million in 2019 and showed a gradual increase during the forecast period.
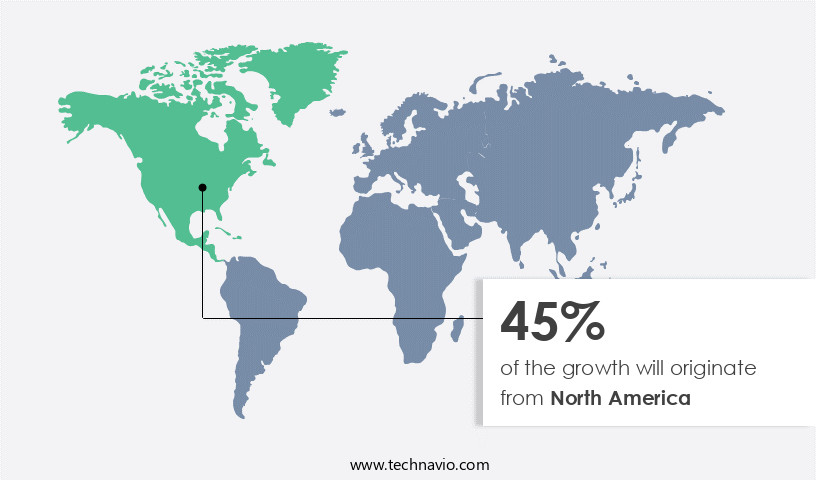
Regional Analysis
North America is estimated to contribute 45% to the growth of the global market during the forecast period. Technavio's analysts have elaborately explained the regional trends and drivers that shape the market during the forecast period.
The market is witnessing significant growth due to the increasing prevalence of various solid tumors, particularly in North America. Breast, prostate, and lung cancers are among the major types of cancers with high incidence rates in the region. In 2024, the American Cancer Society reported approximately 310,720 new cases of invasive breast cancer and 56,500 cases of ductal carcinoma in situ (DCIS) in the US. The market's expansion is driven by regulatory approvals of PARP inhibitors for various cancer indications, such as ovarian, breast, and prostate cancers. Genotoxic agents, which cause DNA damage, are key drivers of PARP inhibitor demand.
These agents can lead to the activation of PARP, an enzyme involved in DNA repair mechanisms. Inhibiting PARP can prevent the repair of DNA damage, making it an effective therapeutic strategy for certain types of cancers. Clinical trials and health economics studies continue to explore the potential of PARP inhibitors in improving clinical outcomes and reducing healthcare costs. Industry trends include the use of next-generation sequencing for tumor profiling and personalized medicine approaches. Drug development is focused on overcoming drug resistance mechanisms, such as synthetic lethality, and exploring new indications, such as multiple myeloma and pancreatic cancer.
Adverse effects and quality of life concerns are important considerations in market access and patient selection. Lung, gastric, and pancreatic cancers are among the solid tumors with high unmet medical needs. Intellectual property rights and regulatory approvals play a crucial role in market dynamics. Overall, the PARP inhibitors market is expected to continue its growth trajectory, driven by the increasing burden of cancer and the potential of these therapies to improve clinical outcomes and reduce healthcare costs.
Market Dynamics
Our researchers analyzed the data with 2024 as the base year, along with the key drivers, trends, and challenges. A holistic analysis of drivers will help companies refine their marketing strategies to gain a competitive advantage.
What are the Parp (Poly ADP-Ribose Polymerase) Inhibitors market drivers leading to the rise in the adoption of Industry?
- The expanded application of PARP inhibitors, a class of anticancer drugs, is the primary factor fueling market growth. These inhibitors, which block the PARP enzyme and prevent cancer cells from repairing DNA damage, are increasingly being used in various cancer treatments, including ovarian, breast, and prostate cancers, driving market expansion. The market is experiencing significant growth due to the expanding application of these innovative drugs in the DNA damage response field. Currently, three PARP inhibitors are approved for treating at least three indications, with ongoing clinical trials exploring their potential in various other oncology indications. The therapeutic landscape is vast, with each PARP inhibitor in clinical development being investigated for a minimum of ten indications.
- The application of PARP inhibitors is particularly relevant in the context of next-generation sequencing, which plays a crucial role in tumor profiling and identifying genetic mutations associated with drug resistance in breast and gynecologic cancers. The intellectual property landscape is also dynamic, with ongoing research and development efforts aimed at improving the efficacy and safety of these drugs. Overall, the PARP inhibitors market holds immense promise for revolutionizing cancer treatment and improving patient outcomes. This application diversity is increasing due to the high efficacy of these therapies in treating solid tumors. Additionally, studying a single molecule for multiple indications helps reduce the costs associated with conducting multiple pre-clinical and clinical trials.
What are the Parp (Poly ADP-Ribose Polymerase) Inhibitors market trends shaping the Industry?
- The current market landscape is characterized by extensive ongoing research, a trend that is both mandatory and noteworthy for professionals in various industries. This commitment to continuous investigation reflects the importance of staying informed and innovative in today's dynamic business environment. The market is experiencing significant growth due to the potential of these therapies in the treatment of various solid tumors, particularly in the field of personalized medicine and precision oncology. Liquid biopsy, a minimally invasive diagnostic technique, plays a crucial role in the identification of tumor suppressor gene mutations, enabling the effective use of PARP inhibitors in cancer therapy. Clinical outcomes from ongoing trials demonstrate the superior efficacy of PARP inhibitors in treating various solid tumors, including lung and gastric cancers. This has led to increased market access and a growing pipeline of promising therapies.
- Companies such as Jiangsu Hengrui Medicine Co., Ltd., BeiGene, AbbVie Inc., and Pfizer Inc., are at the forefront of PARP inhibitor research and development. However, it is essential to consider the potential adverse effects associated with PARP inhibitor use. As with any cancer therapy, careful monitoring and management of side effects are necessary to ensure optimal patient outcomes. Despite these challenges, the potential benefits of PARP inhibitors in cancer treatment make them a valuable addition to the oncology landscape. The PARP inhibitors market is witnessing significant growth due to their potential in the treatment of various solid tumors, particularly in the context of personalized medicine and precision oncology.
How does Parp (Poly ADP-Ribose Polymerase) Inhibitors market face challenges during its growth?
- The emergence of new therapies poses a significant challenge to the industry's growth trajectory. PARP inhibitors have demonstrated effectiveness in treating various types of solid tumors, including breast and ovarian cancers with BRCA mutations. However, the PARP inhibitor market faces challenges due to the emergence of alternative novel therapies, such as PD-1 inhibitors and HER-2 targeted therapies. These advanced treatments inhibit the growth of cancer cells by targeting specific proteins. The global oncology therapeutics market features several approved targeted therapies for various cancer types. The increasing cancer prevalence necessitates the development of more advanced therapies.
- Despite these advancements, PARP inhibitors remain a crucial component of cancer treatment due to their ability to improve quality of life and survival rates for patients with specific genetic profiles. Genetic testing plays a vital role in identifying patients who may benefit from PARP inhibitor therapy. The market's growth is influenced by the ongoing research and development in the field of cancer therapeutics. The use of liquid biopsy for the identification of tumor suppressor gene mutations and the growing pipeline of promising therapies make PARP inhibitors an exciting area of research and development in cancer therapy.
Exclusive Customer Landscape
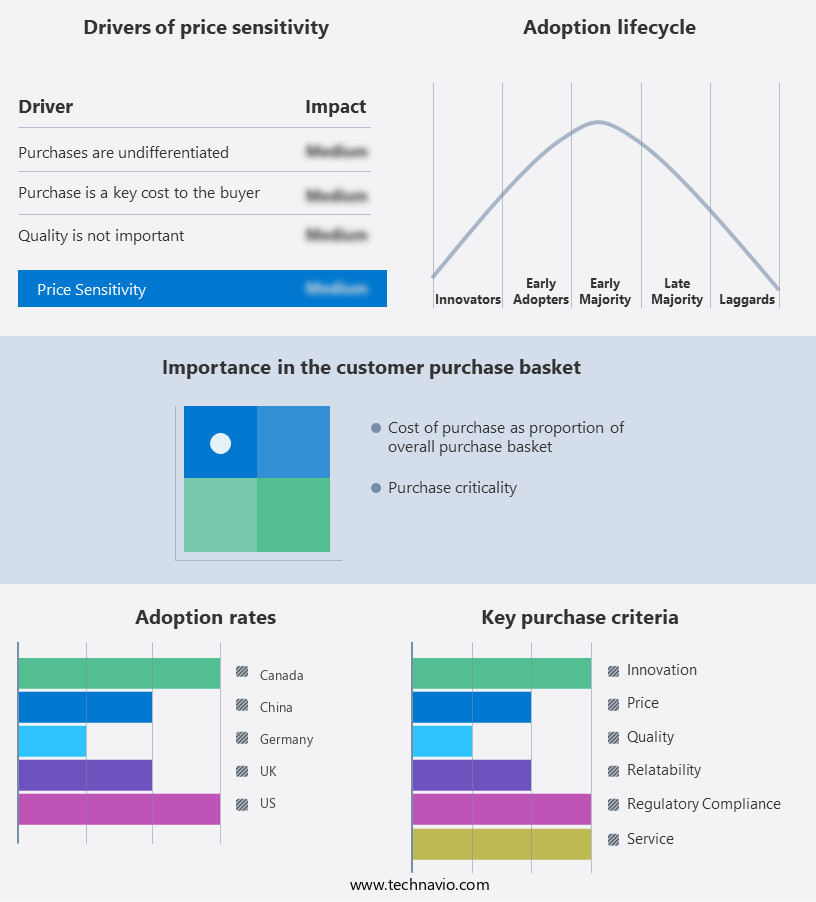
The PARP (poly adp-ribose polymerase) inhibitors market forecasting report includes the adoption lifecycle of the market, covering from the innovator's stage to the laggard's stage. It focuses on adoption rates in different regions based on penetration. Furthermore, the PARP (poly adp-ribose polymerase) inhibitors market report also includes key purchase criteria and drivers of price sensitivity to help companies evaluate and develop their market growth analysis strategies.
Customer Landscape
Key Companies & Market Insights
Companies are implementing various strategies, such as strategic alliances, PARP (poly adp-ribose polymerase) inhibitors market forecast, partnerships, mergers and acquisitions, geographical expansion, and product/service launches, to enhance their presence in the industry.
AbbVie Inc. - The company specializes in PARP (poly ADP-ribose polymerase) inhibitors, providing effective treatment options for patients battling squamous non-small cell lung cancer and triple negative breast cancer.
The industry research and growth report includes detailed analyses of the competitive landscape of the market and information about key companies, including:
- AbbVie Inc.
- Allarity Therapeutics Inc.
- Artios Pharma
- AstraZeneca Plc
- Bayer AG
- BeiGene Ltd.
- Daiichi Sankyo Co. Ltd.
- Everest Pharmaceuticals Ltd.
- GlaxoSmithKline Plc
- IMPACT Therapeutics
- Jeil Pharmaceuticals Co. Ltd.
- Jiangsu Hengrui Pharmaceuticals Co. Ltd.
- Johnson and Johnson Services Inc.
- Karyopharm Therapeutics Inc.
- Merck and Co. Inc.
- Ono Pharmaceutical Co. Ltd.
- Pfizer Inc.
- Repare Therapeutics Inc.
- Teva Pharmaceutical Industries Ltd.
- Zai Lab Ltd.
Qualitative and quantitative analysis of companies has been conducted to help clients understand the wider business environment as well as the strengths and weaknesses of key industry players. Data is qualitatively analyzed to categorize companies as pure play, category-focused, industry-focused, and diversified; it is quantitatively analyzed to categorize companies as dominant, leading, strong, tentative, and weak.
Recent Development and News in PARP (Poly ADP-Ribose Polymerase) Inhibitors Market
- In February 2023, Pfizer Inc. announced the successful completion of a Phase 3 trial for its PARP inhibitor, talazoparib, in the treatment of metastatic breast cancer. This marks a significant development in the PARP inhibitors market as talazoparib is expected to expand the treatment options for patients with BRCA1/2 mutations, according to Pfizer's press release.
- In July 2024, Merck KGaA and AstraZeneca entered into a strategic collaboration to co-develop and co-commercialize Lynparza (olaparib), a PARP inhibitor, for multiple cancer indications. This partnership is expected to strengthen both companies' positions in the oncology market and accelerate the growth of the PARP inhibitors market, as stated in Merck KGaA's official press release.
- In December 2024, Clovis Oncology received FDA approval for Rubraca (rucaparib), a PARP inhibitor, for the maintenance treatment of adult patients with recurrent epithelial ovarian, fallopian tube, or primary peritoneal cancer who are in a complete or partial response to platinum-based chemotherapy. This approval is expected to significantly expand the market potential for PARP inhibitors, as reported by Clovis Oncology.
- In March 2025, Roche Holding AG announced the acquisition of Foundation Medicine, a leading precision oncology company, for approximately USD2.4 billion. This acquisition is expected to provide Roche with access to Foundation Medicine's comprehensive genomic profiling assays, enabling the identification of patients who may benefit from PARP inhibitors, as stated in Roche's press release. This strategic move is expected to contribute to the growth of the PARP inhibitors market.
Research Analyst Overview
The PARP inhibitors market continues to evolve as research and development efforts in cancer therapy progress. These inhibitors target the poly adp-ribose polymerase (PARP) enzyme, which plays a crucial role in the DNA damage response. PARP inhibitors have shown efficacy in various solid tumors, including breast, ovarian, and lung cancers, as well as neurological and genitourinary cancers. The ongoing unfolding of market activities is influenced by several factors. Patient selection for treatment, healthcare costs, and regulatory approvals are key considerations in the industry. Genotoxic agents, such as chemotherapy and radiation therapy, can damage DNA and activate Parp, making Parp inhibitors an attractive option for cancer treatment.
The application of PARP inhibitors in personalized medicine and tumor profiling is a significant trend in the market. Precision medicine, which tailors treatment to individual patients based on their genetic makeup, is gaining momentum in the cancer therapy landscape. Tumor suppressor genes and DNA damage response mechanisms are critical components of this approach. Market access and drug development are also crucial aspects of the PARP inhibitors market. Synthetic lethality, a strategy that exploits the dependence of cancer cells on specific pathways, is a promising area of research. Next-generation sequencing and diagnostic tests are essential tools in identifying patients who may benefit from PARP inhibitor therapy.
Drug resistance is a challenge in cancer treatment, and PARP inhibitors are not immune to this issue. Adverse effects, such as anemia and nausea, are also considerations in the use of PARP inhibitors. However, improvements in quality of life and survival rates make these inhibitors a valuable addition to the cancer therapy arsenal. Gastric and pancreatic cancers are emerging areas of focus for Parp inhibitor research. Multiple myeloma and prostate cancer are also potential applications for these inhibitors. The ongoing research and development efforts in the Parp inhibitors market reflect the continuous dynamism of the cancer therapy landscape.
Dive into Technavio's robust research methodology, blending expert interviews, extensive data synthesis, and validated models for unparalleled Parp (Poly ADP-Ribose Polymerase) Inhibitors Market insights. See full methodology.
|
Market Scope |
|
|
Report Coverage |
Details |
|
Page number |
221 |
|
Base year |
2024 |
|
Historic period |
2019-2023 |
|
Forecast period |
2025-2029 |
|
Growth momentum & CAGR |
Accelerate at a CAGR of 22.5% |
|
Market growth 2025-2029 |
USD 19.54 billion |
|
Market structure |
Fragmented |
|
YoY growth 2024-2025(%) |
18.1 |
|
Key countries |
US, UK, Canada, Germany, China, France, Italy, Spain, Japan, and Mexico |
|
Competitive landscape |
Leading Companies, Market Positioning of Companies, Competitive Strategies, and Industry Risks |
What are the Key Data Covered in this Parp (Poly ADP-Ribose Polymerase) Inhibitors Market Research and Growth Report?
- CAGR of the Parp (Poly ADP-Ribose Polymerase) Inhibitors industry during the forecast period
- Detailed information on factors that will drive the growth and forecasting between 2025 and 2029
- Precise estimation of the size of the market and its contribution of the industry in focus to the parent market
- Accurate predictions about upcoming growth and trends and changes in consumer behaviour
- Growth of the market across North America, Europe, Asia, and Rest of World (ROW)
- Thorough analysis of the market's competitive landscape and detailed information about companies
- Comprehensive analysis of factors that will challenge the parp (poly adp-ribose polymerase) inhibitors market growth of industry companies
We can help! Our analysts can customize this parp (poly adp-ribose polymerase) inhibitors market research report to meet your requirements.
 RIA -
RIA - 
