Party Supplies Market Analysis, Size, and Forecast 2025-2029: North America (US, Canada, and Mexico), Europe (Germany, UK, and France), APAC (China, India, and Japan), Middle East and Africa (Saudi Arabia, UAE, and South Africa), South America (Brazil, Argentina, and Colombia), and Rest of World (ROW)

Party Supplies Market Analysis, Size, and Forecast 2025-2029:
North America (US, Canada, and Mexico), Europe (Germany, UK, and France), APAC (China, India, and Japan), Middle East and Africa (Saudi Arabia, UAE, and South Africa), South America (Brazil, Argentina, and Colombia), and Rest of World (ROW)

Published: Dec 2025 290 Pages SKU: IRTNTR81160

Market Overview at a Glance

$8.72 B
Market Opportunity
9.1%
CAGR 2024 - 2029
39.8%
North America Growth
$8.54 B
Residential use segment 2023

Party Supplies Market Size 2025-2029

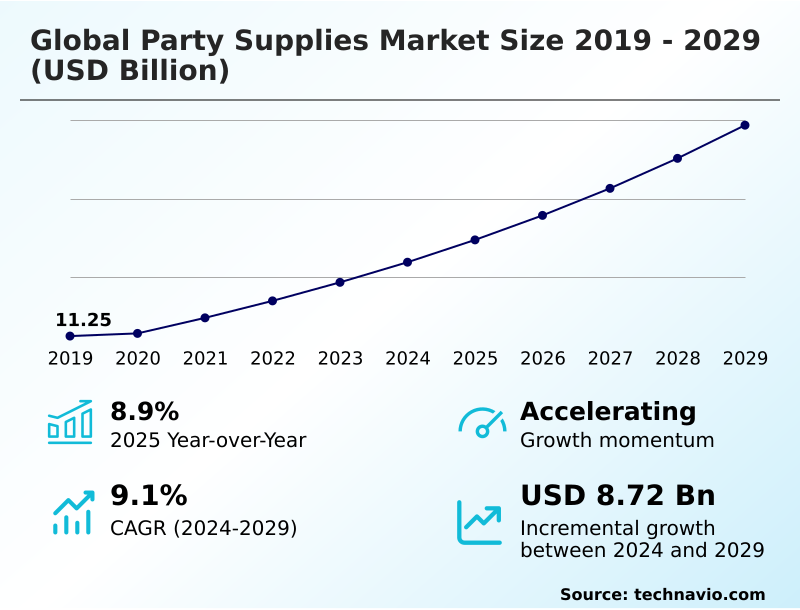
The party supplies market size is valued to increase by USD 8.72 billion, at a CAGR of 9.1% from 2024 to 2029. Proliferation of social media and rise of visually curated celebrations will drive the party supplies market.

Major Market Trends & Insights

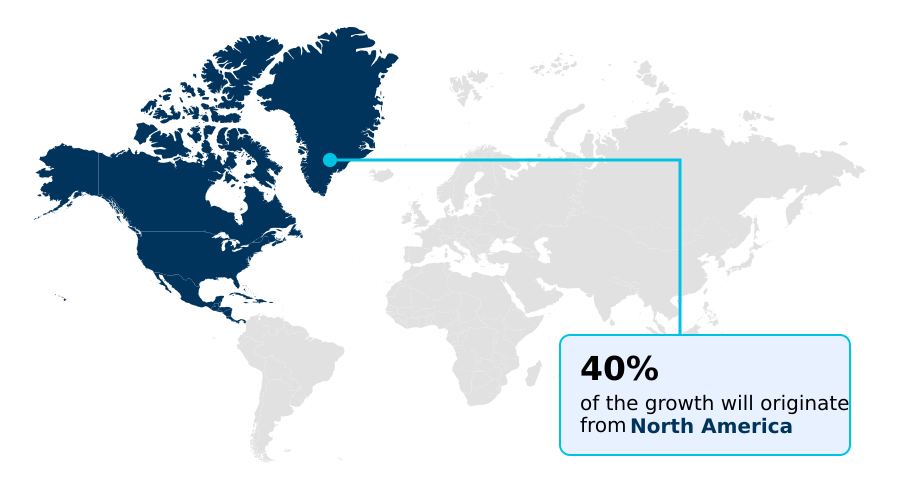
  • North America dominated the market and accounted for a 39.8% growth during the forecast period.
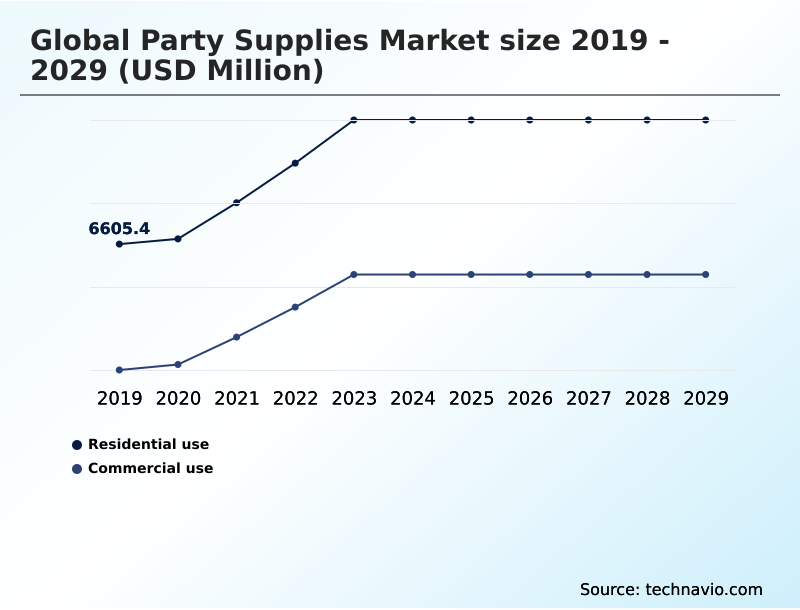
  • By Application - Residential use segment was valued at USD 8.54 billion in 2023
  • By Type - Tableware and disposables segment accounted for the largest market revenue share in 2023

Market Size & Forecast

  • Market Opportunities: USD 13.42 billion
  • Market Future Opportunities: USD 8.72 billion
  • CAGR from 2024 to 2029 : 9.1%

Market Summary

  • The Party Supplies Market is undergoing a significant transformation, driven by the convergence of digital innovation and evolving consumer values. A primary dynamic is the move toward hyper-personalization in events, where print-on-demand technology and digital invitation platforms allow for unparalleled customization. This trend is fueled by visual-centric social media, which has elevated the importance of creating unique, shareable moments.
  • Concurrently, a strong push toward sustainability is compelling manufacturers to invest in green product development, introducing biodegradable latex balloons and compostable tableware as mainstream options. This shift creates complex operational scenarios; for instance, a company must balance the higher cost of sustainable raw materials against intense price competition while ensuring its supply chain can handle both traditional and eco-friendly inventory.
  • The market's future hinges on the ability of businesses to leverage technology for personalization, such as offering custom acrylic cake toppers and licensed character merchandise, while navigating the regulatory and consumer-driven demand for greater environmental responsibility, including the adoption of reusable fabric decorations and other single-use plastic alternatives.

What will be the Size of the Party Supplies Market during the forecast period?

Get Key Insights on Market Forecast (PDF) Request Free Sample

How is the Party Supplies Market Segmented?

The party supplies industry research report provides comprehensive data (region-wise segment analysis), with forecasts and estimates in "USD million" for the period 2025-2029, as well as historical data from 2019-2023 for the following segments.

  • Application
    • Residential use
    • Commercial use
  • Type
    • Tableware and disposables
    • Balloons
    • Banners and home decor
    • Games and piatas
    • Others
  • Distribution channel
    • Offline
    • Online
  • Geography
    • North America
      • US
      • Canada
      • Mexico
    • Europe
      • Germany
      • UK
      • France
    • APAC
      • China
      • India
      • Japan
    • Middle East and Africa
      • Saudi Arabia
      • UAE
      • South Africa
    • South America
      • Brazil
      • Argentina
      • Colombia
    • Rest of World (ROW)

By Application Insights

The residential use segment is estimated to witness significant growth during the forecast period.

The residential use segment is defined by individual consumers purchasing for private events, a landscape increasingly shaped by experiential consumerism influence. The demand for bespoke party favors and custom-color balloon arches is driven by the desire for 'Instagrammable' event aesthetics.

This has led to a focus on premium decorative accessories and curated product collections. An omnichannel retail strategy is crucial, as consumers blend online discovery with in-store purchases of DIY party crafting supplies.

In response to consumer environmental awareness, a shift toward sustainable material innovation is evident, with some brands reporting a 20% reduction in plastic waste through the adoption of bamboo-based partyware and other eco-friendly party supplies, reflecting a broader move towards sustainable celebration trends.

Request Free Sample

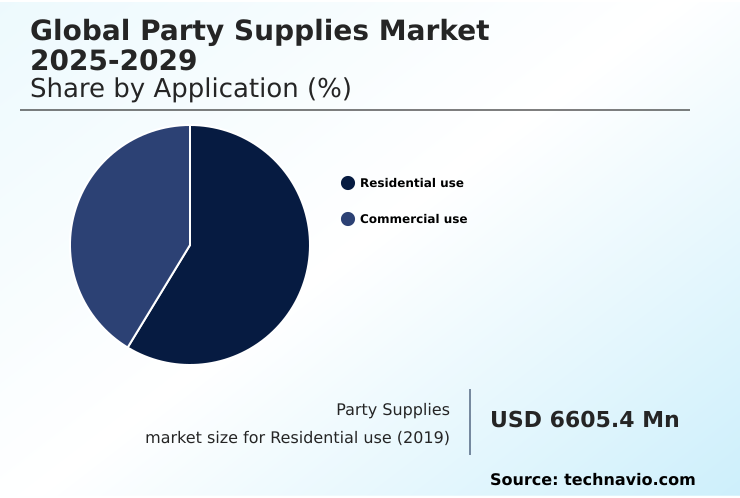
The Residential use segment was valued at USD 8.54 billion in 2023 and showed a gradual increase during the forecast period.

Request Free Sample

Regional Analysis

North America is estimated to contribute 39.8% to the growth of the global market during the forecast period.Technavio’s analysts have elaborately explained the regional trends and drivers that shape the market during the forecast period.

See How Party Supplies Market Demand is Rising in North America Request Free Sample

The global party supplies market exhibits distinct regional dynamics, with North America leading in market size, accounting for nearly 40% of incremental growth. This is driven by high disposable incomes and a strong culture of experiential consumerism.

Europe's market is heavily influenced by regulatory pressure on plastics, pushing for sustainable material innovation and premiumization of party goods.

The APAC region is the fastest-growing, fueled by an expanding middle class and e-commerce channel dominance, with digital discovery tools driving a 50% year-over-year increase in online sales in emerging markets.

This growth is supported by Mylar foil balloons and other popular products. The Middle East focuses on professional-grade event decor for lavish celebrations, while South America's market is characterized by vibrant, large-scale public festivals.

Corporate social responsibility mandates are becoming a global factor, particularly in commercial purchasing.

Market Dynamics

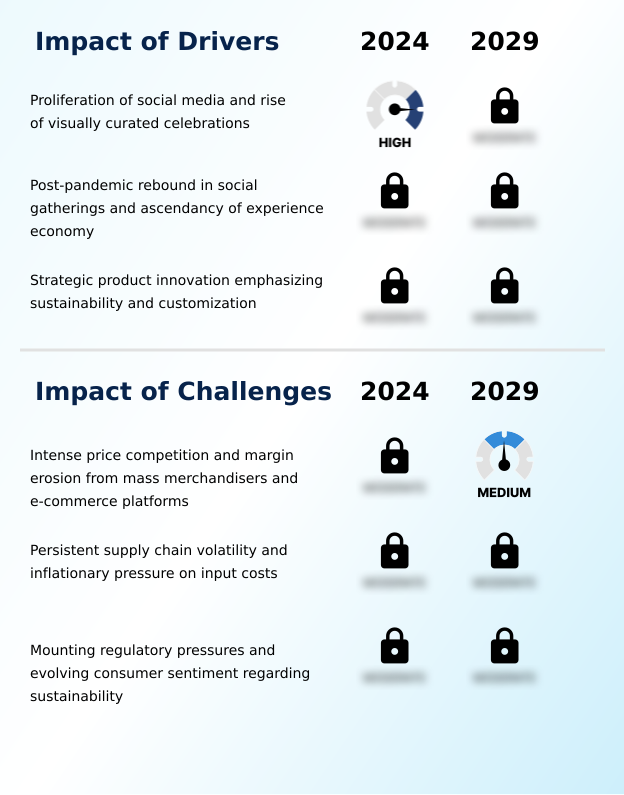
Our researchers analyzed the data with 2024 as the base year, along with the key drivers, trends, and challenges. A holistic analysis of drivers will help companies refine their marketing strategies to gain a competitive advantage.

  • The global party supplies market is navigating a complex landscape defined by evolving consumer demands and operational challenges. The impact of social media on party decor is undeniable, compelling a strategic response from retailers and manufacturers alike. Successful firms are those mastering omnichannel strategies for party supply retailers, integrating online and offline experiences seamlessly.
  • This integration has proven critical, as businesses that effectively leverage digital platforms for marketing party supplies on TikTok shop and other social commerce channels report customer acquisition costs that are significantly lower than those relying solely on traditional advertising.
  • A key focus is the growth of personalized party supplies online, where advancements in the role of digital printing in customization allow for unique offerings. Concurrently, the industry grapples with the challenges of helium shortage for balloons and adapts to single-use plastic regulations by promoting the rise of sustainable party product innovation and exploring eco-friendly alternatives for single-use plastics.
  • The increasing demand for biodegradable materials is a direct result of the post-pandemic recovery of social events, where the consumer shift towards experiential spending now includes a preference for sustainability.
  • This has led to new opportunities in the DIY party supplies market and a focus on creating unique party favors for guests, further driving the trend of premiumization in party tableware.

What are the key market drivers leading to the rise in the adoption of Party Supplies Industry?

  • The proliferation of social media and the corresponding rise of visually curated celebrations are key drivers reshaping consumer expectations and purchasing behavior in the market.

  • The market's momentum is significantly driven by a shift in value-oriented purchasing behavior toward the creation of 'Instagrammable' event aesthetics.
  • This trend, amplified by visual-centric social media, has directly contributed to niche market development, with specialized themes seeing a 30% faster adoption rate than generic supplies.
  • The post-pandemic resurgence in social gatherings is amplified by the experience economy spending shift, where consumers invest more in creating memorable moments. This has fueled the growth of themed party kits and licensed character merchandise.
  • The rise of digital discovery tools on social platforms has streamlined the path from inspiration to purchase, with integrated shopping features increasing conversion rates by up to 22% for visually appealing products like custom-color balloon arches.

What are the market trends shaping the Party Supplies Industry?

  • The ascendancy of sustainable and eco-conscious celebrations represents a significant market trend, compelling a reevaluation of product lifecycles from material sourcing to post-event disposal.

  • A defining trend is the industry's pivot to circular economy principles, driven by intense consumer environmental awareness. This has catalyzed widespread green product development, with manufacturers focusing on compostable tableware and FSC certified paper products. Firms that have integrated these sustainable celebration trends into their core offerings report an 18% improvement in brand perception among younger demographics.
  • Hyper-personalization in events is another dominant force, enabled by print-on-demand technology and advanced social commerce integration, allowing for deep customization. This is supported by an omnichannel shopping experience that combines digital convenience with experiential retail destinations, meeting the modern consumer's expectation for both choice and engagement. This shift reflects a broader focus on at-home entertainment.

What challenges does the Party Supplies Industry face during its growth?

  • Intense price competition and margin erosion, driven by mass merchandisers and e-commerce platforms, present a significant challenge to industry profitability.

  • The market confronts significant headwinds from persistent supply chain volatility, which has increased logistical costs by an average of 15% for many operators. This is compounded by intense mass-market merchandiser competition, which puts downward pressure on margins and makes it difficult to compete on price alone.
  • Furthermore, mounting regulatory pressure on plastics necessitates a costly and rapid transition to single-use plastic alternatives. Companies investing in R&D for these new materials face an initial 20% increase in production costs before achieving scale.
  • These challenges demand a robust omnichannel retail strategy and innovative direct-to-consumer business models to maintain profitability while navigating raw material inflationary pressure and evolving corporate social responsibility mandates.

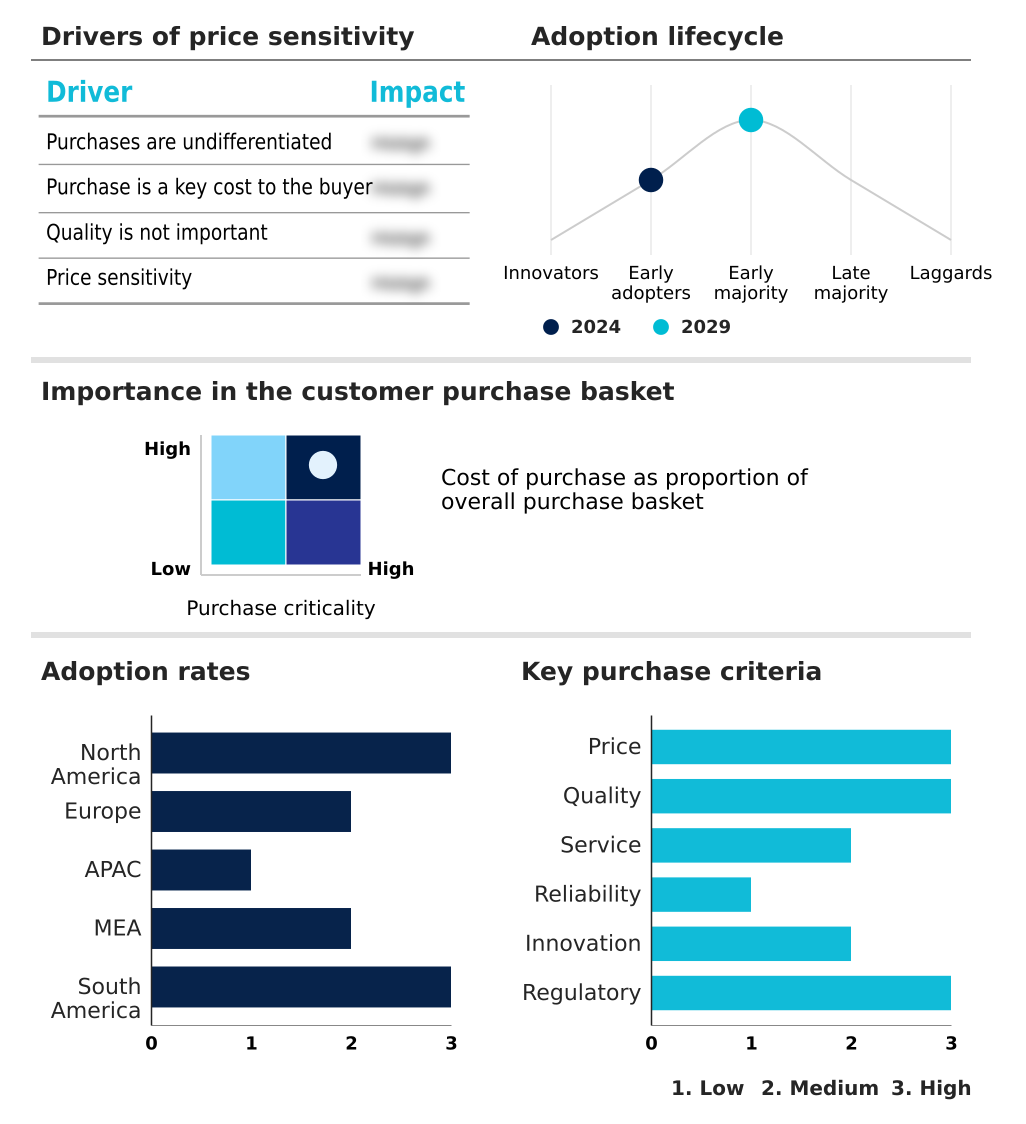
Exclusive Technavio Analysis on Customer Landscape

The party supplies market forecasting report includes the adoption lifecycle of the market, covering from the innovator’s stage to the laggard’s stage. It focuses on adoption rates in different regions based on penetration. Furthermore, the party supplies market report also includes key purchase criteria and drivers of price sensitivity to help companies evaluate and develop their market growth analysis strategies.

Customer Landscape of Party Supplies Industry

Competitive Landscape

Companies are implementing various strategies, such as strategic alliances, party supplies market forecast, partnerships, mergers and acquisitions, geographical expansion, and product/service launches, to enhance their presence in the industry.

Amazon.com Inc. - An extensive marketplace provides a vast selection of party supplies from numerous third-party sellers and proprietary brands.

The industry research and growth report includes detailed analyses of the competitive landscape of the market and information about key companies, including:

  • Amazon.com Inc.
  • Anagram International, Inc.
  • Creative Converting
  • Dart Container Corp.
  • Dollar Tree Inc.
  • Etsy Inc.
  • Fun Express LLC
  • Hallmark Card Inc.
  • Oriental Trading Co.
  • Party City Holdco Inc.
  • PD-Party
  • Pioneer Balloon Company
  • Rubies II LLC.
  • Shutterfly Inc.
  • Smiffys
  • Target Corp.
  • The Beistle Company
  • Unique Industries, Inc.
  • Walmart Inc.
  • Zazzle Inc.

Qualitative and quantitative analysis of companies has been conducted to help clients understand the wider business environment as well as the strengths and weaknesses of key industry players. Data is qualitatively analyzed to categorize companies as pure play, category-focused, industry-focused, and diversified; it is quantitatively analyzed to categorize companies as dominant, leading, strong, tentative, and weak.

Recent Development and News in Party supplies market

  • In September 2024, EcoCelebrations Inc. announced the launch of its 'Earth-First' collection, a complete line of party supplies made from advanced polylactic acid (PLA) materials and FSC certified paper products, achieving 100% home compostability.
  • In November 2024, social media platform VibeTok partnered with global e-commerce leader ShopSphere to integrate seamless shoppable video content functionality, allowing users to purchase themed party kits and supplies directly from influencer streams.
  • In January 2025, Party Retail Holdings confirmed its acquisition of PersonalizeIt, a tech startup specializing in AI-driven augmented reality visualization tools that allow customers to preview custom decorations in their homes before buying.
  • In April 2025, the European Commission introduced an expanded Single-Use Plastics Directive, adding new categories of party-related items to the restricted list, compelling manufacturers to accelerate their development of single-use plastic alternatives.

Dive into Technavio’s robust research methodology, blending expert interviews, extensive data synthesis, and validated models for unparalleled Party Supplies Market insights. See full methodology.

Market Scope
Page number 290
Base year 2024
Historic period 2019-2023
Forecast period 2025-2029
Growth momentum & CAGR Accelerate at a CAGR of 9.1%
Market growth 2025-2029 USD 8719.1 million
Market structure Fragmented
YoY growth 2024-2025(%) 8.9%
Key countries US, Canada, Mexico, Germany, UK, France, Italy, The Netherlands, Spain, China, India, Japan, South Korea, Australia, Indonesia, Saudi Arabia, UAE, South Africa, Israel, Turkey, Brazil, Argentina and Colombia
Competitive landscape Leading Companies, Market Positioning of Companies, Competitive Strategies, and Industry Risks

Request Free Sample

Research Analyst Overview

  • The party supplies market is defined by a rapid evolution toward customization and sustainability. The integration of print-on-demand services and digital printing advancements enables the production of bespoke items like custom acrylic cake toppers and personalized digital invitations, catering to a demand for unique, immersive themed experiences.
  • The industry is also pivoting to address environmental concerns through sustainable material innovation, with a marked increase in eco-friendly party supplies such as bamboo-based partyware and polylactic acid (PLA) materials. This strategic shift away from single-use plastics is crucial, as firms adopting these alternatives have reported a 25% reduction in compliance-related risks in regulated markets.
  • This has also spurred the development of helium-free balloon designs and reusable fabric decorations. Success now depends on leveraging party planning software and an effective omnichannel retail strategy to deliver these curated product collections, whether for corporate branding guidelines or private celebrations. The ability to offer licensed intellectual property within these modern, sustainable frameworks is a key competitive differentiator.

What are the Key Data Covered in this Party Supplies Market Research and Growth Report?

  • What is the expected growth of the Party Supplies Market between 2025 and 2029?

    • USD 8.72 billion, at a CAGR of 9.1%

  • What segmentation does the market report cover?

    • The report is segmented by Application (Residential use, and Commercial use), Type (Tableware and disposables, Balloons, Banners and home decor, Games and piatas, and Others), Distribution Channel (Offline, and Online) and Geography (North America, Europe, APAC, Middle East and Africa, South America)

  • Which regions are analyzed in the report?

    • North America, Europe, APAC, Middle East and Africa and South America

  • What are the key growth drivers and market challenges?

    • Proliferation of social media and rise of visually curated celebrations, Intense price competition and margin erosion from mass merchandisers and e-commerce platforms

  • Who are the major players in the Party Supplies Market?

    • Amazon.com Inc., Anagram International, Inc., Creative Converting, Dart Container Corp., Dollar Tree Inc., Etsy Inc., Fun Express LLC, Hallmark Card Inc., Oriental Trading Co., Party City Holdco Inc., PD-Party, Pioneer Balloon Company, Rubies II LLC., Shutterfly Inc., Smiffys, Target Corp., The Beistle Company, Unique Industries, Inc., Walmart Inc. and Zazzle Inc.

Market Research Insights

  • The market is shaped by a powerful shift in experience economy spending, with consumers prioritizing memorable events. This trend of post-pandemic social gatherings has accelerated the demand for personalized products, a need met by increasingly sophisticated direct-to-consumer business models that have shown a 25% higher customer engagement rate compared to traditional retail.
  • The diversification of cultural celebrations is also creating new niche markets. However, the industry contends with significant supply chain volatility impact and raw material inflationary pressure, which has led to a 10% average increase in input costs.
  • In response, businesses are implementing local sourcing initiatives, which have been shown to improve supply reliability by up to 30% in some cases, highlighting a strategic pivot to mitigate global disruptions and align with consumer values.

We can help! Our analysts can customize this party supplies market research report to meet your requirements.

Get in touch

1. Executive Summary

1.1 Market overview

Executive Summary - Chart on Market Overview
Executive Summary - Data Table on Market Overview
Executive Summary - Chart on Global Market Characteristics
Executive Summary - Chart on Market by Geography
Executive Summary - Chart on Market Segmentation by Application
Executive Summary - Chart on Market Segmentation by Type
Executive Summary - Chart on Market Segmentation by Distribution Channel
Executive Summary - Chart on Incremental Growth
Executive Summary - Data Table on Incremental Growth
Executive Summary - Chart on Company Market Positioning

2. Technavio Analysis

2.1 Analysis of price sensitivity, lifecycle, customer purchase basket, adoption rates, and purchase criteria

2.2 Criticality of inputs and Factors of differentiation

Chart on Overview on criticality of inputs and factors of differentiation

2.3 Factors of disruption

Chart on Overview on factors of disruption

2.4 Impact of drivers and challenges

Chart on Impact of drivers and challenges in 2024 and 2029

3. Market Landscape

3.1 Market ecosystem

Chart on Parent Market
Data Table on - Parent Market

3.2 Market characteristics

Chart on Market characteristics analysis

3.3 Value chain analysis

Chart on Value chain analysis

4. Market Sizing

4.1 Market definition

Data Table on Offerings of companies included in the market definition

4.2 Market segment analysis

Market segments

4.3 Market size 2024

4.4 Market outlook: Forecast for 2024-2029

Chart on Global - Market size and forecast 2024-2029 ($ million)
Data Table on Global - Market size and forecast 2024-2029 ($ million)
Chart on Global Market: Year-over-year growth 2024-2029 (%)
Data Table on Global Market: Year-over-year growth 2024-2029 (%)

5. Historic Market Size

5.1 Global Party Supplies Market 2019 - 2023

Historic Market Size - Data Table on Global Party Supplies Market 2019 - 2023 ($ million)

5.2 Application segment analysis 2019 - 2023

Historic Market Size - Application Segment 2019 - 2023 ($ million)

5.3 Type segment analysis 2019 - 2023

Historic Market Size - Type Segment 2019 - 2023 ($ million)

5.4 Distribution Channel segment analysis 2019 - 2023

Historic Market Size - Distribution Channel Segment 2019 - 2023 ($ million)

5.5 Geography segment analysis 2019 - 2023

Historic Market Size - Geography Segment 2019 - 2023 ($ million)

5.6 Country segment analysis 2019 - 2023

Historic Market Size - Country Segment 2019 - 2023 ($ million)

6. Five Forces Analysis

6.1 Five forces summary

Five forces analysis - Comparison between 2024 and 2029

6.2 Bargaining power of buyers

Bargaining power of buyers - Impact of key factors 2024 and 2029

6.3 Bargaining power of suppliers

Bargaining power of suppliers - Impact of key factors in 2024 and 2029

6.4 Threat of new entrants

Threat of new entrants - Impact of key factors in 2024 and 2029

6.5 Threat of substitutes

Threat of substitutes - Impact of key factors in 2024 and 2029

6.6 Threat of rivalry

Threat of rivalry - Impact of key factors in 2024 and 2029

6.7 Market condition

Chart on Market condition - Five forces 2024 and 2029

7. Market Segmentation by Application

7.1 Market segments

Chart on Application - Market share 2024-2029 (%)
Data Table on Application - Market share 2024-2029 (%)

7.2 Comparison by Application

Chart on Comparison by Application
Data Table on Comparison by Application

7.3 Residential use - Market size and forecast 2024-2029

Chart on Residential use - Market size and forecast 2024-2029 ($ million)
Data Table on Residential use - Market size and forecast 2024-2029 ($ million)
Chart on Residential use - Year-over-year growth 2024-2029 (%)
Data Table on Residential use - Year-over-year growth 2024-2029 (%)

7.4 Commercial use - Market size and forecast 2024-2029

Chart on Commercial use - Market size and forecast 2024-2029 ($ million)
Data Table on Commercial use - Market size and forecast 2024-2029 ($ million)
Chart on Commercial use - Year-over-year growth 2024-2029 (%)
Data Table on Commercial use - Year-over-year growth 2024-2029 (%)

7.5 Market opportunity by Application

Market opportunity by Application ($ million)
Data Table on Market opportunity by Application ($ million)

8. Market Segmentation by Type

8.1 Market segments

Chart on Type - Market share 2024-2029 (%)
Data Table on Type - Market share 2024-2029 (%)

8.2 Comparison by Type

Chart on Comparison by Type
Data Table on Comparison by Type

8.3 Tableware and disposables - Market size and forecast 2024-2029

Chart on Tableware and disposables - Market size and forecast 2024-2029 ($ million)
Data Table on Tableware and disposables - Market size and forecast 2024-2029 ($ million)
Chart on Tableware and disposables - Year-over-year growth 2024-2029 (%)
Data Table on Tableware and disposables - Year-over-year growth 2024-2029 (%)

8.4 Balloons - Market size and forecast 2024-2029

Chart on Balloons - Market size and forecast 2024-2029 ($ million)
Data Table on Balloons - Market size and forecast 2024-2029 ($ million)
Chart on Balloons - Year-over-year growth 2024-2029 (%)
Data Table on Balloons - Year-over-year growth 2024-2029 (%)

8.5 Banners and home decor - Market size and forecast 2024-2029

Chart on Banners and home decor - Market size and forecast 2024-2029 ($ million)
Data Table on Banners and home decor - Market size and forecast 2024-2029 ($ million)
Chart on Banners and home decor - Year-over-year growth 2024-2029 (%)
Data Table on Banners and home decor - Year-over-year growth 2024-2029 (%)

8.6 Games and piatas - Market size and forecast 2024-2029

Chart on Games and piatas - Market size and forecast 2024-2029 ($ million)
Data Table on Games and piatas - Market size and forecast 2024-2029 ($ million)
Chart on Games and piatas - Year-over-year growth 2024-2029 (%)
Data Table on Games and piatas - Year-over-year growth 2024-2029 (%)

8.7 Others - Market size and forecast 2024-2029

Chart on Others - Market size and forecast 2024-2029 ($ million)
Data Table on Others - Market size and forecast 2024-2029 ($ million)
Chart on Others - Year-over-year growth 2024-2029 (%)
Data Table on Others - Year-over-year growth 2024-2029 (%)

8.8 Market opportunity by Type

Market opportunity by Type ($ million)
Data Table on Market opportunity by Type ($ million)

9. Market Segmentation by Distribution Channel

9.1 Market segments

Chart on Distribution Channel - Market share 2024-2029 (%)
Data Table on Distribution Channel - Market share 2024-2029 (%)

9.2 Comparison by Distribution Channel

Chart on Comparison by Distribution Channel
Data Table on Comparison by Distribution Channel

9.3 Offline - Market size and forecast 2024-2029

Chart on Offline - Market size and forecast 2024-2029 ($ million)
Data Table on Offline - Market size and forecast 2024-2029 ($ million)
Chart on Offline - Year-over-year growth 2024-2029 (%)
Data Table on Offline - Year-over-year growth 2024-2029 (%)

9.4 Online - Market size and forecast 2024-2029

Chart on Online - Market size and forecast 2024-2029 ($ million)
Data Table on Online - Market size and forecast 2024-2029 ($ million)
Chart on Online - Year-over-year growth 2024-2029 (%)
Data Table on Online - Year-over-year growth 2024-2029 (%)

9.5 Market opportunity by Distribution Channel

Market opportunity by Distribution Channel ($ million)
Data Table on Market opportunity by Distribution Channel ($ million)

10. Customer Landscape

10.1 Customer landscape overview

Analysis of price sensitivity, lifecycle, customer purchase basket, adoption rates, and purchase criteria

11. Geographic Landscape

11.1 Geographic segmentation

Chart on Market share by geography 2024-2029 (%)
Data Table on Market share by geography 2024-2029 (%)

11.2 Geographic comparison

Chart on Geographic comparison
Data Table on Geographic comparison

11.3 North America - Market size and forecast 2024-2029

Chart on North America - Market size and forecast 2024-2029 ($ million)
Data Table on North America - Market size and forecast 2024-2029 ($ million)
Chart on North America - Year-over-year growth 2024-2029 (%)
Data Table on North America - Year-over-year growth 2024-2029 (%)
Chart on Regional Comparison - North America
Data Table on Regional Comparison - North America

11.3.1 US - Market size and forecast 2024-2029

Chart on US - Market size and forecast 2024-2029 ($ million)
Data Table on US - Market size and forecast 2024-2029 ($ million)
Chart on US - Year-over-year growth 2024-2029 (%)
Data Table on US - Year-over-year growth 2024-2029 (%)

11.3.2 Canada - Market size and forecast 2024-2029

Chart on Canada - Market size and forecast 2024-2029 ($ million)
Data Table on Canada - Market size and forecast 2024-2029 ($ million)
Chart on Canada - Year-over-year growth 2024-2029 (%)
Data Table on Canada - Year-over-year growth 2024-2029 (%)

11.3.3 Mexico - Market size and forecast 2024-2029

Chart on Mexico - Market size and forecast 2024-2029 ($ million)
Data Table on Mexico - Market size and forecast 2024-2029 ($ million)
Chart on Mexico - Year-over-year growth 2024-2029 (%)
Data Table on Mexico - Year-over-year growth 2024-2029 (%)

11.4 Europe - Market size and forecast 2024-2029

Chart on Europe - Market size and forecast 2024-2029 ($ million)
Data Table on Europe - Market size and forecast 2024-2029 ($ million)
Chart on Europe - Year-over-year growth 2024-2029 (%)
Data Table on Europe - Year-over-year growth 2024-2029 (%)
Chart on Regional Comparison - Europe
Data Table on Regional Comparison - Europe

11.4.1 Germany - Market size and forecast 2024-2029

Chart on Germany - Market size and forecast 2024-2029 ($ million)
Data Table on Germany - Market size and forecast 2024-2029 ($ million)
Chart on Germany - Year-over-year growth 2024-2029 (%)
Data Table on Germany - Year-over-year growth 2024-2029 (%)

11.4.2 UK - Market size and forecast 2024-2029

Chart on UK - Market size and forecast 2024-2029 ($ million)
Data Table on UK - Market size and forecast 2024-2029 ($ million)
Chart on UK - Year-over-year growth 2024-2029 (%)
Data Table on UK - Year-over-year growth 2024-2029 (%)

11.4.3 France - Market size and forecast 2024-2029

Chart on France - Market size and forecast 2024-2029 ($ million)
Data Table on France - Market size and forecast 2024-2029 ($ million)
Chart on France - Year-over-year growth 2024-2029 (%)
Data Table on France - Year-over-year growth 2024-2029 (%)

11.4.4 Italy - Market size and forecast 2024-2029

Chart on Italy - Market size and forecast 2024-2029 ($ million)
Data Table on Italy - Market size and forecast 2024-2029 ($ million)
Chart on Italy - Year-over-year growth 2024-2029 (%)
Data Table on Italy - Year-over-year growth 2024-2029 (%)

11.4.5 The Netherlands - Market size and forecast 2024-2029

Chart on The Netherlands - Market size and forecast 2024-2029 ($ million)
Data Table on The Netherlands - Market size and forecast 2024-2029 ($ million)
Chart on The Netherlands - Year-over-year growth 2024-2029 (%)
Data Table on The Netherlands - Year-over-year growth 2024-2029 (%)

11.4.6 Spain - Market size and forecast 2024-2029

Chart on Spain - Market size and forecast 2024-2029 ($ million)
Data Table on Spain - Market size and forecast 2024-2029 ($ million)
Chart on Spain - Year-over-year growth 2024-2029 (%)
Data Table on Spain - Year-over-year growth 2024-2029 (%)

11.5 APAC - Market size and forecast 2024-2029

Chart on APAC - Market size and forecast 2024-2029 ($ million)
Data Table on APAC - Market size and forecast 2024-2029 ($ million)
Chart on APAC - Year-over-year growth 2024-2029 (%)
Data Table on APAC - Year-over-year growth 2024-2029 (%)
Chart on Regional Comparison - APAC
Data Table on Regional Comparison - APAC

11.5.1 China - Market size and forecast 2024-2029

Chart on China - Market size and forecast 2024-2029 ($ million)
Data Table on China - Market size and forecast 2024-2029 ($ million)
Chart on China - Year-over-year growth 2024-2029 (%)
Data Table on China - Year-over-year growth 2024-2029 (%)

11.5.2 India - Market size and forecast 2024-2029

Chart on India - Market size and forecast 2024-2029 ($ million)
Data Table on India - Market size and forecast 2024-2029 ($ million)
Chart on India - Year-over-year growth 2024-2029 (%)
Data Table on India - Year-over-year growth 2024-2029 (%)

11.5.3 Japan - Market size and forecast 2024-2029

Chart on Japan - Market size and forecast 2024-2029 ($ million)
Data Table on Japan - Market size and forecast 2024-2029 ($ million)
Chart on Japan - Year-over-year growth 2024-2029 (%)
Data Table on Japan - Year-over-year growth 2024-2029 (%)

11.5.4 South Korea - Market size and forecast 2024-2029

Chart on South Korea - Market size and forecast 2024-2029 ($ million)
Data Table on South Korea - Market size and forecast 2024-2029 ($ million)
Chart on South Korea - Year-over-year growth 2024-2029 (%)
Data Table on South Korea - Year-over-year growth 2024-2029 (%)

11.5.5 Australia - Market size and forecast 2024-2029

Chart on Australia - Market size and forecast 2024-2029 ($ million)
Data Table on Australia - Market size and forecast 2024-2029 ($ million)
Chart on Australia - Year-over-year growth 2024-2029 (%)
Data Table on Australia - Year-over-year growth 2024-2029 (%)

11.5.6 Indonesia - Market size and forecast 2024-2029

Chart on Indonesia - Market size and forecast 2024-2029 ($ million)
Data Table on Indonesia - Market size and forecast 2024-2029 ($ million)
Chart on Indonesia - Year-over-year growth 2024-2029 (%)
Data Table on Indonesia - Year-over-year growth 2024-2029 (%)

11.6 Middle East and Africa - Market size and forecast 2024-2029

Chart on Middle East and Africa - Market size and forecast 2024-2029 ($ million)
Data Table on Middle East and Africa - Market size and forecast 2024-2029 ($ million)
Chart on Middle East and Africa - Year-over-year growth 2024-2029 (%)
Data Table on Middle East and Africa - Year-over-year growth 2024-2029 (%)
Chart on Regional Comparison - Middle East and Africa
Data Table on Regional Comparison - Middle East and Africa

11.6.1 Saudi Arabia - Market size and forecast 2024-2029

Chart on Saudi Arabia - Market size and forecast 2024-2029 ($ million)
Data Table on Saudi Arabia - Market size and forecast 2024-2029 ($ million)
Chart on Saudi Arabia - Year-over-year growth 2024-2029 (%)
Data Table on Saudi Arabia - Year-over-year growth 2024-2029 (%)

11.6.2 UAE - Market size and forecast 2024-2029

Chart on UAE - Market size and forecast 2024-2029 ($ million)
Data Table on UAE - Market size and forecast 2024-2029 ($ million)
Chart on UAE - Year-over-year growth 2024-2029 (%)
Data Table on UAE - Year-over-year growth 2024-2029 (%)

11.6.3 South Africa - Market size and forecast 2024-2029

Chart on South Africa - Market size and forecast 2024-2029 ($ million)
Data Table on South Africa - Market size and forecast 2024-2029 ($ million)
Chart on South Africa - Year-over-year growth 2024-2029 (%)
Data Table on South Africa - Year-over-year growth 2024-2029 (%)

11.6.4 Israel - Market size and forecast 2024-2029

Chart on Israel - Market size and forecast 2024-2029 ($ million)
Data Table on Israel - Market size and forecast 2024-2029 ($ million)
Chart on Israel - Year-over-year growth 2024-2029 (%)
Data Table on Israel - Year-over-year growth 2024-2029 (%)

11.6.5 Turkey - Market size and forecast 2024-2029

Chart on Turkey - Market size and forecast 2024-2029 ($ million)
Data Table on Turkey - Market size and forecast 2024-2029 ($ million)
Chart on Turkey - Year-over-year growth 2024-2029 (%)
Data Table on Turkey - Year-over-year growth 2024-2029 (%)

11.7 South America - Market size and forecast 2024-2029

Chart on South America - Market size and forecast 2024-2029 ($ million)
Data Table on South America - Market size and forecast 2024-2029 ($ million)
Chart on South America - Year-over-year growth 2024-2029 (%)
Data Table on South America - Year-over-year growth 2024-2029 (%)
Chart on Regional Comparison - South America
Data Table on Regional Comparison - South America

11.7.1 Brazil - Market size and forecast 2024-2029

Chart on Brazil - Market size and forecast 2024-2029 ($ million)
Data Table on Brazil - Market size and forecast 2024-2029 ($ million)
Chart on Brazil - Year-over-year growth 2024-2029 (%)
Data Table on Brazil - Year-over-year growth 2024-2029 (%)

11.7.2 Argentina - Market size and forecast 2024-2029

Chart on Argentina - Market size and forecast 2024-2029 ($ million)
Data Table on Argentina - Market size and forecast 2024-2029 ($ million)
Chart on Argentina - Year-over-year growth 2024-2029 (%)
Data Table on Argentina - Year-over-year growth 2024-2029 (%)

11.7.3 Colombia - Market size and forecast 2024-2029

Chart on Colombia - Market size and forecast 2024-2029 ($ million)
Data Table on Colombia - Market size and forecast 2024-2029 ($ million)
Chart on Colombia - Year-over-year growth 2024-2029 (%)
Data Table on Colombia - Year-over-year growth 2024-2029 (%)

11.8 Market opportunity by geography

Market opportunity by geography ($ million)
Data Tables on Market opportunity by geography ($ million)

12. Drivers, Challenges, and Opportunity

12.1 Market drivers

Proliferation of social media and rise of visually curated celebrations
Post-pandemic rebound in social gatherings and ascendancy of experience economy
Strategic product innovation emphasizing sustainability and customization

12.2 Market challenges

Intense price competition and margin erosion from mass merchandisers and e-commerce platforms
Persistent supply chain volatility and inflationary pressure on input costs
Mounting regulatory pressures and evolving consumer sentiment regarding sustainability

12.3 Impact of drivers and challenges

Impact of drivers and challenges in 2024 and 2029

12.4 Market opportunities

Ascendancy of sustainable and eco-conscious celebrations
Hyper-personalization and themed experience economy
Digital integration and e-commerce channel dominance

13. Competitive Landscape

13.1 Overview

13.2

Overview on criticality of inputs and factors of differentiation

13.3 Landscape disruption

Overview on factors of disruption

13.4 Industry risks

Impact of key risks on business

14. Competitive Analysis

14.1 Companies profiled

Companies covered

14.2 Company ranking index

14.3 Market positioning of companies

Matrix on companies position and classification

14.4 Amazon.com Inc.

Amazon.com Inc. - Overview
Amazon.com Inc. - Business segments
Amazon.com Inc. - Key news
Amazon.com Inc. - Key offerings
Amazon.com Inc. - Segment focus
SWOT

14.5 Anagram International, Inc.

Anagram International, Inc. - Overview
Anagram International, Inc. - Product / Service
Anagram International, Inc. - Key offerings
SWOT

14.6 Creative Converting

Creative Converting - Overview
Creative Converting - Product / Service
Creative Converting - Key offerings
SWOT

14.7 Dollar Tree Inc.

Dollar Tree Inc. - Overview
Dollar Tree Inc. - Product / Service
Dollar Tree Inc. - Key offerings
SWOT

14.8 Etsy Inc.

Etsy Inc. - Overview
Etsy Inc. - Product / Service
Etsy Inc. - Key news
Etsy Inc. - Key offerings
SWOT

14.9 Hallmark Card Inc.

Hallmark Card Inc. - Overview
Hallmark Card Inc. - Product / Service
Hallmark Card Inc. - Key offerings
SWOT

14.10 Oriental Trading Co.

Oriental Trading Co. - Overview
Oriental Trading Co. - Product / Service
Oriental Trading Co. - Key offerings
SWOT

14.11 Party City Holdco Inc.

Party City Holdco Inc. - Overview
Party City Holdco Inc. - Product / Service
Party City Holdco Inc. - Key offerings
SWOT

14.12 Pioneer Balloon Company

Pioneer Balloon Company - Overview
Pioneer Balloon Company - Product / Service
Pioneer Balloon Company - Key offerings
SWOT

14.13 Rubies II LLC.

Rubies II LLC. - Overview
Rubies II LLC. - Product / Service
Rubies II LLC. - Key offerings
SWOT

14.14 Smiffys

Smiffys - Overview
Smiffys - Product / Service
Smiffys - Key offerings
SWOT

14.15 Target Corp.

Target Corp. - Overview
Target Corp. - Product / Service
Target Corp. - Key news
Target Corp. - Key offerings
SWOT

14.16 Unique Industries, Inc.

Unique Industries, Inc. - Overview
Unique Industries, Inc. - Product / Service
Unique Industries, Inc. - Key offerings
SWOT

14.17 Walmart Inc.

Walmart Inc. - Overview
Walmart Inc. - Business segments
Walmart Inc. - Key news
Walmart Inc. - Key offerings
Walmart Inc. - Segment focus
SWOT

14.18 Zazzle Inc.

Zazzle Inc. - Overview
Zazzle Inc. - Product / Service
Zazzle Inc. - Key offerings
SWOT

15. Appendix

15.1 Scope of the report

Market definition
Objectives
Notes and caveats

15.2 Inclusions and exclusions checklist

Inclusions checklist
Exclusions checklist

15.3 Currency conversion rates for US$

15.4 Research methodology

15.5 Data procurement

Information sources

15.6 Data validation

15.7 Validation techniques employed for market sizing

15.8 Data synthesis

15.9 360 degree market analysis

15.10 List of abbreviations

Research Methodology

Technavio presents a detailed picture of the market by way of study, synthesis, and summation of data from multiple sources. The analysts have presented the various facets of the market with a particular focus on identifying the key industry influencers. The data thus presented is comprehensive, reliable, and the result of extensive research, both primary and secondary.

INFORMATION SOURCES

Primary sources

  • Manufacturers and suppliers
  • Channel partners
  • Industry experts
  • Strategic decision makers

Secondary sources

  • Industry journals and periodicals
  • Government data
  • Financial reports of key industry players
  • Historical data
  • Press releases

DATA ANALYSIS

Data Synthesis

  • Collation of data
  • Estimation of key figures
  • Analysis of derived insights

Data Validation

  • Triangulation with data models
  • Reference against proprietary databases
  • Corroboration with industry experts

REPORT WRITING

Qualitative

  • Market drivers
  • Market challenges
  • Market trends
  • Five forces analysis

Quantitative

  • Market size and forecast
  • Market segmentation
  • Geographical insights
  • Competitive landscape

Interested in this report?

Get your sample now to see our research methodology and insights!

Download Now

Frequently Asked Questions

Party Supplies market growth will increase by USD 8719.1 million during 2025-2029 .

The Party Supplies market is expected to grow at a CAGR of 9.1% during 2025-2029 .

Party Supplies market is segmented by Application (Residential use, Commercial use) Type (Tableware and disposables, Balloons, Banners and home decor, Games and piatas, Others) Distribution channel (Offline, Online)

Amazon.com Inc., Anagram International, Inc., Creative Converting, Dart Container Corp., Dollar Tree Inc., Etsy Inc., Fun Express LLC, Hallmark Card Inc., Oriental Trading Co., Party City Holdco Inc., PD-Party, Pioneer Balloon Company, Rubies II LLC., Shutterfly Inc., Smiffys, Target Corp., The Beistle Company, Unique Industries, Inc., Walmart Inc., Zazzle Inc. are a few of the key vendors in the Party Supplies market.

North America will register the highest growth rate of 39.8% among the other regions. Therefore, the Party Supplies market in North America is expected to garner significant business opportunities for the vendors during the forecast period.

US, Canada, Mexico, Germany, UK, France, Italy, The Netherlands, Spain, China, India, Japan, South Korea, Australia, Indonesia, Saudi Arabia, UAE, South Africa, Israel, Turkey, Brazil, Argentina, Colombia

  • Proliferation of social media and rise of visually curated celebrations is the driving factor this market.

The Party Supplies market vendors should focus on grabbing business opportunities from the Application segment as it accounted for the largest market share in the base year.