Diesel Engines For Non-Automotive Applications Market Size 2025-2029
The diesel engines for non-automotive applications market size is forecast to increase by USD 14.7 billion, at a CAGR of 3.5% between 2024 and 2029.
- The market is experiencing significant growth driven by technological advances in diesel engine technology. These innovations are leading to increased efficiency, power density, and fuel flexibility, making diesel engines an attractive option for various industries beyond automotive applications. Another key trend is the gradual conversion of conventional engines to dual fuel systems, which allows the use of multiple fuel types and enhances energy security. However, this market faces challenges as well. Strict emission regulations are becoming increasingly stringent, requiring engine manufacturers to invest heavily in research and development to meet these standards. Additionally, the growing popularity of alternative energy sources, such as electricity and hydrogen, poses a threat to the market's growth.
- Companies seeking to capitalize on market opportunities must stay abreast of the latest technological developments and regulatory requirements, while also addressing the challenges posed by competition from alternative energy sources. Effective strategic planning and operational agility will be essential for success in this dynamic market.
What will be the Size of the Diesel Engines For Non-Automotive Applications Market during the forecast period?

Explore in-depth regional segment analysis with market size data - historical 2019-2023 and forecasts 2025-2029 - in the full report.
Request Free Sample
The market continues to evolve, driven by the ongoing quest for improved fuel efficiency, engine durability, and reduced emissions. In various sectors, including mining equipment, backup power, rail transportation, agriculture, construction, and industrial applications, diesel engines remain a preferred choice due to their power output and reliability. Fuel efficiency is a significant factor in the market dynamics, with engine design and performance playing crucial roles. Manufacturers are continually innovating to optimize engine design, leading to advancements in fuel injection systems, cooling systems, and lubrication systems. These improvements contribute to reduced fuel consumption and extended engine life cycle.
Emission control technologies, such as diesel particulate filters (DPFs) and selective catalytic reduction (SCR) systems, are increasingly being adopted to meet evolving emissions standards. Tier 3 and Tier 4 regulations have set stringent limits on emissions, pushing engine manufacturers to develop more advanced emission control systems. The market is also witnessing the integration of alternative fuels, such as renewable fuels, into diesel engines. Hydrogen fuel cells are gaining traction as a potential alternative fuel source, offering the potential for zero-emission power generation. Maintenance intervals are another area of focus, with remote diagnostics and engine monitoring systems enabling predictive maintenance and reducing downtime.
Service contracts are becoming increasingly popular, providing customers with peace of mind and cost savings over the engine's lifecycle. The supply chain is a critical component of the market, with distribution networks ensuring the timely delivery of engine components and spare parts. The market's continuous evolution is reflected in the ongoing unfolding of market activities and evolving patterns across various sectors.
How is this Diesel Engines For Non-Automotive Applications Industry segmented?
The diesel engines for non-automotive applications industry research report provides comprehensive data (region-wise segment analysis), with forecasts and estimates in "USD million" for the period 2025-2029, as well as historical data from 2019-2023 for the following segments.
- Type
- Multi cylinder
- Single cylinder
- End-user
- Marine
- Construction
- Agriculture
- Generators
- Power Rating
- 0.5-1 MW
- 2.1-5.0 MW
- 1.1-2 MW
- Below 0.5 MW
- Above 5.0 MW
- Speed
- Medium-speed
- High-speed
- Low-speed
- Geography
- North America
- US
- Canada
- Europe
- France
- Germany
- Italy
- UK
- APAC
- China
- India
- Japan
- South Korea
- Rest of World (ROW)
- North America
By Type Insights
The multi cylinder segment is estimated to witness significant growth during the forecast period.
Multi-cylinder diesel engines, characterized by their ability to complete four cycles for each cylinder - intake, compression, work, and exhaust - are a preferred choice in various non-automotive applications. These engines, which have more than one cylinder, offer durability, fuel efficiency, and optimal torque output. In industrial applications, such as power generation, compression, and pumping systems, multi-cylinder diesel engines provide reliable performance. Engine components, including engine parts, fuel systems, cooling systems, lubrication systems, and exhaust systems, are essential for the optimal functioning of these engines. Engine durability is a critical factor, with engine overhaul and maintenance intervals playing significant roles in ensuring long engine life cycle.
Diesel particulate filters (DPFs) and selective catalytic reduction (SCR) systems are essential emission control technologies that help meet stringent emissions standards, such as Tier 3 and Tier 4, in industries like rail transportation, construction equipment, and marine propulsion. Fuel efficiency is a significant concern in various applications, including backup power, emergency power, and off-grid power. Diesel generators and industrial diesel engines are popular choices due to their high power output and low operating costs. Engine monitoring, remote power, and engine design are crucial aspects of engine performance. Remote diagnostics and engine maintenance enable predictive maintenance and minimize downtime.
Renewable fuels and alternative fuels are gaining popularity in the market due to their environmental benefits and lifecycle cost analysis. The supply chain, including engine manufacturing, distribution networks, and service contracts, plays a vital role in ensuring the smooth functioning of diesel engines in various applications. Fuel consumption and power generation are essential considerations in the selection and operation of diesel engines.
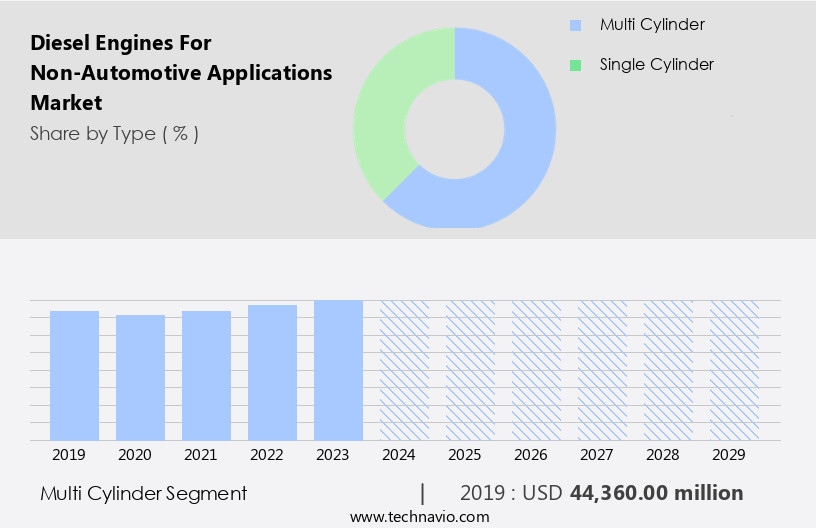
The Multi cylinder segment was valued at USD 44.36 billion in 2019 and showed a gradual increase during the forecast period.
Regional Analysis
APAC is estimated to contribute 57% to the growth of the global market during the forecast period.Technavio’s analysts have elaborately explained the regional trends and drivers that shape the market during the forecast period.

The non-automotive diesel engines market is witnessing significant growth due to the increasing demand for diesel engines in various sectors. In the construction industry, diesel engines are extensively used in equipment such as excavators, cranes, and wheel loaders, driving market expansion. China, a major player in the APAC construction sector, holds a substantial market share. The Chinese government's efforts to boost the economy through urbanization and infrastructure development initiatives are expected to maintain the market's attractiveness. Japan, another significant contributor, is undergoing infrastructure renovation and development, further fueling market growth. Fuel efficiency is a critical factor influencing the market, with engine manufacturers continually focusing on improving engine designs and performance to reduce fuel consumption.
Engine durability and reliability are essential considerations for industries such as mining, rail transportation, and emergency power, where equipment downtime can lead to significant losses. Emissions standards, such as Tier 3 and Tier 4, are increasingly stringent, necessitating the adoption of advanced emission control technologies like selective catalytic reduction, diesel particulate filters, and exhaust gas recirculation systems. Engine overhaul and maintenance intervals are crucial aspects of engine life cycle management, ensuring optimal engine performance and longevity. The market for diesel generators and off-grid power solutions is growing as industries seek reliable power sources for remote locations. Renewable fuels and alternative fuel systems, such as hydrogen fuel cells, are gaining traction as sustainable energy sources.
Engine manufacturing companies invest in research and development to improve engine components, fuel injection systems, and cooling and lubrication systems, ensuring engine efficiency and durability. The supply chain is a critical factor in market dynamics, with distribution networks and service contracts playing essential roles in ensuring timely delivery and maintenance of engines. Power generation, industrial diesel engines, agricultural machinery, material handling equipment, and marine diesel engines are among the key applications driving market growth. The market's future looks promising, with ongoing advancements in engine technology and the increasing demand for reliable, efficient, and sustainable power solutions.
Market Dynamics
Our researchers analyzed the data with 2024 as the base year, along with the key drivers, trends, and challenges. A holistic analysis of drivers will help companies refine their marketing strategies to gain a competitive advantage.
In the thriving diesel engines market, the non-automotive sector holds a significant share. This segment caters to various industries, including power generation, construction, agriculture, and marine. Diesel engines for non-automotive applications offer superior efficiency, reliability, and fuel economy. Key players in this market prioritize advanced technologies, such as common rail systems, exhaust gas recirculation, and selective catalytic reduction. These innovations contribute to reduced emissions and enhanced performance. Additionally, the market benefits from factors like growing energy demand, infrastructure development, and increasing focus on renewable energy integration. Furthermore, the trend toward electrification in the automotive sector is driving demand for diesel engines in non-automotive applications. Overall, the market is poised for growth, fueled by technological advancements, environmental regulations, and diverse industry applications.
What are the key market drivers leading to the rise in the adoption of Diesel Engines For Non-Automotive Applications Industry?
- The advancements in diesel engine technology, which are mandatorily driving the market, are gaining significant momentum due to innovative technological developments.
- Diesel engines continue to play a crucial role in non-automotive applications, particularly in industries prioritizing fuel efficiency for off-grid power and remote power solutions. Fuel economy is a key consideration for industrial users, making diesel engines an attractive choice for power backup equipment. Advancements in diesel engine technology have significantly improved fuel efficiency. These enhancements primarily focus on optimizing the combustion process within the engine, achieved through the combination of oxygen and fuel. Notable modifications include engine monitoring systems that ensure optimal performance and engine reliability. Additionally, selective catalytic reduction (SCR) technology has been implemented to reduce emissions, making diesel engines more environmentally friendly.
- Diesel engines power various non-automotive applications, such as marine propulsion, material handling equipment, and renewable fuel systems. Lubrication and cooling systems have also been upgraded to ensure engine longevity and power output. Lifecycle cost analysis is essential for businesses considering the adoption of diesel engines. Engine reliability and long life cycle are significant factors in justifying the higher upfront cost of diesel engines compared to their gasoline counterparts. In conclusion, diesel engines continue to be a preferred choice for non-automotive applications due to their fuel efficiency, reliability, and long engine life cycle. Ongoing advancements in diesel engine technology further enhance their performance and environmental friendliness.
What are the market trends shaping the Diesel Engines For Non-Automotive Applications Industry?
- The transition from conventional single-fuel engines to dual-fuel systems is an emerging market trend. This shift towards more sustainable and versatile energy solutions is mandatory for many industries to remain competitive and compliant with evolving regulations.
- Diesel engines have gained significant traction in non-automotive applications due to their efficiency and reliability. However, the market is witnessing a shift towards alternative fuels and advanced emission control technologies. Dual-fuel engines, which can operate on both diesel and natural gas, are becoming increasingly popular due to their cost-effectiveness and environmental benefits. These engines can be easily converted from conventional diesel engines with minimal complications. However, there are challenges associated with dual-fuel systems. Spark-ignited engines, which are commonly used in these systems, offer lower power density compared to diesel engines. To achieve equal power, a larger engine is required, leading to higher costs.
- Additionally, the different cam timing in spark-ignited engines results in higher exhaust gas temperatures and increased valve seat wear rates when using dry gas fuel. Fuel injection systems and selective catalytic reduction (SCR) systems are essential components of diesel engines for non-automotive applications. These systems help in reducing emissions, making them compliant with Tier 3 and Tier 4 regulations. Hydrogen fuel cells are also gaining popularity as an alternative fuel source for diesel engines, offering zero-emission power generation. Maintenance intervals for diesel engines in non-automotive applications can vary depending on the application and operating conditions. Service contracts are essential to ensure timely maintenance and minimize downtime.
- The supply chain for diesel engines for non-automotive applications involves various stakeholders, including engine manufacturers, fuel suppliers, and maintenance providers. Fuel consumption is a critical factor in the total cost of ownership for these engines, making fuel efficiency a key consideration.
What challenges does the Diesel Engines For Non-Automotive Applications Industry face during its growth?
- The stringent emission regulations imposed on diesel engines pose a significant challenge to the industry's growth. These regulations, which aim to reduce air pollution, require engine manufacturers and operators to invest heavily in research and development of cleaner technologies or face penalties and potential market exclusion. Consequently, the industry must adapt to these regulations to remain competitive and sustainable.
- Diesel engines play a significant role in various non-automotive applications, including mining equipment, backup power, rail transportation, and emergency power. However, the environmental impact of diesel emissions, particularly nitrogen oxides (NOx), has become a major concern. NOx emissions contribute to the production of smog and acid rain, and are linked to respiratory problems and cancer-related illnesses. According to the Environmental Protection Agency (EPA), reducing NOx emissions could lead to a decrease in premature deaths by 12,000 and hospitalizations by 8,900 by 2030. To address this issue, there has been a focus on implementing stricter emission regulations. Engine parts, such as engine components and DPF systems, are essential for maintaining engine durability and fuel efficiency.
- Regular engine maintenance and engine overhaul are crucial for ensuring optimal engine performance and minimizing emissions. The use of advanced technologies, such as selective catalytic reduction (SCR) and exhaust gas recirculation (EGR), can help reduce NOx emissions while maintaining engine power and efficiency. The diesel engine market for non-automotive applications is expected to grow due to the increasing demand for fuel efficiency, reliability, and cost-effectiveness. Distribution networks and prime power applications are also driving the growth of this market. It is essential to stay updated with the latest engine technologies and regulations to ensure compliance and maximize operational efficiency.
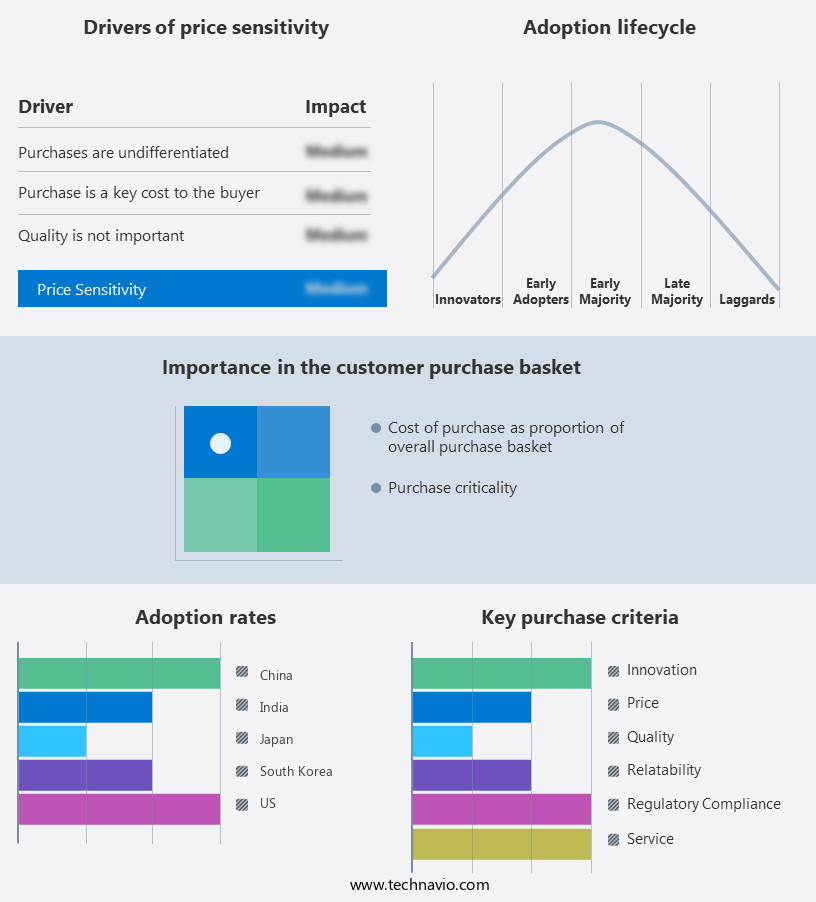
Exclusive Customer Landscape
The diesel engines for non-automotive applications market forecasting report includes the adoption lifecycle of the market, covering from the innovator’s stage to the laggard’s stage. It focuses on adoption rates in different regions based on penetration. Furthermore, the diesel engines for non-automotive applications market report also includes key purchase criteria and drivers of price sensitivity to help companies evaluate and develop their market growth analysis strategies.
Customer Landscape
Key Companies & Market Insights
Companies are implementing various strategies, such as strategic alliances, diesel engines for non-automotive applications market forecast, partnerships, mergers and acquisitions, geographical expansion, and product/service launches, to enhance their presence in the industry.
AB Volvo - The company specializes in providing diesel engines for non-automotive applications, including the 3400 Series, 3406, 3408, and 3500 Series models. These engines deliver superior performance and efficiency for various industries. With a focus on innovation and quality, the company's offerings elevate operational capabilities and reduce environmental impact. Engineered to meet diverse industry requirements, these diesel engines are a reliable solution for businesses seeking power and productivity.
The industry research and growth report includes detailed analyses of the competitive landscape of the market and information about key companies, including:
- AB Volvo
- Caterpillar Inc.
- CNPC Jichai Power Co. Ltd.
- Cummins Inc.
- Deere and Co.
- DEUTZ AG
- Discovery Energy LLC
- Doosan Corp.
- IHI Corp.
- Isuzu Motors Ltd.
- Iveco SpA
- J C Bamford Excavators Ltd.
- Kubota Corp.
- Liebherr International AG
- MAN Energy Solutions SE
- Mitsubishi Heavy Industries Ltd.
- Scania AB
- Wartsila Corp.
- WeiChai Holding Group Co. Ltd.
- Yanmar Holdings Co. Ltd.
Qualitative and quantitative analysis of companies has been conducted to help clients understand the wider business environment as well as the strengths and weaknesses of key industry players. Data is qualitatively analyzed to categorize companies as pure play, category-focused, industry-focused, and diversified; it is quantitatively analyzed to categorize companies as dominant, leading, strong, tentative, and weak.
Recent Development and News in Diesel Engines For Non-Automotive Applications Market
- In January 2024, Caterpillar Inc., a leading manufacturer of industrial power systems, announced the launch of its new 3516E diesel engine series for non-automotive applications. This engine range offers improved fuel efficiency and lower emissions, making it an attractive option for industries such as power generation and construction (Caterpillar Press Release, 2024).
- In March 2024, Volvo Penta, a subsidiary of Volvo Group, entered into a strategic partnership with Ballard Power Systems to develop and produce hydrogen-electric hybrid marine engines. This collaboration aims to reduce greenhouse gas emissions in the maritime sector by integrating diesel engines with hydrogen fuel cells (Volvo Penta Press Release, 2024).
- In April 2025, Wärtsilä Corporation, a Finnish technology group, acquired Transformatorhuis, a Dutch company specializing in the design, manufacturing, and installation of transformers and switchgear. This acquisition strengthened Wärtsilä's position in the power generation market by expanding its product portfolio and enhancing its engineering capabilities (Wärtsilä Corporation Press Release, 2025).
- In May 2025, the European Union (EU) approved new regulations on emissions from non-road mobile machinery, including diesel engines used in construction, agriculture, and power generation. The new rules set stricter emission limits, which will encourage the adoption of cleaner technologies and more efficient engines (EU Press Release, 2025).
Research Analyst Overview
- In the non-automotive applications market for diesel engines, engine control software plays a crucial role in optimizing power management systems and ensuring regulatory compliance. Installation services are in high demand to integrate hybrid power systems, predictive modeling, and machine learning technologies. Spare parts management is essential for maintaining operational efficiency, while noise reduction and vibration dampening are key considerations for applications in sensitive environments. Remote diagnostics software and engine testing enable early detection of potential issues, reducing downtime and maintenance costs. Engine certification is a critical factor in gaining market access and ensuring safety standards are met.
- Fuel optimization and energy efficiency improvements are driving demand for advanced engine technologies, including renewable energy integration and smart grids. Power management systems, data analytics, and maintenance optimization are essential for fleet management, enabling real-time monitoring and data-driven maintenance strategies. Safety standards, technical support, and energy storage are also critical components of the diesel engine market for non-automotive applications. Remote monitoring systems and artificial intelligence (AI) are transforming the industry, enabling predictive maintenance and optimizing operational efficiency. Engine certification, power management systems, and hybrid power systems are key trends in the market, driven by regulatory requirements and the need for sustainable energy solutions.
Dive into Technavio’s robust research methodology, blending expert interviews, extensive data synthesis, and validated models for unparalleled Diesel Engines For Non-Automotive Applications Market insights. See full methodology.
|
Market Scope |
|
|
Report Coverage |
Details |
|
Page number |
244 |
|
Base year |
2024 |
|
Historic period |
2019-2023 |
|
Forecast period |
2025-2029 |
|
Growth momentum & CAGR |
Accelerate at a CAGR of 3.5% |
|
Market growth 2025-2029 |
USD 14698.3 million |
|
Market structure |
Fragmented |
|
YoY growth 2024-2025(%) |
3.4 |
|
Key countries |
China, US, Japan, India, South Korea, UK, Germany, Canada, France, and Italy |
|
Competitive landscape |
Leading Companies, Market Positioning of Companies, Competitive Strategies, and Industry Risks |
What are the Key Data Covered in this Diesel Engines For Non-Automotive Applications Market Research and Growth Report?
- CAGR of the Diesel Engines For Non-Automotive Applications industry during the forecast period
- Detailed information on factors that will drive the growth and forecasting between 2025 and 2029
- Precise estimation of the size of the market and its contribution of the industry in focus to the parent market
- Accurate predictions about upcoming growth and trends and changes in consumer behaviour
- Growth of the market across APAC, North America, Europe, Middle East and Africa, and South America
- Thorough analysis of the market’s competitive landscape and detailed information about companies
- Comprehensive analysis of factors that will challenge the diesel engines for non-automotive applications market growth of industry companies
We can help! Our analysts can customize this diesel engines for non-automotive applications market research report to meet your requirements.
 RIA -
RIA - 
