Passenger Information System Market Analysis, Size, and Forecast 2026-2030: North America (US, Canada, and Mexico), Europe (Germany, UK, and France), APAC (China, India, and Japan), South America (Brazil, Argentina, and Colombia), Middle East and Africa (Saudi Arabia, UAE, and South Africa), and Rest of World (ROW)

Passenger Information System Market Analysis, Size, and Forecast 2026-2030:
North America (US, Canada, and Mexico), Europe (Germany, UK, and France), APAC (China, India, and Japan), South America (Brazil, Argentina, and Colombia), Middle East and Africa (Saudi Arabia, UAE, and South Africa), and Rest of World (ROW)

Published: Mar 2026 294 Pages SKU: IRTNTR71784

Market Overview at a Glance

$34.02 B
Market Opportunity
14.3%
CAGR 2025 - 2030
30.2%
North America Growth
$22.44 B
Solution segment 2024

Passenger Information System Market Size 2026-2030

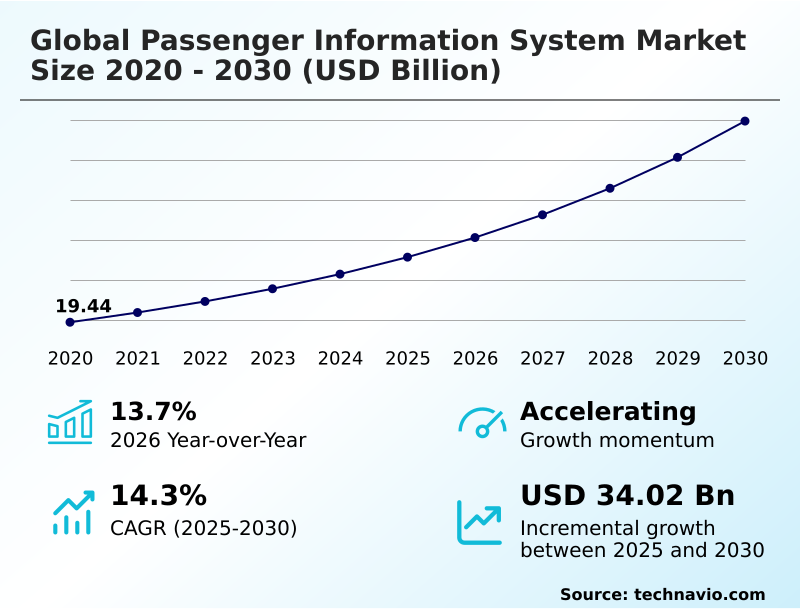
The passenger information system market size is valued to increase by USD 34.02 billion, at a CAGR of 14.3% from 2025 to 2030. Expansion of urban infrastructure and smart city initiatives will drive the passenger information system market.

Major Market Trends & Insights

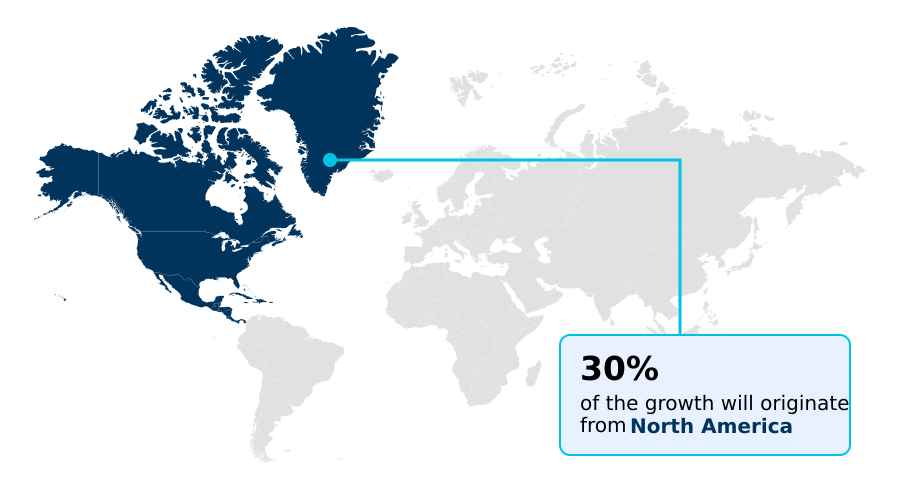
  • North America dominated the market and accounted for a 30.2% growth during the forecast period.
  • By Component - Solution segment was valued at USD 22.44 billion in 2024
  • By Mode of Transportation - Railways segment accounted for the largest market revenue share in 2024

Market Size & Forecast

  • Market Opportunities: USD 50.29 billion
  • Market Future Opportunities: USD 34.02 billion
  • CAGR from 2025 to 2030 : 14.3%

Market Summary

  • The passenger information system market is undergoing a significant transformation, driven by the convergence of digitalization and urbanization. Modern systems are much more than simple digital signage solutions; they are complex ecosystems incorporating real-time passenger information (RTPI), automatic vehicle location (AVL), and passenger flow analytics to enhance urban mobility platforms.
  • The strategic imperative for transit agencies is to provide a seamless, predictable journey, which necessitates the adoption of technologies like predictive arrival algorithms and cloud-based PIS platforms. For instance, a metropolitan transit authority can leverage integrated data from passenger counting systems and GNSS-based tracking to dynamically adjust service frequency, reducing platform overcrowding by up to 20% during peak hours.
  • This shift from static schedules to dynamic, responsive operations is a cornerstone of smart city transit projects, improving passenger experience enhancement while optimizing resource allocation and supporting sustainable transit technologies. The integration with fleet management software and journey planning applications further solidifies the role of PIS in modern public transport.

What will be the Size of the Passenger Information System Market during the forecast period?

Get Key Insights on Market Forecast (PDF) Request Free Sample

How is the Passenger Information System Market Segmented?

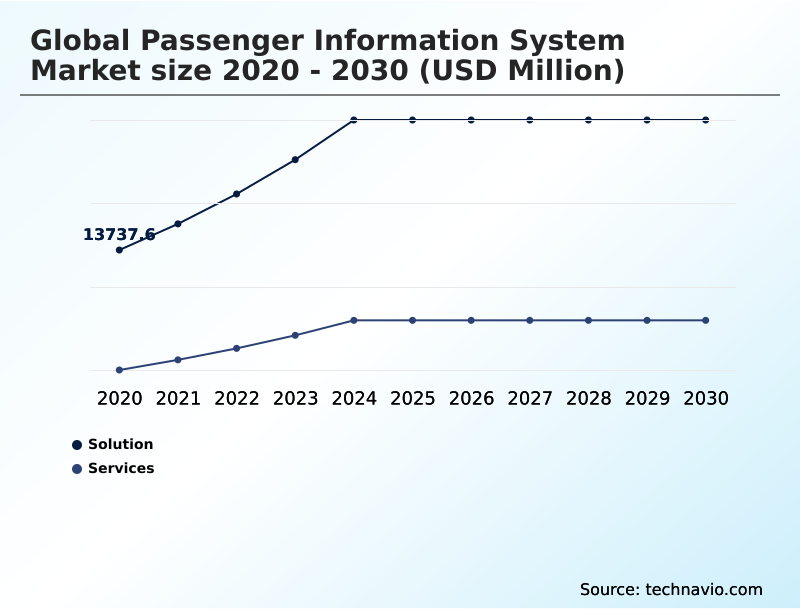
The passenger information system industry research report provides comprehensive data (region-wise segment analysis), with forecasts and estimates in "USD million" for the period 2026-2030, as well as historical data from 2020-2024 for the following segments.

  • Component
    • Solution
    • Services
  • Mode of transportation
    • Railways
    • Roadways
    • Air and waterways
  • Location
    • On-board
    • In-station
  • Geography
    • North America
      • US
      • Canada
      • Mexico
    • Europe
      • Germany
      • UK
      • France
    • APAC
      • China
      • India
      • Japan
    • South America
      • Brazil
      • Argentina
      • Colombia
    • Middle East and Africa
      • Saudi Arabia
      • UAE
      • South Africa
    • Rest of World (ROW)

By Component Insights

The solution segment is estimated to witness significant growth during the forecast period.

The solution segment is defined by a technological framework focused on passenger experience enhancement. Core offerings include onboard passenger information systems equipped with passenger-facing displays that provide dynamic, real-time data through advanced visual communication solutions.

These systems often feature next stop announcement systems and integrated passenger counting systems to inform commuters and optimize vehicle capacity.

Through headway management systems and AI in public transport, operators achieve significant operational efficiency improvements, with some reporting a 15% reduction in schedule deviations.

The emphasis is on passenger journey optimization and a passenger-centric design, utilizing ruggedized display hardware for reliability and delivering personalized travel information to create a seamless transit experience for all users.

Request Free Sample

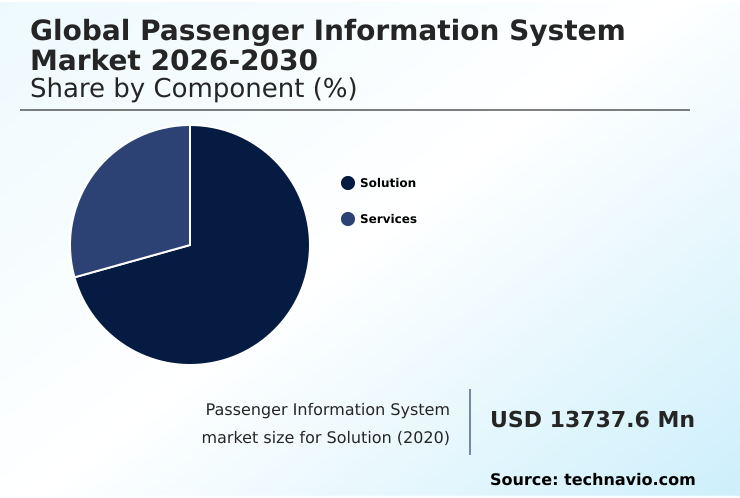
The Solution segment was valued at USD 22.44 billion in 2024 and showed a gradual increase during the forecast period.

Request Free Sample

Regional Analysis

North America is estimated to contribute 30.2% to the growth of the global market during the forecast period.Technavio’s analysts have elaborately explained the regional trends and drivers that shape the market during the forecast period.

See How Passenger Information System Market Demand is Rising in North America Request Free Sample

The market's geographic landscape is led by North America, which accounts for over 30% of the incremental growth, driven by extensive modernization projects.

Europe follows closely, contributing approximately 28%, with a strong focus on interoperable intelligent transportation systems (ITS) and open data transit policies.

In these mature regions, deployments often include advanced onboard passenger information systems with voice announcement systems and haptic feedback interfaces to enhance accessibility. The APAC region is the fastest-growing, fueled by new infrastructure in China and India.

Across all regions, the integration of real-time fleet monitoring and dynamic route mapping into the operational control center (OCC) is standard.

This focus on passenger journey optimization, automated passenger assistance, and contactless payment integration underscores a global push toward more efficient and user-centric transit networks.

Market Dynamics

Our researchers analyzed the data with 2025 as the base year, along with the key drivers, trends, and challenges. A holistic analysis of drivers will help companies refine their marketing strategies to gain a competitive advantage.

  • Strategic deployment across the global passenger information system market 2026-2030 is increasingly specialized, focusing on use-case-specific solutions. For instance, the adoption of a cloud-based PIS for bus rapid transit offers scalability and centralized control, which is a stark contrast to the localized hardware of the past.
  • Similarly, AI-powered passenger flow analysis software is becoming crucial for optimizing schedules in high-traffic zones. In rail, the integration of PIS and CCTV for rail networks enhances both security and operational awareness. A key trend in sustainability is the deployment of solar-powered e-paper displays for bus stops, reducing the grid dependency of wayside infrastructure.
  • For long-haul travel, real-time infotainment systems for long-distance trains are now a competitive differentiator. The market is also seeing a push towards MaaS platform integration with existing PIS, creating a unified passenger experience. In metro systems, installing EN 50155 certified onboard displays for metros is a non-negotiable requirement for safety and reliability.
  • The use of next-generation passenger counting sensors provides data accuracy that is over 15% higher than legacy infrared systems, directly impacting load management strategies. Implementing robust cybersecurity solutions for public transport networks has become a top priority for transit authorities.
  • The focus is on creating seamless journeys through real-time PIS for multimodal transit hubs and employing predictive analytics for bus arrival times. Many agencies are now upgrading legacy PIS with IoT capabilities to unlock new data streams. Specific solutions are also emerging for new vehicle types, such as passenger information systems for electric buses that display battery and range data.
  • Ensuring compliance and accessibility is driving the adoption of ADA compliant audio-visual announcement systems. Finally, centralized content management for PIS networks allows for efficient updates and consistent messaging across all fleet and station assets, highlighting the benefits of 5G in passenger information systems.
  • Mobile PIS applications with real-time tracking, often linked with fleet management software with PIS integration, empower passengers directly, while specialized wayside PIS for high-speed rail platforms address unique operational needs. This focus on custom solutions is key to reducing operational costs with cloud PIS.

What are the key market drivers leading to the rise in the adoption of Passenger Information System Industry?

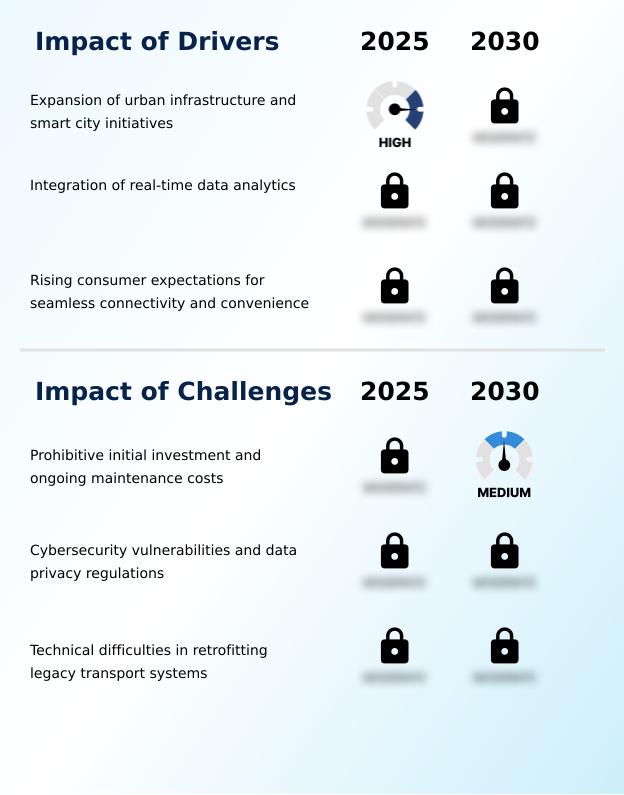
  • The ongoing expansion of urban infrastructure and the proliferation of smart city initiatives are primary drivers for the passenger information system market growth.

  • The rapid expansion of urban infrastructure and smart city transit projects is a primary driver, fueling the demand for advanced systems that support public transport digitalization.
  • Governments are prioritizing urban mobility platforms that offer intermodal transport solutions, requiring seamless multimodal transit integration. Systems leveraging automatic vehicle location (AVL) and real-time data feeds improve operational efficiency improvements by an average of 18%.
  • The increasing expectation for convenience fuels demand for sophisticated journey planning applications and accessible transit data APIs.
  • Moreover, a focus on safety and reliability drives the adoption of compliant systems, including public address (PA) systems for clear communication and automated service disruption alerts, with adherence to standards like EN 50155 compliance being critical.
  • The need to manage passenger data privacy remains a key consideration in these deployments.

What are the market trends shaping the Passenger Information System Industry?

  • The increasing adoption of artificial intelligence and predictive analytics in passenger data management is a transformative trend shaping the market. This shift enables dynamic, data-driven systems for enhanced operational efficiency.

  • The market is witnessing a strategic shift towards dynamic, data-driven solutions powered by AI and machine learning. The integration of IoT sensors in transit allows for real-time passenger information (RTPI) and predictive maintenance for PIS, with some operators reporting a 25% decrease in hardware downtime.
  • This trend facilitates real-time data synchronization across all touchpoints, from LED and LCD displays in stations to onboard infotainment systems. The adoption of cloud-based PIS platforms is central to this evolution, enabling the use of predictive arrival algorithms and supporting the framework for mobility as a service (MaaS).
  • Leveraging 5G connectivity for transit and IP-based communication networks has improved data transmission speeds by over 40%, enabling seamless GNSS-based tracking and the delivery of personalized travel information, thus transforming the passenger journey.

What challenges does the Passenger Information System Industry face during its growth?

  • The prohibitive initial investment required for system deployment and the high ongoing maintenance costs present a significant challenge to market growth.

  • Significant challenges persist, primarily the high costs and technical complexities of legacy system modernization. Integrating new digital signage solutions and wayside passenger information systems with older infrastructure can increase project costs by up to 35%. Cybersecurity for transit networks is another major concern, as interconnected systems, including fleet management software and computer-aided dispatch (CAD), are vulnerable to breaches.
  • Implementing robust emergency communication protocols and secure mobile ticketing integration adds further complexity and expense. Furthermore, developing sustainable transit technologies and comprehensive transit accessibility solutions requires substantial upfront investment. The difficulty in implementing effective remote system management and crowd density monitoring without a complete overhaul presents a considerable barrier for many transit agencies.

Exclusive Technavio Analysis on Customer Landscape

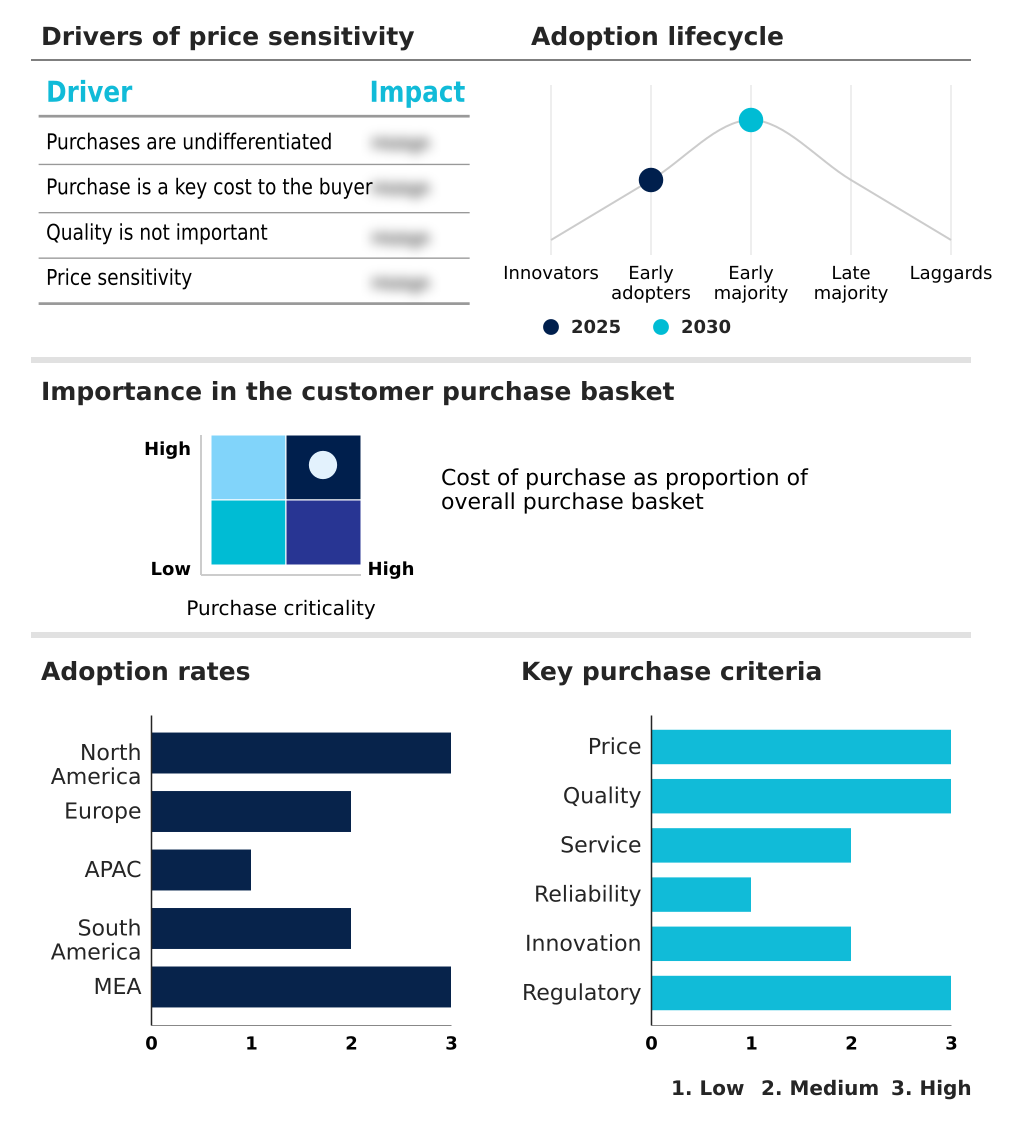
The passenger information system market forecasting report includes the adoption lifecycle of the market, covering from the innovator’s stage to the laggard’s stage. It focuses on adoption rates in different regions based on penetration. Furthermore, the passenger information system market report also includes key purchase criteria and drivers of price sensitivity to help companies evaluate and develop their market growth analysis strategies.

Customer Landscape of Passenger Information System Industry

Competitive Landscape

Companies are implementing various strategies, such as strategic alliances, passenger information system market forecast, partnerships, mergers and acquisitions, geographical expansion, and product/service launches, to enhance their presence in the industry.

Advantech Co. Ltd. - Delivering integrated public transport digitalization through advanced passenger information systems and intelligent transportation systems (ITS) for enhanced urban mobility and operational efficiency.

The industry research and growth report includes detailed analyses of the competitive landscape of the market and information about key companies, including:

  • Advantech Co. Ltd.
  • ALSTOM SA
  • Cisco Systems Inc.
  • Cubic Corp.
  • Dysten
  • Hitachi Ltd.
  • Huawei Technologies Co. Ltd.
  • Icon Multimedia
  • Indra Group
  • LUNETTA Pvt. Ltd.
  • Mitsubishi Electric Corp.
  • Passio Technologies Inc.
  • r2p Group
  • Rohde and Schwarz GmbH
  • Siemens AG
  • ST Engineering Ltd.
  • Teleste Corp.
  • Televic Group NV
  • Thales Group
  • Wabtec Corp.

Qualitative and quantitative analysis of companies has been conducted to help clients understand the wider business environment as well as the strengths and weaknesses of key industry players. Data is qualitatively analyzed to categorize companies as pure play, category-focused, industry-focused, and diversified; it is quantitatively analyzed to categorize companies as dominant, leading, strong, tentative, and weak.

Recent Development and News in Passenger information system market

  • In March 2025, Siemens AG launched its new AI-driven cloud-based PIS platform, 'ConnectFlow', designed to integrate multimodal transit data for enhanced passenger flow analytics and predictive arrival algorithms.
  • In January 2025, Wabtec Corp. announced the acquisition of a European AI startup specializing in computer vision for a reported $85 million, aiming to integrate advanced passenger counting systems and crowd density monitoring into its rail solutions.
  • In November 2024, Thales Group secured a major contract with the Riyadh Metro project to deploy its comprehensive in-station and onboard passenger information systems, including integrated surveillance and emergency communication protocols across all new lines.
  • In September 2024, Teleste Corp. unveiled its latest line of solar-powered e-paper information displays, designed for wayside passenger information systems at remote bus stops and promoting sustainable transit technologies.

Dive into Technavio’s robust research methodology, blending expert interviews, extensive data synthesis, and validated models for unparalleled Passenger Information System Market insights. See full methodology.

Market Scope
Page number 294
Base year 2025
Historic period 2020-2024
Forecast period 2026-2030
Growth momentum & CAGR Accelerate at a CAGR of 14.3%
Market growth 2026-2030 USD 34018.5 million
Market structure Fragmented
YoY growth 2025-2026(%) 13.7%
Key countries US, Canada, Mexico, Germany, UK, France, Italy, The Netherlands, Spain, China, India, Japan, South Korea, Australia, Indonesia, Brazil, Argentina, Colombia, Saudi Arabia, UAE, South Africa, Israel and Turkey
Competitive landscape Leading Companies, Market Positioning of Companies, Competitive Strategies, and Industry Risks

Request Free Sample

Research Analyst Overview

  • The passenger information system market is defined by its critical role in public transit modernization, driven by an ecosystem of integrated technologies. The foundation includes both onboard passenger information systems and wayside passenger information systems, which leverage digital signage solutions like LED and LCD displays alongside clear public address (PA) systems and voice announcement systems for effective communication.
  • Key functionalities such as next stop announcement systems are now standard in these visual communication solutions. Operationally, data from automatic vehicle location (AVL) and GNSS-based tracking is fed into computer-aided dispatch (CAD) and fleet management software, managed from a central operational control center (OCC). This integration enables sophisticated dynamic route mapping and headway management systems.
  • Advanced capabilities include passenger counting systems and integrated surveillance systems, all connected via secure IP-based communication networks with established emergency communication protocols. For boardroom strategy, the migration to a cloud-based PIS platform is critical, with some operators achieving a 20% reduction in IT overhead.
  • Modern systems facilitate contactless payment integration and mobile ticketing integration through accessible transit data APIs and journey planning applications. Hardware, often seen in passenger-facing displays or e-paper information displays, must be ruggedized display hardware and meet standards such as EN 50155 compliance.
  • The inclusion of infotainment systems and accessibility features like haptic feedback interfaces addresses rising passenger expectations for a seamless experience, while automated service disruption alerts maintain trust.

What are the Key Data Covered in this Passenger Information System Market Research and Growth Report?

  • What is the expected growth of the Passenger Information System Market between 2026 and 2030?

    • USD 34.02 billion, at a CAGR of 14.3%

  • What segmentation does the market report cover?

    • The report is segmented by Component (Solution, and Services), Mode of Transportation (Railways, Roadways, and Air and waterways), Location (On-board, and In-station) and Geography (North America, Europe, APAC, South America, Middle East and Africa)

  • Which regions are analyzed in the report?

    • North America, Europe, APAC, South America and Middle East and Africa

  • What are the key growth drivers and market challenges?

    • Expansion of urban infrastructure and smart city initiatives, Prohibitive initial investment and ongoing maintenance costs

  • Who are the major players in the Passenger Information System Market?

    • Advantech Co. Ltd., ALSTOM SA, Cisco Systems Inc., Cubic Corp., Dysten, Hitachi Ltd., Huawei Technologies Co. Ltd., Icon Multimedia, Indra Group, LUNETTA Pvt. Ltd., Mitsubishi Electric Corp., Passio Technologies Inc., r2p Group, Rohde and Schwarz GmbH, Siemens AG, ST Engineering Ltd., Teleste Corp., Televic Group NV, Thales Group and Wabtec Corp.

Market Research Insights

  • The market dynamics are shaped by a strategic push toward public transport digitalization and the development of comprehensive urban mobility platforms. The integration of mobility as a service (MaaS) frameworks and intermodal transport solutions is driving a need for real-time data synchronization across all transit modes.
  • Intelligent transportation systems (ITS) are at the core of this shift, with implementations showing up to a 15% improvement in network efficiency. Passenger experience enhancement is a key objective, compelling agencies to adopt advanced transit accessibility solutions and a passenger-centric design approach. This focus has led to a 20% increase in passenger satisfaction scores in pilot projects.
  • However, ensuring passenger data privacy and robust cybersecurity for transit networks remain critical considerations in this evolving landscape.

We can help! Our analysts can customize this passenger information system market research report to meet your requirements.

Get in touch

1. Executive Summary

1.1 Market overview

Executive Summary - Chart on Market Overview
Executive Summary - Data Table on Market Overview
Executive Summary - Chart on Global Market Characteristics
Executive Summary - Chart on Market by Geography
Executive Summary - Chart on Market Segmentation by Component
Executive Summary - Chart on Market Segmentation by Mode of Transportation
Executive Summary - Chart on Market Segmentation by Location
Executive Summary - Chart on Incremental Growth
Executive Summary - Data Table on Incremental Growth
Executive Summary - Chart on Company Market Positioning

2. Technavio Analysis

2.1 Analysis of price sensitivity, lifecycle, customer purchase basket, adoption rates, and purchase criteria

2.2 Criticality of inputs and Factors of differentiation

Chart on Overview on criticality of inputs and factors of differentiation

2.3 Factors of disruption

Chart on Overview on factors of disruption

2.4 Impact of drivers and challenges

Chart on Impact of drivers and challenges in 2025 and 2030

3. Market Landscape

3.1 Market ecosystem

Chart on Parent Market
Data Table on - Parent Market

3.2 Market characteristics

Chart on Market characteristics analysis

3.3 Value chain analysis

Chart on Value chain analysis

4. Market Sizing

4.1 Market definition

Data Table on Offerings of companies included in the market definition

4.2 Market segment analysis

Market segments

4.3 Market size 2025

4.4 Market outlook: Forecast for 2025-2030

Chart on Global - Market size and forecast 2025-2030 ($ million)
Data Table on Global - Market size and forecast 2025-2030 ($ million)
Chart on Global Market: Year-over-year growth 2025-2030 (%)
Data Table on Global Market: Year-over-year growth 2025-2030 (%)

5. Historic Market Size

5.1 Global Passenger Information System Market 2020 - 2024

Historic Market Size - Data Table on Global Passenger Information System Market 2020 - 2024 ($ million)

5.2 Component segment analysis 2020 - 2024

Historic Market Size - Component Segment 2020 - 2024 ($ million)

5.3 Mode of Transportation segment analysis 2020 - 2024

Historic Market Size - Mode of Transportation Segment 2020 - 2024 ($ million)

5.4 Location segment analysis 2020 - 2024

Historic Market Size - Location Segment 2020 - 2024 ($ million)

5.5 Geography segment analysis 2020 - 2024

Historic Market Size - Geography Segment 2020 - 2024 ($ million)

5.6 Country segment analysis 2020 - 2024

Historic Market Size - Country Segment 2020 - 2024 ($ million)

6. Qualitative Analysis

6.1 Impact of AI on Global Passenger Information System Market

7. Five Forces Analysis

7.1 Five forces summary

Five forces analysis - Comparison between 2025 and 2030

7.2 Bargaining power of buyers

Bargaining power of buyers - Impact of key factors 2025 and 2030

7.3 Bargaining power of suppliers

Bargaining power of suppliers - Impact of key factors in 2025 and 2030

7.4 Threat of new entrants

Threat of new entrants - Impact of key factors in 2025 and 2030

7.5 Threat of substitutes

Threat of substitutes - Impact of key factors in 2025 and 2030

7.6 Threat of rivalry

Threat of rivalry - Impact of key factors in 2025 and 2030

7.7 Market condition

Chart on Market condition - Five forces 2025 and 2030

8. Market Segmentation by Component

8.1 Market segments

Chart on Component - Market share 2025-2030 (%)
Data Table on Component - Market share 2025-2030 (%)

8.2 Comparison by Component

Chart on Comparison by Component
Data Table on Comparison by Component

8.3 Solution - Market size and forecast 2025-2030

Chart on Solution - Market size and forecast 2025-2030 ($ million)
Data Table on Solution - Market size and forecast 2025-2030 ($ million)
Chart on Solution - Year-over-year growth 2025-2030 (%)
Data Table on Solution - Year-over-year growth 2025-2030 (%)

8.4 Services - Market size and forecast 2025-2030

Chart on Services - Market size and forecast 2025-2030 ($ million)
Data Table on Services - Market size and forecast 2025-2030 ($ million)
Chart on Services - Year-over-year growth 2025-2030 (%)
Data Table on Services - Year-over-year growth 2025-2030 (%)

8.5 Market opportunity by Component

Market opportunity by Component ($ million)
Data Table on Market opportunity by Component ($ million)

9. Market Segmentation by Mode of Transportation

9.1 Market segments

Chart on Mode of Transportation - Market share 2025-2030 (%)
Data Table on Mode of Transportation - Market share 2025-2030 (%)

9.2 Comparison by Mode of Transportation

Chart on Comparison by Mode of Transportation
Data Table on Comparison by Mode of Transportation

9.3 Railways - Market size and forecast 2025-2030

Chart on Railways - Market size and forecast 2025-2030 ($ million)
Data Table on Railways - Market size and forecast 2025-2030 ($ million)
Chart on Railways - Year-over-year growth 2025-2030 (%)
Data Table on Railways - Year-over-year growth 2025-2030 (%)

9.4 Roadways - Market size and forecast 2025-2030

Chart on Roadways - Market size and forecast 2025-2030 ($ million)
Data Table on Roadways - Market size and forecast 2025-2030 ($ million)
Chart on Roadways - Year-over-year growth 2025-2030 (%)
Data Table on Roadways - Year-over-year growth 2025-2030 (%)

9.5 Air and waterways - Market size and forecast 2025-2030

Chart on Air and waterways - Market size and forecast 2025-2030 ($ million)
Data Table on Air and waterways - Market size and forecast 2025-2030 ($ million)
Chart on Air and waterways - Year-over-year growth 2025-2030 (%)
Data Table on Air and waterways - Year-over-year growth 2025-2030 (%)

9.6 Market opportunity by Mode of Transportation

Market opportunity by Mode of Transportation ($ million)
Data Table on Market opportunity by Mode of Transportation ($ million)

10. Market Segmentation by Location

10.1 Market segments

Chart on Location - Market share 2025-2030 (%)
Data Table on Location - Market share 2025-2030 (%)

10.2 Comparison by Location

Chart on Comparison by Location
Data Table on Comparison by Location

10.3 On-board - Market size and forecast 2025-2030

Chart on On-board - Market size and forecast 2025-2030 ($ million)
Data Table on On-board - Market size and forecast 2025-2030 ($ million)
Chart on On-board - Year-over-year growth 2025-2030 (%)
Data Table on On-board - Year-over-year growth 2025-2030 (%)

10.4 In-station - Market size and forecast 2025-2030

Chart on In-station - Market size and forecast 2025-2030 ($ million)
Data Table on In-station - Market size and forecast 2025-2030 ($ million)
Chart on In-station - Year-over-year growth 2025-2030 (%)
Data Table on In-station - Year-over-year growth 2025-2030 (%)

10.5 Market opportunity by Location

Market opportunity by Location ($ million)
Data Table on Market opportunity by Location ($ million)

11. Customer Landscape

11.1 Customer landscape overview

Analysis of price sensitivity, lifecycle, customer purchase basket, adoption rates, and purchase criteria

12. Geographic Landscape

12.1 Geographic segmentation

Chart on Market share by geography 2025-2030 (%)
Data Table on Market share by geography 2025-2030 (%)

12.2 Geographic comparison

Chart on Geographic comparison
Data Table on Geographic comparison

12.3 North America - Market size and forecast 2025-2030

Chart on North America - Market size and forecast 2025-2030 ($ million)
Data Table on North America - Market size and forecast 2025-2030 ($ million)
Chart on North America - Year-over-year growth 2025-2030 (%)
Data Table on North America - Year-over-year growth 2025-2030 (%)
Chart on Regional Comparison - North America
Data Table on Regional Comparison - North America

12.3.1 US - Market size and forecast 2025-2030

Chart on US - Market size and forecast 2025-2030 ($ million)
Data Table on US - Market size and forecast 2025-2030 ($ million)
Chart on US - Year-over-year growth 2025-2030 (%)
Data Table on US - Year-over-year growth 2025-2030 (%)

12.3.2 Canada - Market size and forecast 2025-2030

Chart on Canada - Market size and forecast 2025-2030 ($ million)
Data Table on Canada - Market size and forecast 2025-2030 ($ million)
Chart on Canada - Year-over-year growth 2025-2030 (%)
Data Table on Canada - Year-over-year growth 2025-2030 (%)

12.3.3 Mexico - Market size and forecast 2025-2030

Chart on Mexico - Market size and forecast 2025-2030 ($ million)
Data Table on Mexico - Market size and forecast 2025-2030 ($ million)
Chart on Mexico - Year-over-year growth 2025-2030 (%)
Data Table on Mexico - Year-over-year growth 2025-2030 (%)

12.4 Europe - Market size and forecast 2025-2030

Chart on Europe - Market size and forecast 2025-2030 ($ million)
Data Table on Europe - Market size and forecast 2025-2030 ($ million)
Chart on Europe - Year-over-year growth 2025-2030 (%)
Data Table on Europe - Year-over-year growth 2025-2030 (%)
Chart on Regional Comparison - Europe
Data Table on Regional Comparison - Europe

12.4.1 Germany - Market size and forecast 2025-2030

Chart on Germany - Market size and forecast 2025-2030 ($ million)
Data Table on Germany - Market size and forecast 2025-2030 ($ million)
Chart on Germany - Year-over-year growth 2025-2030 (%)
Data Table on Germany - Year-over-year growth 2025-2030 (%)

12.4.2 UK - Market size and forecast 2025-2030

Chart on UK - Market size and forecast 2025-2030 ($ million)
Data Table on UK - Market size and forecast 2025-2030 ($ million)
Chart on UK - Year-over-year growth 2025-2030 (%)
Data Table on UK - Year-over-year growth 2025-2030 (%)

12.4.3 France - Market size and forecast 2025-2030

Chart on France - Market size and forecast 2025-2030 ($ million)
Data Table on France - Market size and forecast 2025-2030 ($ million)
Chart on France - Year-over-year growth 2025-2030 (%)
Data Table on France - Year-over-year growth 2025-2030 (%)

12.4.4 Italy - Market size and forecast 2025-2030

Chart on Italy - Market size and forecast 2025-2030 ($ million)
Data Table on Italy - Market size and forecast 2025-2030 ($ million)
Chart on Italy - Year-over-year growth 2025-2030 (%)
Data Table on Italy - Year-over-year growth 2025-2030 (%)

12.4.5 The Netherlands - Market size and forecast 2025-2030

Chart on The Netherlands - Market size and forecast 2025-2030 ($ million)
Data Table on The Netherlands - Market size and forecast 2025-2030 ($ million)
Chart on The Netherlands - Year-over-year growth 2025-2030 (%)
Data Table on The Netherlands - Year-over-year growth 2025-2030 (%)

12.4.6 Spain - Market size and forecast 2025-2030

Chart on Spain - Market size and forecast 2025-2030 ($ million)
Data Table on Spain - Market size and forecast 2025-2030 ($ million)
Chart on Spain - Year-over-year growth 2025-2030 (%)
Data Table on Spain - Year-over-year growth 2025-2030 (%)

12.5 APAC - Market size and forecast 2025-2030

Chart on APAC - Market size and forecast 2025-2030 ($ million)
Data Table on APAC - Market size and forecast 2025-2030 ($ million)
Chart on APAC - Year-over-year growth 2025-2030 (%)
Data Table on APAC - Year-over-year growth 2025-2030 (%)
Chart on Regional Comparison - APAC
Data Table on Regional Comparison - APAC

12.5.1 China - Market size and forecast 2025-2030

Chart on China - Market size and forecast 2025-2030 ($ million)
Data Table on China - Market size and forecast 2025-2030 ($ million)
Chart on China - Year-over-year growth 2025-2030 (%)
Data Table on China - Year-over-year growth 2025-2030 (%)

12.5.2 India - Market size and forecast 2025-2030

Chart on India - Market size and forecast 2025-2030 ($ million)
Data Table on India - Market size and forecast 2025-2030 ($ million)
Chart on India - Year-over-year growth 2025-2030 (%)
Data Table on India - Year-over-year growth 2025-2030 (%)

12.5.3 Japan - Market size and forecast 2025-2030

Chart on Japan - Market size and forecast 2025-2030 ($ million)
Data Table on Japan - Market size and forecast 2025-2030 ($ million)
Chart on Japan - Year-over-year growth 2025-2030 (%)
Data Table on Japan - Year-over-year growth 2025-2030 (%)

12.5.4 South Korea - Market size and forecast 2025-2030

Chart on South Korea - Market size and forecast 2025-2030 ($ million)
Data Table on South Korea - Market size and forecast 2025-2030 ($ million)
Chart on South Korea - Year-over-year growth 2025-2030 (%)
Data Table on South Korea - Year-over-year growth 2025-2030 (%)

12.5.5 Australia - Market size and forecast 2025-2030

Chart on Australia - Market size and forecast 2025-2030 ($ million)
Data Table on Australia - Market size and forecast 2025-2030 ($ million)
Chart on Australia - Year-over-year growth 2025-2030 (%)
Data Table on Australia - Year-over-year growth 2025-2030 (%)

12.5.6 Indonesia - Market size and forecast 2025-2030

Chart on Indonesia - Market size and forecast 2025-2030 ($ million)
Data Table on Indonesia - Market size and forecast 2025-2030 ($ million)
Chart on Indonesia - Year-over-year growth 2025-2030 (%)
Data Table on Indonesia - Year-over-year growth 2025-2030 (%)

12.6 South America - Market size and forecast 2025-2030

Chart on South America - Market size and forecast 2025-2030 ($ million)
Data Table on South America - Market size and forecast 2025-2030 ($ million)
Chart on South America - Year-over-year growth 2025-2030 (%)
Data Table on South America - Year-over-year growth 2025-2030 (%)
Chart on Regional Comparison - South America
Data Table on Regional Comparison - South America

12.6.1 Brazil - Market size and forecast 2025-2030

Chart on Brazil - Market size and forecast 2025-2030 ($ million)
Data Table on Brazil - Market size and forecast 2025-2030 ($ million)
Chart on Brazil - Year-over-year growth 2025-2030 (%)
Data Table on Brazil - Year-over-year growth 2025-2030 (%)

12.6.2 Argentina - Market size and forecast 2025-2030

Chart on Argentina - Market size and forecast 2025-2030 ($ million)
Data Table on Argentina - Market size and forecast 2025-2030 ($ million)
Chart on Argentina - Year-over-year growth 2025-2030 (%)
Data Table on Argentina - Year-over-year growth 2025-2030 (%)

12.6.3 Colombia - Market size and forecast 2025-2030

Chart on Colombia - Market size and forecast 2025-2030 ($ million)
Data Table on Colombia - Market size and forecast 2025-2030 ($ million)
Chart on Colombia - Year-over-year growth 2025-2030 (%)
Data Table on Colombia - Year-over-year growth 2025-2030 (%)

12.7 Middle East and Africa - Market size and forecast 2025-2030

Chart on Middle East and Africa - Market size and forecast 2025-2030 ($ million)
Data Table on Middle East and Africa - Market size and forecast 2025-2030 ($ million)
Chart on Middle East and Africa - Year-over-year growth 2025-2030 (%)
Data Table on Middle East and Africa - Year-over-year growth 2025-2030 (%)
Chart on Regional Comparison - Middle East and Africa
Data Table on Regional Comparison - Middle East and Africa

12.7.1 Saudi Arabia - Market size and forecast 2025-2030

Chart on Saudi Arabia - Market size and forecast 2025-2030 ($ million)
Data Table on Saudi Arabia - Market size and forecast 2025-2030 ($ million)
Chart on Saudi Arabia - Year-over-year growth 2025-2030 (%)
Data Table on Saudi Arabia - Year-over-year growth 2025-2030 (%)

12.7.2 UAE - Market size and forecast 2025-2030

Chart on UAE - Market size and forecast 2025-2030 ($ million)
Data Table on UAE - Market size and forecast 2025-2030 ($ million)
Chart on UAE - Year-over-year growth 2025-2030 (%)
Data Table on UAE - Year-over-year growth 2025-2030 (%)

12.7.3 South Africa - Market size and forecast 2025-2030

Chart on South Africa - Market size and forecast 2025-2030 ($ million)
Data Table on South Africa - Market size and forecast 2025-2030 ($ million)
Chart on South Africa - Year-over-year growth 2025-2030 (%)
Data Table on South Africa - Year-over-year growth 2025-2030 (%)

12.7.4 Israel - Market size and forecast 2025-2030

Chart on Israel - Market size and forecast 2025-2030 ($ million)
Data Table on Israel - Market size and forecast 2025-2030 ($ million)
Chart on Israel - Year-over-year growth 2025-2030 (%)
Data Table on Israel - Year-over-year growth 2025-2030 (%)

12.7.5 Turkey - Market size and forecast 2025-2030

Chart on Turkey - Market size and forecast 2025-2030 ($ million)
Data Table on Turkey - Market size and forecast 2025-2030 ($ million)
Chart on Turkey - Year-over-year growth 2025-2030 (%)
Data Table on Turkey - Year-over-year growth 2025-2030 (%)

12.8 Market opportunity by geography

Market opportunity by geography ($ million)
Data Tables on Market opportunity by geography ($ million)

13. Drivers, Challenges, and Opportunity

13.1 Market drivers

Expansion of urban infrastructure and smart city initiatives
Integration of real-time data analytics
Rising consumer expectations for seamless connectivity and convenience

13.2 Market challenges

Prohibitive initial investment and ongoing maintenance costs
Cybersecurity vulnerabilities and data privacy regulations
Technical difficulties in retrofitting legacy transport systems

13.3 Impact of drivers and challenges

Impact of drivers and challenges in 2025 and 2030

13.4 Market opportunities

Rise of AI and predictive analytics in passenger data management
Strategic transition toward cloud-based architectures and SaaS
Proliferation of high-bandwidth connectivity and IoT for hyper-personalization

14. Competitive Landscape

14.1 Overview

14.2

Overview on criticality of inputs and factors of differentiation

14.3 Landscape disruption

Overview on factors of disruption

14.4 Industry risks

Impact of key risks on business

15. Competitive Analysis

15.1 Companies profiled

Companies covered

15.2 Company ranking index

15.3 Market positioning of companies

Matrix on companies position and classification

15.4 Advantech Co. Ltd.

Advantech Co. Ltd. - Overview
Advantech Co. Ltd. - Business segments
Advantech Co. Ltd. - Key news
Advantech Co. Ltd. - Key offerings
Advantech Co. Ltd. - Segment focus
SWOT

15.5 ALSTOM SA

ALSTOM SA - Overview
ALSTOM SA - Business segments
ALSTOM SA - Key offerings
ALSTOM SA - Segment focus
SWOT

15.6 Cisco Systems Inc.

Cisco Systems Inc. - Overview
Cisco Systems Inc. - Business segments
Cisco Systems Inc. - Key news
Cisco Systems Inc. - Key offerings
Cisco Systems Inc. - Segment focus
SWOT

15.7 Cubic Corp.

Cubic Corp. - Overview
Cubic Corp. - Product / Service
Cubic Corp. - Key offerings
SWOT

15.8 Dysten

Dysten - Overview
Dysten - Product / Service
Dysten - Key offerings
SWOT

15.9 Hitachi Ltd.

Hitachi Ltd. - Overview
Hitachi Ltd. - Business segments
Hitachi Ltd. - Key news
Hitachi Ltd. - Key offerings
Hitachi Ltd. - Segment focus
SWOT

15.10 Huawei Technologies Co. Ltd.

Huawei Technologies Co. Ltd. - Overview
Huawei Technologies Co. Ltd. - Business segments
Huawei Technologies Co. Ltd. - Key news
Huawei Technologies Co. Ltd. - Key offerings
Huawei Technologies Co. Ltd. - Segment focus
SWOT

15.11 LUNETTA Pvt. Ltd.

LUNETTA Pvt. Ltd. - Overview
LUNETTA Pvt. Ltd. - Product / Service
LUNETTA Pvt. Ltd. - Key offerings
SWOT

15.12 Mitsubishi Electric Corp.

Mitsubishi Electric Corp. - Overview
Mitsubishi Electric Corp. - Business segments
Mitsubishi Electric Corp. - Key offerings
Mitsubishi Electric Corp. - Segment focus
SWOT

15.13 Siemens AG

Siemens AG - Overview
Siemens AG - Business segments
Siemens AG - Key news
Siemens AG - Key offerings
Siemens AG - Segment focus
SWOT

15.14 ST Engineering Ltd.

ST Engineering Ltd. - Overview
ST Engineering Ltd. - Business segments
ST Engineering Ltd. - Key news
ST Engineering Ltd. - Key offerings
ST Engineering Ltd. - Segment focus
SWOT

15.15 Teleste Corp.

Teleste Corp. - Overview
Teleste Corp. - Product / Service
Teleste Corp. - Key news
Teleste Corp. - Key offerings
SWOT

15.16 Televic Group NV

Televic Group NV - Overview
Televic Group NV - Product / Service
Televic Group NV - Key offerings
SWOT

15.17 Thales Group

Thales Group - Overview
Thales Group - Business segments
Thales Group - Key news
Thales Group - Key offerings
Thales Group - Segment focus
SWOT

15.18 Wabtec Corp.

Wabtec Corp. - Overview
Wabtec Corp. - Business segments
Wabtec Corp. - Key offerings
Wabtec Corp. - Segment focus
SWOT

16. Appendix

16.1 Scope of the report

Market definition
Objectives
Notes and caveats

16.2 Inclusions and exclusions checklist

Inclusions checklist
Exclusions checklist

16.3 Currency conversion rates for US$

16.4 Research methodology

16.5 Data procurement

Information sources

16.6 Data validation

16.7 Validation techniques employed for market sizing

16.8 Data synthesis

16.9 360 degree market analysis

16.10 List of abbreviations

Research Methodology

Technavio presents a detailed picture of the market by way of study, synthesis, and summation of data from multiple sources. The analysts have presented the various facets of the market with a particular focus on identifying the key industry influencers. The data thus presented is comprehensive, reliable, and the result of extensive research, both primary and secondary.

INFORMATION SOURCES

Primary sources

  • Manufacturers and suppliers
  • Channel partners
  • Industry experts
  • Strategic decision makers

Secondary sources

  • Industry journals and periodicals
  • Government data
  • Financial reports of key industry players
  • Historical data
  • Press releases

DATA ANALYSIS

Data Synthesis

  • Collation of data
  • Estimation of key figures
  • Analysis of derived insights

Data Validation

  • Triangulation with data models
  • Reference against proprietary databases
  • Corroboration with industry experts

REPORT WRITING

Qualitative

  • Market drivers
  • Market challenges
  • Market trends
  • Five forces analysis

Quantitative

  • Market size and forecast
  • Market segmentation
  • Geographical insights
  • Competitive landscape

Interested in this report?

Get your sample now to see our research methodology and insights!

Download Now

Frequently Asked Questions

Passenger Information System market growth will increase by USD 34018.5 million during 2026-2030.

The Passenger Information System market is expected to grow at a CAGR of 14.3% during 2026-2030.

Passenger Information System market is segmented by Component (Solution, Services) Mode of transportation (Railways, Roadways, Air and waterways) Location (On-board, In-station)

Advantech Co. Ltd., ALSTOM SA, Cisco Systems Inc., Cubic Corp., Dysten, Hitachi Ltd., Huawei Technologies Co. Ltd., Icon Multimedia, Indra Group, LUNETTA Pvt. Ltd., Mitsubishi Electric Corp., Passio Technologies Inc., r2p Group, Rohde and Schwarz GmbH, Siemens AG, ST Engineering Ltd., Teleste Corp., Televic Group NV, Thales Group, Wabtec Corp. are a few of the key vendors in the Passenger Information System market.

North America will register the highest growth rate of 30.2% among the other regions. Therefore, the Passenger Information System market in North America is expected to garner significant business opportunities for the vendors during the forecast period.

US, Canada, Mexico, Germany, UK, France, Italy, The Netherlands, Spain, China, India, Japan, South Korea, Australia, Indonesia, Brazil, Argentina, Colombia, Saudi Arabia, UAE, South Africa, Israel, Turkey

  • Expansion of urban infrastructure and smart city initiatives is the driving factor this market.

The Passenger Information System market vendors should focus on grabbing business opportunities from the Component segment as it accounted for the largest market share in the base year.
RIA - Research AI Assistant
Ask RIA