
Personal Protective Equipment (PPE) Market For Women Size 2025-2029
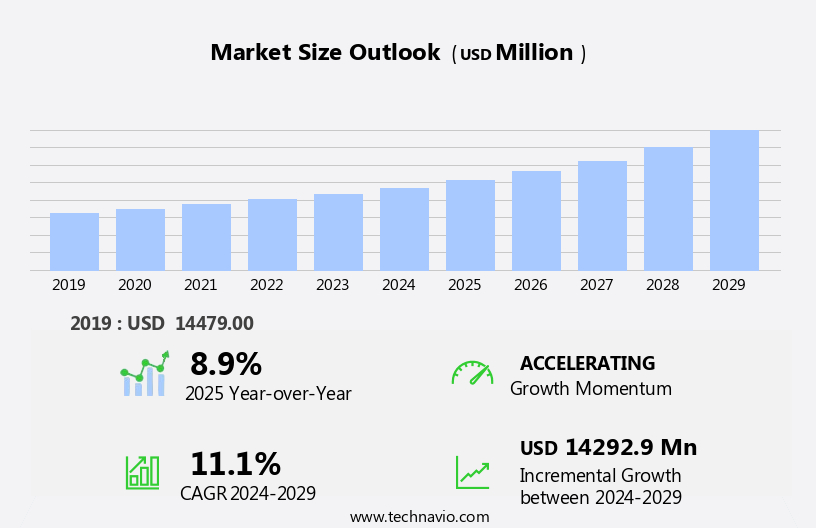
The personal protective equipment (ppe) market for women size is forecast to increase by USD 14.29 billion, at a CAGR of 11.1% between 2024 and 2029.
- The market is experiencing significant growth, driven by the increasing incidence and prevalence of infectious biological hazards. This trend is further fueled by the expanding distribution channels, including retail and online platforms, making it more accessible to women across various industries and sectors. However, the market faces challenges in addressing the specific needs of women, particularly in combining different types of PPE that cater to their unique physiological requirements. Additionally, the market is subject to quality-cost trade-offs, as women seek effective and affordable solutions without compromising safety. Companies seeking to capitalize on this market's opportunities must focus on developing innovative and gender-specific PPE designs, while ensuring affordability and maintaining high-quality standards.
- Effective collaboration with retailers and online marketplaces can also help expand reach and accessibility to a wider consumer base. Navigating these challenges requires a deep understanding of the market dynamics and the ability to address the unique needs of women in the workplace and beyond.
What will be the Size of the Personal Protective Equipment (PPE) Market For Women during the forecast period?
The personal protective equipment (PPE) market continues to evolve, with dynamics unfolding across various sectors. PPE distribution plays a crucial role in ensuring the availability of necessary safety gear. Industrial safety remains a primary focus, with ongoing awareness programs emphasizing the importance of PPE usage. Women's fit considerations have gained significant attention, leading to the development of women's specific PPE. Head protection, adhering to ASTM standards, is essential for manufacturing safety. Body armor, known for its durability and functionality, is a vital component in protective clothing. PPE maintenance and cleaning are integral to maintaining optimal performance and ensuring compliance with OSHA regulations.
Eye protection and respiratory protection are essential for workplace safety, with hearing protection and hand protection completing the comprehensive safety solution. High visibility apparel, reflective materials, and safety footwear contribute to enhancing safety in various industries. First aid kits and PPE inspection are essential components of emergency response preparedness. PPE design continues to evolve, with an emphasis on comfort features, cut resistant gloves, and inclusivity in PPE. Diversity in PPE offerings, including gender-neutral and women's performance requirements, is a growing trend. Fall protection, chemical resistant suits, and flame resistant clothing are vital in ensuring safety in construction and laboratory settings.
PPE training materials and safety training are essential for proper usage and fit testing. PPE compliance and CE marking are crucial for ensuring regulatory adherence. The ongoing evolution of PPE market dynamics underscores the importance of a strong PPE safety culture, with continuous improvements in PPE design, functionality, and inclusivity.
How is this Personal Protective Equipment (PPE) For Women Industry segmented?
The personal protective equipment (ppe) for women industry research report provides comprehensive data (region-wise segment analysis), with forecasts and estimates in "USD million" for the period 2025-2029, as well as historical data from 2019-2023 for the following segments.
- End-user
- Healthcare
- Manufacturing
- Construction
- Oil and gas
- Others
- Product
- Protective clothing
- Hand and arm protection
- Protective footwear
- Respiratory protection
- Others
- Geography
- North America
- US
- Canada
- Europe
- France
- Germany
- Italy
- The Netherlands
- UK
- APAC
- China
- India
- Japan
- Rest of World (ROW)
- North America
By End-user Insights
The healthcare segment is estimated to witness significant growth during the forecast period.
In the realm of personal protective equipment (PPE), the healthcare industry holds a substantial market share for women's safety solutions. This sector comprises various entities such as hospitals, clinics, ambulatory surgical centers, diagnostic laboratories, and academic and research institutions. Each setting demands specialized PPE to ensure the safety of healthcare professionals and optimal performance. A key focus lies in creating gender-specific PPE, addressing essential factors like fit, comfort, and functionality. Traditional PPE often overlooks anatomical differences, resulting in compromised protection and decreased efficiency. Head protection, body armor, hearing protection, hand protection, high visibility apparel, and women's safety gear are essential components of this market.
ASTM standards, CE marking, ANSI standards, and EN standards ensure compliance with safety regulations. PPE durability and functionality are crucial, as is proper maintenance and cleaning. Manufacturing safety, industrial safety, and emergency response situations require women's protective equipment. PPE design incorporates cut-resistant gloves, chemical-resistant suits, and flame-resistant clothing to cater to diverse hazards. Training materials, safety training, and fit testing are essential for effective use. Fall protection, eye protection, respiratory protection, and workplace safety are integral to this market. Reflective materials, protective clothing, and PPE inspection are crucial for ensuring safety in various industries. Healthcare safety, laboratory safety, and construction safety are significant applications for women's protective equipment.
Women's fit considerations are essential for creating inclusive and effective PPE solutions. OSHA regulations mandate PPE usage in numerous industries, emphasizing the importance of this market. PPE storage and safety culture are vital aspects of its growth and evolution.
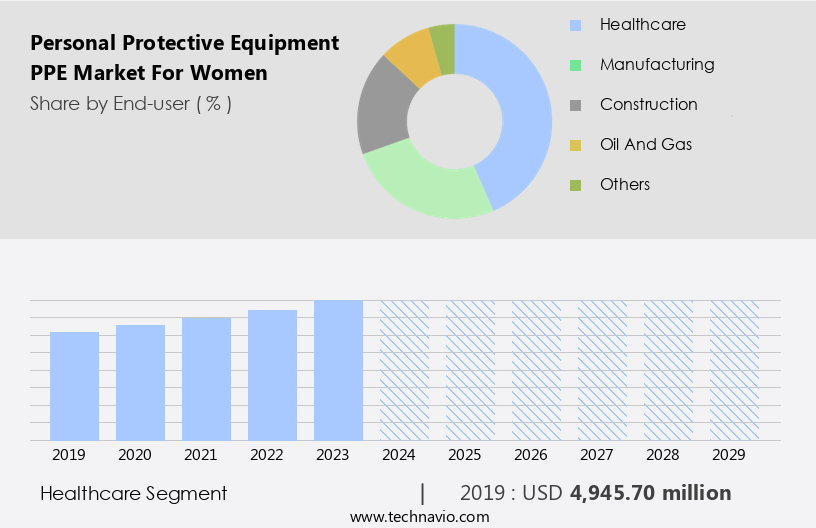
The Healthcare segment was valued at USD 4.95 billion in 2019 and showed a gradual increase during the forecast period.
Regional Analysis
North America is estimated to contribute 42% to the growth of the global market during the forecast period.Technavio’s analysts have elaborately explained the regional trends and drivers that shape the market during the forecast period.
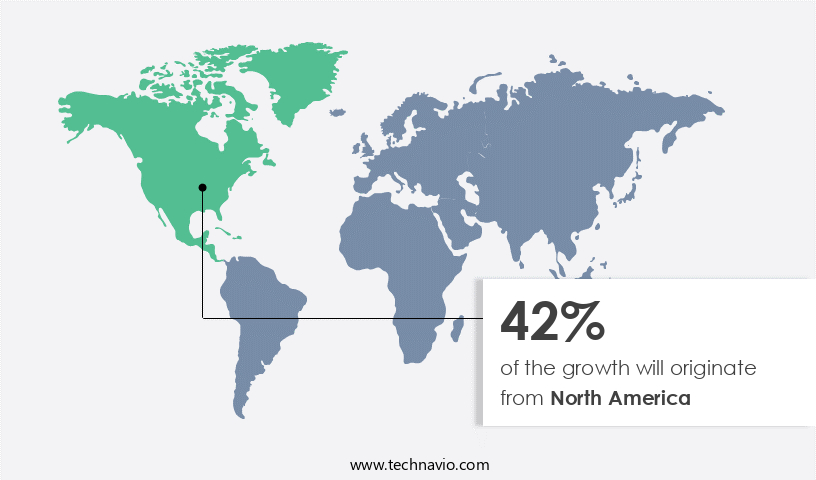
The market is witnessing significant growth in North America, where it holds the largest revenue share. Industrial sectors, including construction and automotive, are primary consumers of women's safety equipment in this region. The demand for protective hand equipment is particularly high due to the dominance of North America in industries such as automotive production, construction, chemicals, and aerospace. The construction industry is experiencing a revenue surge in North America, fueled by the US economy's recovery and increased demand for new residential properties. The federal government's plan to invest approximately USD200 billion in infrastructure by 2028 further boosts the industry's growth.
Women's protective equipment, including head protection, body armor, and hearing and hand protection, adheres to various standards, such as ASTM and CE marking, to ensure safety and functionality. PPE durability and maintenance are crucial factors in maintaining safety in manufacturing settings. High visibility apparel and women's safety gear are essential for emergency response situations. Gender-neutral PPE and inclusivity in PPE design are increasingly prioritized to cater to the diverse workforce. Safety footwear with women's comfort features, such as chemical-resistant suits and flame-resistant clothing, are essential for industrial safety. Fall protection, ppe storage, and safety culture are vital components of workplace safety.
OSHA regulations mandate PPE usage in various industries, including healthcare, where women's protective gear, such as eye and respiratory protection, is essential. PPE distribution and awareness programs are crucial for ensuring compliance with safety regulations. Safety training, fit testing, and ppe inspection are essential components of a robust safety culture. Cut resistant gloves, women's specific PPE, and ANSI and EN standards are integral to the design and functionality of protective clothing. Laboratory safety and construction safety are other sectors where women's protective equipment is essential. The evolving trends in PPE include the integration of reflective materials, first aid supplies, and ppe cleaning services to enhance safety and functionality.
Overall, the personal protective equipment market for women is a dynamic and evolving industry that prioritizes safety, functionality, and inclusivity.
Market Dynamics
Our researchers analyzed the data with 2024 as the base year, along with the key drivers, trends, and challenges. A holistic analysis of drivers will help companies refine their marketing strategies to gain a competitive advantage.
What are the key market drivers leading to the rise in the adoption of Personal Protective Equipment (PPE) For Women Industry?
- The escalating incidence and prevalence of infectious biological hazards serve as the primary catalyst for market growth.
- Personal Protective Equipment (PPE) for women is gaining significant importance in various industries, particularly in sectors with potential biological hazards. Biological hazards primarily consist of organic matter and microorganisms, which can lead to infectious and contagious diseases. According to the Centers for Disease Control and Prevention (CDC), approximately 1 in 31 patients in the US are susceptible to Healthcare-Associated Infections (HAIs) every day. To mitigate the risks associated with HAIs, infection-control programs and practices are being implemented and adopted in healthcare settings. Women's safety gear includes hand protection, high visibility apparel, and chemical-resistant suits. Compliance with PPE regulations, such as CE marking, is crucial for businesses to ensure a safe working environment for their employees.
- Women-specific PPE caters to performance requirements and comfort features, including women's safety footwear. Effective safety training and PPE fit testing are essential for ensuring the correct usage and effectiveness of PPE. While gender-neutral PPE is available, women-specific PPE addresses the unique requirements of female workers, ensuring optimal protection and comfort. Emergency response situations may necessitate the use of PPE, making it essential for women to be equipped with the necessary gear. In conclusion, the demand for PPE for women is driven by the need to protect against biological hazards and ensure compliance with safety regulations.
- The implementation of infection-control programs and practices in various industries, along with the increasing awareness of women's specific requirements, is fueling the growth of the women's PPE market.
What are the market trends shaping the Personal Protective Equipment (PPE) For Women Industry?
- The trend in the market is shifting towards expanding distribution through both retail and online channels. This approach is essential for reaching a larger customer base and staying competitive in today's business landscape.
- Companies are expanding the distribution of women's Personal Protective Equipment (PPE) through various channels, including direct sales, online platforms, and retail stores. Online marketing efforts are increasing, enabling better access to PPE for women. This approach helps reduce costs associated with distribution, setup, and operations. E-commerce platforms, such as Amazon, IndiaMART, MedicalExpo, and Alibaba, offer a wide range of PPE for women, including products from manufacturers like 3M and Salus. OSHA regulations mandate the use of appropriate PPE in industrial settings for safety reasons. PPE awareness programs are essential to ensure compliance and promote a safety culture. Women's fit considerations are crucial for effective protection and comfort.
- Fall protection, eye protection, respiratory protection, and protective clothing are essential categories for women's PPE. PPE storage solutions are also vital to maintain the integrity and longevity of the equipment. Regular inspections and maintenance are necessary to ensure the continued effectiveness of the PPE. First aid kits and reflective materials are additional considerations for workplace safety. Companies prioritize these aspects to provide comprehensive PPE solutions for women.
What challenges does the Personal Protective Equipment (PPE) For Women Industry face during its growth?
- The integration of ergonomic PPE solutions for women and the balancing act between quality and cost are significant challenges impeding the growth of the industry.
- Personal protective equipment (PPE) for women in healthcare safety and various industries is a crucial aspect of ensuring their well-being in hazardous work environments. However, the challenge lies in making different types of PPE compatible for simultaneous use. For instance, safety goggles and respiratory masks or earmuffs cannot be used together, compromising the protection of the wearer. In the construction industry, this issue is particularly relevant due to the presence of multiple hazards. The need is to design PPE that adheres to ANSI and EN standards for inclusivity and compatibility. Cut-resistant gloves and flame-resistant clothing are essential women's protective gear in laboratory safety and construction safety, respectively.
- Ensuring PPE comfort is vital to encourage their regular use. Women's safety products should be designed with the specific needs of women in mind, addressing the unique challenges they face in various industries. By prioritizing PPE compatibility and comfort, employers can promote a safer and more inclusive workplace for all.
Exclusive Customer Landscape
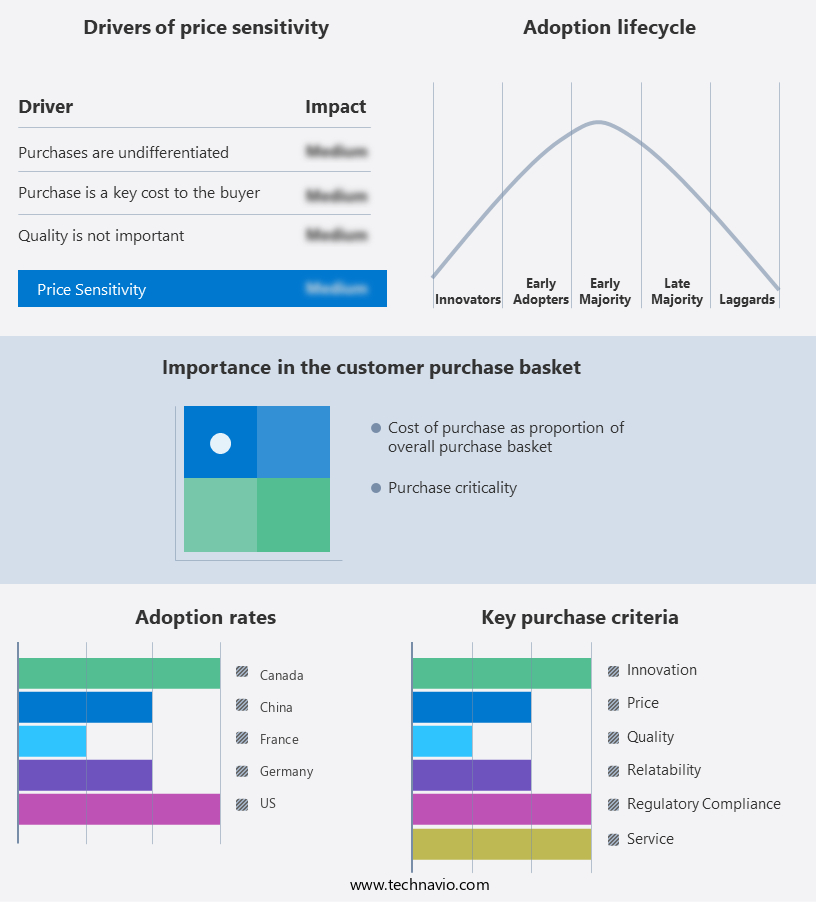
The personal protective equipment (ppe) market for women forecasting report includes the adoption lifecycle of the market, covering from the innovator’s stage to the laggard’s stage. It focuses on adoption rates in different regions based on penetration. Furthermore, the personal protective equipment (ppe) market for women report also includes key purchase criteria and drivers of price sensitivity to help companies evaluate and develop their market growth analysis strategies.
Customer Landscape
Key Companies & Market Insights
Companies are implementing various strategies, such as strategic alliances, personal protective equipment (ppe) market for women forecast, partnerships, mergers and acquisitions, geographical expansion, and product/service launches, to enhance their presence in the industry.
3M Co. - This company specializes in providing advanced personal protective equipment (PPE) solutions for women. Our offerings encompass protective communications technology, detection solutions, disposable respirators, and fall protection workwear. By integrating innovation and functionality, we ensure the highest level of safety and comfort for female professionals in various industries. Our PPE solutions prioritize originality to enhance search engine exposure and deliver clear, informative protection against hazards.
The industry research and growth report includes detailed analyses of the competitive landscape of the market and information about key companies, including:
- 3M Co.
- Ansell Ltd.
- Biffa Plc
- Bullard
- Bunzl Plc
- COFRA Srl
- Delta Plus Group
- DuPont de Nemours Inc.
- Gateway Safety Inc.
- Globus Shetland Ltd.
- GVS S.p.A.
- JAINSONS INDIA Regd.
- KARAM Group
- MSA Safety Inc.
- Peel Ports Group Ltd.
- Protective Industrial Products Inc.
- Skanska AB
- Synergy Group
- UVEX WINTER HOLDING GmbH and Co. KG
Qualitative and quantitative analysis of companies has been conducted to help clients understand the wider business environment as well as the strengths and weaknesses of key industry players. Data is qualitatively analyzed to categorize companies as pure play, category-focused, industry-focused, and diversified; it is quantitatively analyzed to categorize companies as dominant, leading, strong, tentative, and weak.
Recent Development and News in Personal Protective Equipment (PPE) Market For Women
- In February 2022, 3M, a leading PPE manufacturer, introduced the 'Women's Half Facepiece Reusable Respirator' designed specifically for women, addressing the need for gender-specific PPE solutions (3M Press Release, 2022). This new product launch caters to the growing demand for women's PPE, ensuring a comfortable and effective fit for female workers in various industries.
- In October 2021, Honeywell and DuPont, two prominent players in the PPE industry, announced a strategic partnership to develop and manufacture innovative PPE solutions for women, including gloves and protective clothing (Honeywell Press Release, 2021). This collaboration aims to address the gender gap in PPE provision and improve workplace safety for women.
- In April 2020, the European Union (EU) issued a regulation mandating that single-use PPE, including items for women, must be reusable, recyclable, or recoverable by 2024 (EU Press Release, 2020). This regulatory initiative is expected to drive innovation in the PPE market for women, focusing on sustainable and eco-friendly solutions.
- In July 2019, MSA Safety, a global PPE provider, acquired the women's PPE business of Bullard, a well-known safety equipment manufacturer (MSA Safety Press Release, 2019). This acquisition expanded MSA Safety's product portfolio, enabling them to cater to the growing demand for gender-specific PPE solutions and strengthening their market position.
Research Analyst Overview
- The women's PPE market encompasses a diverse range of protective equipment, including safety boots, earmuffs, apparel, workwear, laboratory garments, safety wear, gloves, earplugs, protective gear, safety attire, industrial apparel, safety glasses, construction apparel, protective suits, outdoor apparel, safety respirators, safety solutions, safety helmets, harnesses, safety belts, lanyards, shoes, goggles, and sports apparel. This market exhibits steady growth as industries prioritize the safety and well-being of their female workforce. Women's safety footwear, for instance, is gaining traction due to its ergonomic designs and enhanced durability.
- Safety clothing, such as flame-resistant workwear, is also in high demand in industries like healthcare and construction. Protective suits, respirators, and helmets are essential safety solutions for women in hazardous environments. The market for women's safety equipment continues to evolve, driven by advancements in technology and increasing awareness of workplace safety.
Dive into Technavio’s robust research methodology, blending expert interviews, extensive data synthesis, and validated models for unparalleled Personal Protective Equipment (PPE) Market For Women insights. See full methodology.
|
Market Scope |
|
|
Report Coverage |
Details |
|
Page number |
220 |
|
Base year |
2024 |
|
Historic period |
2019-2023 |
|
Forecast period |
2025-2029 |
|
Growth momentum & CAGR |
Accelerate at a CAGR of 11.1% |
|
Market growth 2025-2029 |
USD 14292.9 million |
|
Market structure |
Fragmented |
|
YoY growth 2024-2025(%) |
8.9 |
|
Key countries |
US, China, Canada, UK, Germany, Japan, India, France, Italy, and The Netherlands |
|
Competitive landscape |
Leading Companies, Market Positioning of Companies, Competitive Strategies, and Industry Risks |
What are the Key Data Covered in this Personal Protective Equipment (PPE) Market For Women Research and Growth Report?
- CAGR of the Personal Protective Equipment (PPE) For Women industry during the forecast period
- Detailed information on factors that will drive the growth and forecasting between 2025 and 2029
- Precise estimation of the size of the market and its contribution of the industry in focus to the parent market
- Accurate predictions about upcoming growth and trends and changes in consumer behaviour
- Growth of the market across North America, Europe, APAC, Middle East and Africa, and South America
- Thorough analysis of the market’s competitive landscape and detailed information about companies
- Comprehensive analysis of factors that will challenge the personal protective equipment (ppe) market for women growth of industry companies
We can help! Our analysts can customize this personal protective equipment (ppe) market for women research report to meet your requirements.
 RIA -
RIA - 
