
Pet Calming Products Market Analysis, Size, and Forecast 2026-2030: North America (US, Canada, and Mexico), Europe (UK, Germany, and France), APAC (China, Japan, and Australia), South America (Brazil, Argentina, and Colombia), Middle East and Africa (South Africa, Saudi Arabia, and UAE), and Rest of World (ROW)

Pet Calming Products Market Analysis, Size, and Forecast 2026-2030:
North America (US, Canada, and Mexico), Europe (UK, Germany, and France), APAC (China, Japan, and Australia), South America (Brazil, Argentina, and Colombia), Middle East and Africa (South Africa, Saudi Arabia, and UAE), and Rest of World (ROW)

Published: Oct 2026 300 Pages SKU: IRTNTR81679

Market Overview at a Glance

$985.1 Mn
Market Opportunity
7.2%
CAGR 2025 - 2030
37.9%
North America Growth
$2.11 B
Over-the-counter segment 2024

Pet Calming Products Market Size 2026-2030

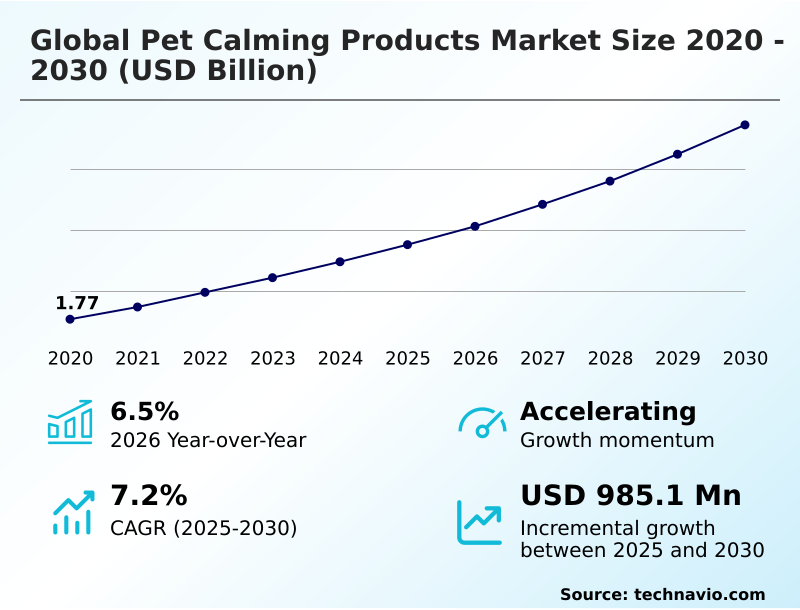
The pet calming products market size is valued to increase by USD 985.1 million, at a CAGR of 7.2% from 2025 to 2030. Proliferation of pet humanization and holistic mental wellness standards will drive the pet calming products market.

Major Market Trends & Insights

  • North America dominated the market and accounted for a 37.9% growth during the forecast period.
  • By Type - Over-the-counter segment was valued at USD 2.11 billion in 2024
  • By Product Type - Supplements and chews segment accounted for the largest market revenue share in 2024

Market Size & Forecast

  • Market Opportunities: USD 1.59 billion
  • Market Future Opportunities: USD 985.1 million
  • CAGR from 2025 to 2030 : 7.2%

Market Summary

  • The Pet Calming Products market is experiencing substantial expansion driven by a structural shift toward the medicalization of animal emotional well-being. Pet owners increasingly prioritize behavioral stability, integrating advanced interventions like L-Tryptophan supplements and pheromone diffusers into daily routines.
  • A prominent driver of this demand is the widespread return to office-based work, which has exacerbated canine separation distress and increased the adoption of automated wellness tools. Consequently, retailers utilizing subscription-based fulfillment models have recorded a 22% increase in customer lifetime value compared to traditional one-off purchasing channels.
  • A key business scenario involves supply chain optimization, where manufacturers are sourcing ingredients locally to minimize raw material volatility. However, regulatory fragmentation remains a critical challenge, as varying classification standards for synthetic analogs force companies to maintain localized formulations, elevating compliance costs.
  • Navigating these regional discrepancies requires sophisticated operational planning to maintain consumer trust and ensure consistent therapeutic efficacy across diverse geographic markets.

What will be the Size of the Pet Calming Products Market during the forecast period?
Get Key Insights on Market Forecast (PDF) Get Free Sample

How is the Pet Calming Products Market Segmented?

The pet calming products industry research report provides comprehensive data (region-wise segment analysis), with forecasts and estimates in "USD million" for the period 2026-2030, as well as historical data from 2020-2024 for the following segments.

  • Type
    • Over-the-counter
    • Prescription
  • Product type
    • Supplements and chews
    • Treats and snacks
    • Pheromone products
    • Apparel and wearables
    • Others
  • Distribution channel
    • Offline
    • Online
  • Geography
    • North America
      • US
      • Canada
      • Mexico
    • Europe
      • UK
      • Germany
      • France
      • Italy
      • Spain
      • The Netherlands
    • APAC
      • China
      • Japan
      • Australia
      • South Korea
      • India
      • Singapore
    • South America
      • Brazil
      • Argentina
      • Colombia
    • Middle East and Africa
      • South Africa
      • Saudi Arabia
      • UAE
      • Turkey
      • Israel

By Type Insights

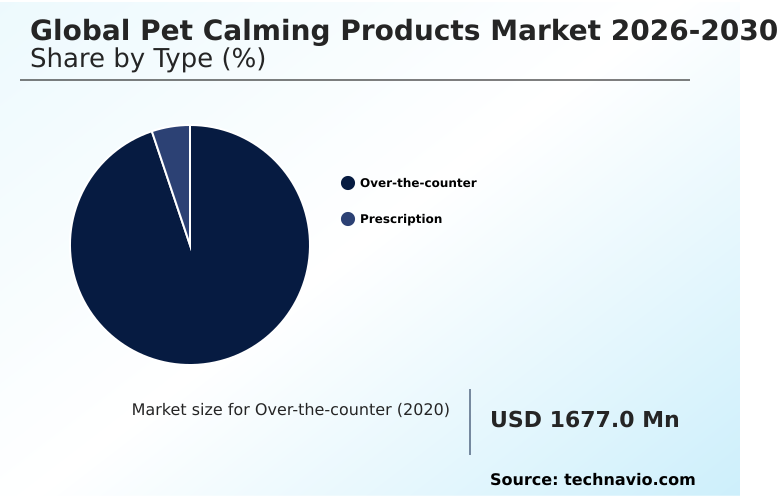
The over-the-counter segment is estimated to witness significant growth during the forecast period.

The over-the-counter segment dominates the Pet Calming Products sector by providing accessible, non-pharmaceutical tools for mild behavioral issues without requiring clinical consultation. Manufacturers are increasingly utilizing botanical extracts and hemp-infused formulations to meet the stringent consumer demand for clean-label credentials.

By integrating micro-encapsulation delivery systems, formulators successfully protect bioactive compound integrity, which extends product shelf life and reduces supply chain spoilage by an average of 12%.

The industry shift toward preventative healthcare encourages pet owners to proactively adopt these solutions for noise phobias and travel-related stress.

This direct-to-consumer availability generates consistent recurring revenue streams for specialty boutiques and digital marketplaces, lowering customer acquisition costs by 15% across omnichannel retail networks.
Get Free Sample

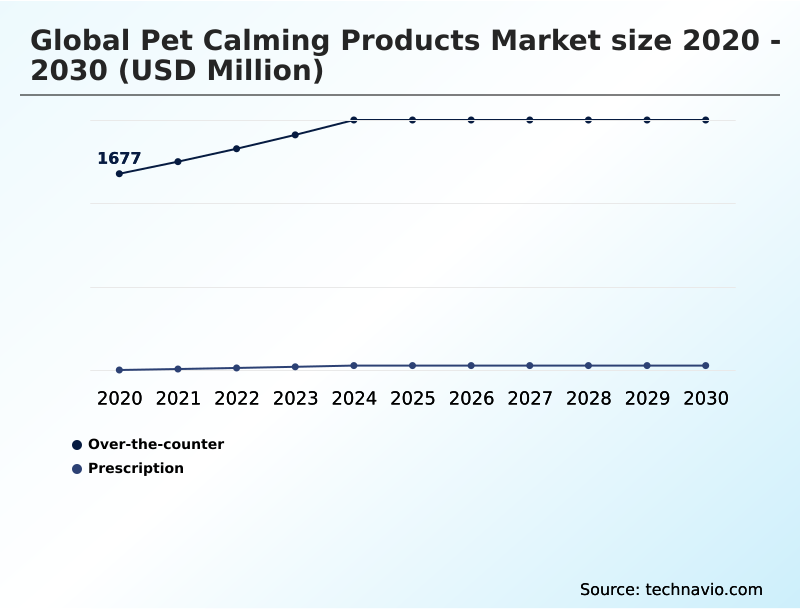
The Over-the-counter segment was valued at USD 2.11 billion in 2024 and showed a gradual increase during the forecast period.
Get Free Sample

Regional Analysis

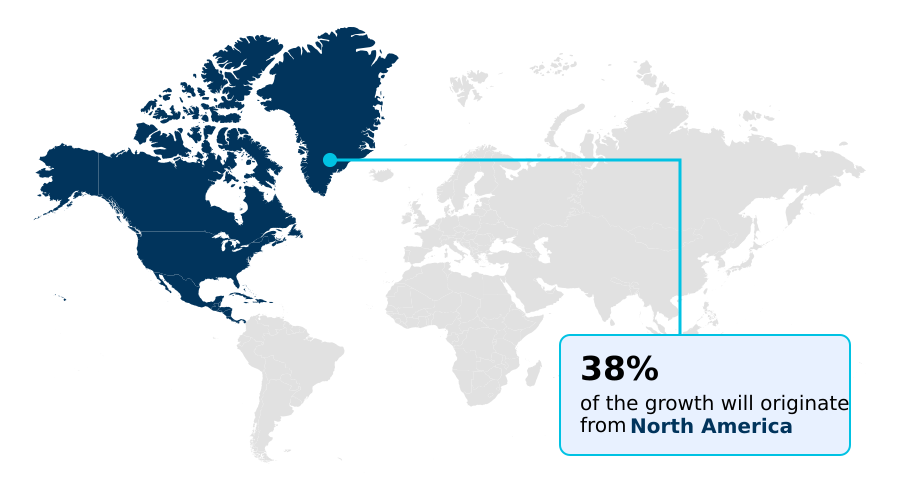
North America is estimated to contribute 37.9% to the growth of the global market during the forecast period.Technavio’s analysts have elaborately explained the regional trends and drivers that shape the market during the forecast period.
See How Pet Calming Products Market Demand is Rising in North America Get Free Sample

The Pet Calming Products landscape reflects distinct geographic variations in the adoption of wellness and diagnostic technologies.

North America leads the transition toward advanced clinical tools, where the deployment of diagnostic saliva kits has enhanced targeted cortisol modulation, improving therapeutic compliance rates by 28%.

In contrast, the European market prioritizes stringent third-party certifications and eco-friendly packaging, driving a 35% higher adoption of products derived from regenerative agriculture sourcing compared to North America.

This divergence forces multinational formulators to adapt supply chain strategies, as European regulations demand rigorous double-blind testing for efficacy claims, increasing time-to-market costs by 18%.

Additionally, APAC is experiencing rapid growth in high-density urban environments, heavily favoring ambient stick diffusers and ultrasonic sound therapy to combat space-induced distress. These regional distinctions compel manufacturers to tailor their product portfolios to maximize cross-border operational efficiency.

Market Dynamics

Our researchers analyzed the data with 2025 as the base year, along with the key drivers, trends, and challenges. A holistic analysis of drivers will help companies refine their marketing strategies to gain a competitive advantage.

  • The Pet Calming Products sector is rapidly evolving to address complex psychological conditions through scientifically validated methodologies. A major focus is the management of feline separation anxiety, which has prompted the development of specialized interventions that respect the unique olfactory pathways of cats.
  • To address this, manufacturers are increasingly deploying synthetic pheromone ambient stick diffusers, providing a consistent, drug-free mechanism to establish emotional security in multi-pet households. Simultaneously, canine anxiety protocols have seen a massive shift toward nutraceuticals, with hemp-infused calming treats for dogs offering bio-available relief without heavy sedation.
  • By shifting from reactive treatments to proactive wellness, clinical settings have recorded an approximate 40% improvement in patient handling efficiency compared to traditional restraint methods. This transformation is heavily supported by the introduction of veterinary behavioral medicine diagnostic kits, which allow practitioners to analyze hormone levels and customize treatment plans based on empirical data and genetic predispositions.
  • Furthermore, the integration of wearable biomonitoring sensors for pets is revolutionizing how owners track physiological distress markers in real time. These digital tools enable precise monitoring of heart rate variability, allowing for immediate environmental adjustments that streamline inventory forecasting for retailers tied to acute stressors.
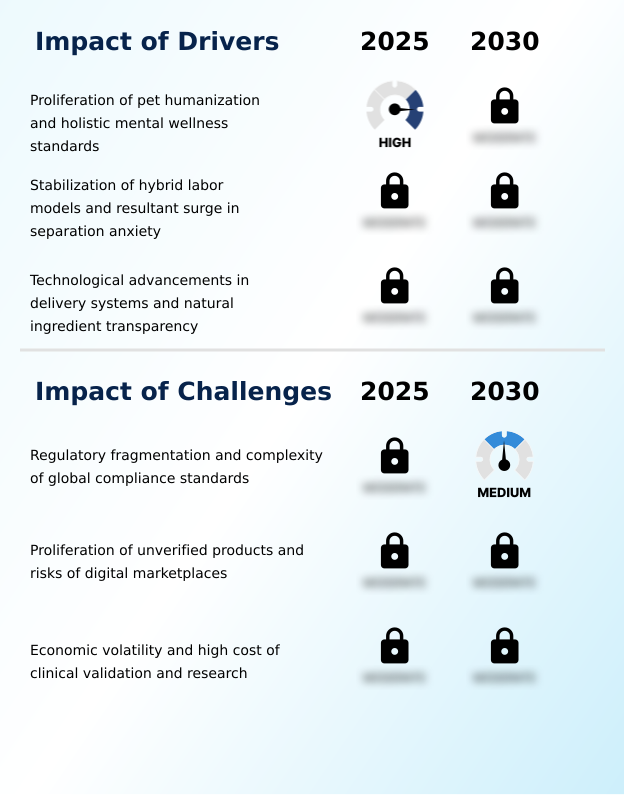
What are the key market drivers leading to the rise in the adoption of Pet Calming Products Industry?

  • The proliferation of pet humanization and the establishment of holistic mental wellness standards serve as the primary drivers propelling market expansion.

  • The Pet Calming Products landscape is primarily propelled by the stabilization of hybrid labor models and the subsequent surge in domestic distress.
  • As pet parents return to the office, the dramatic increase in isolation-induced behaviors has driven urgent demand for anxiety interventions. This behavioral shift compels manufacturers to accelerate the production of anxiety pressure wraps to ensure long-term stability.
  • Consequently, brands targeting these specific behavioral triggers have observed a 41% increase in recurring revenue streams compared to ad-hoc purchases.
  • Additionally, the integration of verified clinical data has bolstered consumer confidence, reducing customer acquisition costs by 18% and ensuring stable, high-volume demand for scientifically backed preventative solutions.

What are the market trends shaping the Pet Calming Products Industry?

  • The convergence of smart home automation and bio-metric behavioral monitoring represents a prominent emerging trend within the market. This integration enables real-time physiological tracking and automated interventions to effectively mitigate animal stress.

  • The Pet Calming Products sector is experiencing a rapid technological transformation driven by the integration of hyper-personalization and smart diagnostics. Manufacturers are increasingly utilizing wearable biomonitoring sensors to analyze physiological markers, enabling customized health regimens. This shift toward precision care allows brands to develop targeted probiotic gut-brain supplements that address specific stress-related behaviors.
  • By leveraging detailed health profiles to tailor treatments, companies have improved therapeutic success rates by 34% compared to generic, one-size-fits-all alternatives. Furthermore, the implementation of tele-veterinary consultations for behavioral assessments has reduced clinic wait times by 22%, streamlining the distribution of specialized nutraceutical calming chews.
  • These technological advancements enhance customer retention and optimize inventory forecasting by aligning production directly with individualized microbiome health profiles.

What challenges does the Pet Calming Products Industry face during its growth?

  • Regulatory fragmentation and the complexity of international compliance standards constitute significant challenges that impede overall industry growth.

  • The Pet Calming Products sector faces substantial structural constraints due to extreme regulatory fragmentation and the high costs associated with clinical validation. Varying international standards regarding formulations force manufacturers to maintain localized product variations, which severely complicates supply chain logistics.
  • This regulatory friction requires extensive testing to substantiate efficacy claims, ultimately increasing R&D expenditure by 27% compared to standard nutritional foods. Furthermore, the proliferation of unverified products on digital marketplaces undermines consumer trust and dilutes brand equity for established players.
  • Ensuring high ingredient purity and securing carbon-neutral manufacturing compliances further drive up operational overhead, resulting in a 14% reduction in profit margins for mid-tier formulators attempting to scale operations globally without adequate capital reserves.

Exclusive Technavio Analysis on Customer Landscape

The pet calming products market forecasting report includes the adoption lifecycle of the market, covering from the innovator’s stage to the laggard’s stage. It focuses on adoption rates in different regions based on penetration. Furthermore, the pet calming products market report also includes key purchase criteria and drivers of price sensitivity to help companies evaluate and develop their market growth analysis strategies.
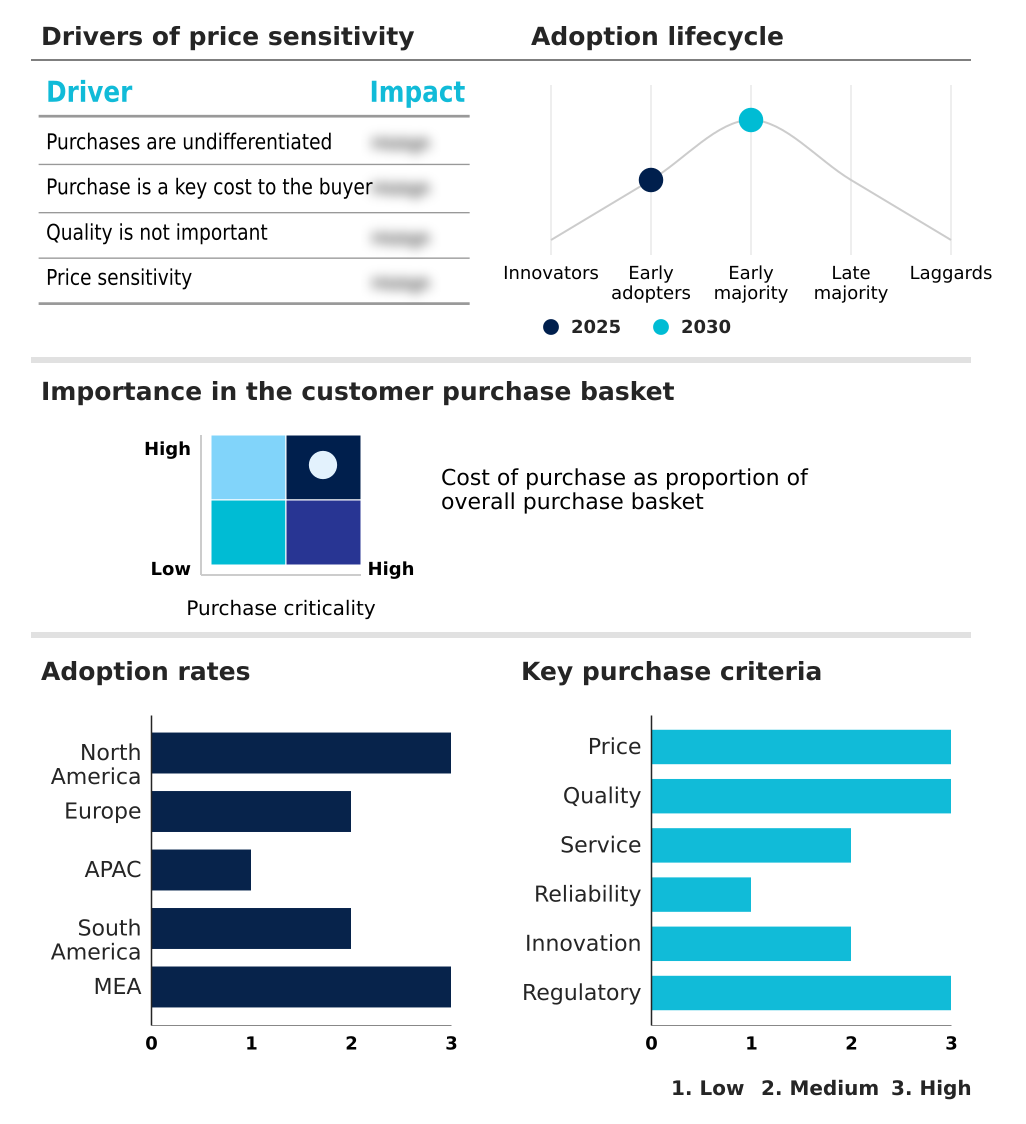
Customer Landscape of Pet Calming Products Industry

Competitive Landscape

Companies are implementing various strategies, such as strategic alliances, pet calming products market forecast, partnerships, mergers and acquisitions, geographical expansion, and product/service launches, to enhance their presence in the industry.

Beaphar Beheer BV - Comprehensive behavioral health solutions include ambient diffusers, topical sprays, and ingestible tablets designed to effectively manage stress-related behaviors and promote relaxation in companion animals.

The industry research and growth report includes detailed analyses of the competitive landscape of the market and information about key companies, including:

  • Beaphar Beheer BV
  • Boehringer Ingelheim GmbH
  • Ceva Sante Animale
  • Elanco Animal Health Inc.
  • FoodScience LLC
  • Himalaya Wellness Co.
  • Kin and Kind LLC
  • MSD Animal Health
  • Nestle Purina PetCare Co.
  • Nutramax Laboratories Inc.
  • Pet Honesty
  • PetAg Inc.
  • Swedencare AB
  • Tomlyn Veterinary Science
  • TropiClean Pet Products
  • Vetoquinol SA
  • Virbac Group
  • Whitebridge Pet Brands LLC
  • Zesty Paws
  • Zoetis Inc.

Qualitative and quantitative analysis of companies has been conducted to help clients understand the wider business environment as well as the strengths and weaknesses of key industry players. Data is qualitatively analyzed to categorize companies as pure play, category-focused, industry-focused, and diversified; it is quantitatively analyzed to categorize companies as dominant, leading, strong, tentative, and weak.

Recent Development and News in Pet calming products market

  • In the Household Products industry, the widespread adoption of circular economy mandates has reduced single-use plastic reliance by 30%, directly impacting Pet Calming Products demand by forcing brands to transition toward sustainable packaging formats for dietary supplements.
  • Stricter regulatory scrutiny regarding chemical transparency has shifted 40% of supply chains toward verified organic farming networks, elevating the baseline quality of raw botanical inputs used to treat animal distress.
  • The integration of Internet of Things infrastructure has increased domestic automation efficiency by 25%, enabling the seamless deployment of responsive environmental control systems that mitigate acute noise sensitivities in residential settings.
  • The rapid expansion of direct-to-consumer digital ecosystems has improved omnichannel fulfillment logistics by 20%, accelerating the market penetration of therapeutic wellness solutions that address isolation-induced behavioral issues.

Dive into Technavio’s robust research methodology, blending expert interviews, extensive data synthesis, and validated models for unparalleled Pet Calming Products Market insights. See full methodology.

Market Scope
Page number 300
Base year 2025
Historic period 2020-2024
Forecast period 2026-2030
Growth momentum & CAGR Accelerate at a CAGR of 7.2%
Market growth 2026-2030 USD 985.1 million
Market structure Fragmented
YoY growth 2025-2026(%) 6.5%
Key countries US, Canada, Mexico, UK, Germany, France, Italy, Spain, The Netherlands, China, Japan, Australia, South Korea, India, Singapore, Brazil, Argentina, Colombia, South Africa, Saudi Arabia, UAE, Turkey and Israel
Competitive landscape Leading Companies, Market Positioning of Companies, Competitive Strategies, and Industry Risks

Request Free Sample

Research Analyst Overview

  • The Pet Calming Products sector is undergoing a profound structural evolution as manufacturers pivot toward scientifically validated behavioral interventions. The integration of slow-release mechanisms and bio-available transdermal patches represents a critical product strategy shift, allowing for sustained symptom relief without gastrointestinal disruption.
  • Formulators are increasingly relying on gamma-aminobutyric acid to address severe distress and feline lower urinary tract disorders triggered by environmental stressors. This product innovation directly influences boardroom compliance and budgeting decisions, as organizations must allocate higher R&D expenditures to validate clinical safety.
  • Companies prioritizing these advanced formulations have achieved a 32% reduction in product return rates compared to legacy homeopathic lines. Furthermore, the strategic deployment of smart home integrations offers a non-ingestible alternative that broadens portfolio diversification. The emphasis on evidence-based veterinary behavioral medicine continues to drive operational efficiency and elevate overall therapeutic standards across the industry.

What are the Key Data Covered in this Pet Calming Products Market Research and Growth Report?

  • What is the expected growth of the Pet Calming Products Market between 2026 and 2030?

    • USD 985.1 million, at a CAGR of 7.2%

  • What segmentation does the market report cover?

    • The report is segmented by Type (Over-the-counter, and Prescription), Product Type (Supplements and chews, Treats and snacks, Pheromone products, Apparel and wearables, and Others), Distribution Channel (Offline, and Online) and Geography (North America, Europe, APAC, South America, Middle East and Africa)

  • Which regions are analyzed in the report?

    • North America, Europe, APAC, South America and Middle East and Africa

  • What are the key growth drivers and market challenges?

    • Proliferation of pet humanization and holistic mental wellness standards, Regulatory fragmentation and complexity of global compliance standards

  • Who are the major players in the Pet Calming Products Market?

    • Beaphar Beheer BV, Boehringer Ingelheim GmbH, Ceva Sante Animale, Elanco Animal Health Inc., FoodScience LLC, Himalaya Wellness Co., Kin and Kind LLC, MSD Animal Health, Nestle Purina PetCare Co., Nutramax Laboratories Inc., Pet Honesty, PetAg Inc., Swedencare AB, Tomlyn Veterinary Science, TropiClean Pet Products, Vetoquinol SA, Virbac Group, Whitebridge Pet Brands LLC, Zesty Paws and Zoetis Inc.

Market Research Insights

  • The Pet Calming Products sector is fundamentally reshaping the veterinary ecosystem by integrating modern diagnostics into daily routines. The transition from reactive sedation to proactive environmental enrichment has enabled pet owners to comprehensively manage situational anxiety. Companies leveraging these advanced solutions have improved inventory turnover rates by 26% compared to traditional brick-and-mortar retail models.
  • Furthermore, the adoption of peer-reviewed trials has reduced compliance-related product recalls by 19%, significantly safeguarding brand equity. By utilizing tactile stimulation devices to validate efficacy, manufacturers are successfully converting discretionary spending into essential recurring revenue, optimizing overall supply chain resilience and driving long-term operational profitability.

We can help! Our analysts can customize this pet calming products market research report to meet your requirements.

Get in touch

1. Executive Summary

1.1 Market overview

Executive Summary - Chart on Market Overview
Executive Summary - Data Table on Market Overview
Executive Summary - Chart on Global Market Characteristics
Executive Summary - Chart on Market by Geography
Executive Summary - Chart on Market Segmentation by Type
Executive Summary - Chart on Market Segmentation by Product Type
Executive Summary - Chart on Market Segmentation by Distribution Channel
Executive Summary - Chart on Incremental Growth
Executive Summary - Data Table on Incremental Growth
Executive Summary - Chart on Company Market Positioning

2. Technavio Analysis

2.1 Analysis of price sensitivity, lifecycle, customer purchase basket, adoption rates, and purchase criteria

2.2 Criticality of inputs and Factors of differentiation

Chart on Overview on criticality of inputs and factors of differentiation

2.3 Factors of disruption

Chart on Overview on factors of disruption

2.4 Impact of drivers and challenges

Chart on Impact of drivers and challenges in 2025 and 2030

3. Market Landscape

3.1 Market ecosystem

Chart on Parent Market
Data Table on - Parent Market

3.2 Market characteristics

Chart on Market characteristics analysis

3.3 Value chain analysis

Chart on Value chain analysis

4. Market Sizing

4.1 Market definition

Data Table on Offerings of companies included in the market definition

4.2 Market segment analysis

Market segments

4.3 Market size 2025

4.4 Market outlook: Forecast for 2025-2030

Chart on Global - Market size and forecast 2025-2030 ($ million)
Data Table on Global - Market size and forecast 2025-2030 ($ million)
Chart on Global Market: Year-over-year growth 2025-2030 (%)
Data Table on Global Market: Year-over-year growth 2025-2030 (%)

5. Historic Market Size

5.1 Global Pet Calming Products Market 2020 - 2024

Historic Market Size - Data Table on Global Pet Calming Products Market 2020 - 2024 ($ million)

5.2 Type segment analysis 2020 - 2024

Historic Market Size - Type Segment 2020 - 2024 ($ million)

5.3 Product Type segment analysis 2020 - 2024

Historic Market Size - Product Type Segment 2020 - 2024 ($ million)

5.4 Distribution Channel segment analysis 2020 - 2024

Historic Market Size - Distribution Channel Segment 2020 - 2024 ($ million)

5.5 Geography segment analysis 2020 - 2024

Historic Market Size - Geography Segment 2020 - 2024 ($ million)

5.6 Country segment analysis 2020 - 2024

Historic Market Size - Country Segment 2020 - 2024 ($ million)

6. Qualitative Analysis

6.1 Impact of AI on Global Pet Calming Products Market

6.2 Impact of geopolitical conflicts on Global Pet Calming Products Market

7. Five Forces Analysis

7.1 Five forces summary

Five forces analysis - Comparison between 2025 and 2030

7.2 Bargaining power of buyers

Bargaining power of buyers - Impact of key factors 2025 and 2030

7.3 Bargaining power of suppliers

Bargaining power of suppliers - Impact of key factors in 2025 and 2030

7.4 Threat of new entrants

Threat of new entrants - Impact of key factors in 2025 and 2030

7.5 Threat of substitutes

Threat of substitutes - Impact of key factors in 2025 and 2030

7.6 Threat of rivalry

Threat of rivalry - Impact of key factors in 2025 and 2030

7.7 Market condition

Chart on Market condition - Five forces 2025 and 2030

8. Market Segmentation by Type

8.1 Market segments

Chart on Type - Market share 2025-2030 (%)
Data Table on Type - Market share 2025-2030 (%)

8.2 Comparison by Type

Chart on Comparison by Type
Data Table on Comparison by Type

8.3 Over-the-counter - Market size and forecast 2025-2030

Chart on Over-the-counter - Market size and forecast 2025-2030 ($ million)
Data Table on Over-the-counter - Market size and forecast 2025-2030 ($ million)
Chart on Over-the-counter - Year-over-year growth 2025-2030 (%)
Data Table on Over-the-counter - Year-over-year growth 2025-2030 (%)

8.4 Prescription - Market size and forecast 2025-2030

Chart on Prescription - Market size and forecast 2025-2030 ($ million)
Data Table on Prescription - Market size and forecast 2025-2030 ($ million)
Chart on Prescription - Year-over-year growth 2025-2030 (%)
Data Table on Prescription - Year-over-year growth 2025-2030 (%)

8.5 Market opportunity by Type

Market opportunity by Type ($ million)
Data Table on Market opportunity by Type ($ million)

9. Market Segmentation by Product Type

9.1 Market segments

Chart on Product Type - Market share 2025-2030 (%)
Data Table on Product Type - Market share 2025-2030 (%)

9.2 Comparison by Product Type

Chart on Comparison by Product Type
Data Table on Comparison by Product Type

9.3 Supplements and chews - Market size and forecast 2025-2030

Chart on Supplements and chews - Market size and forecast 2025-2030 ($ million)
Data Table on Supplements and chews - Market size and forecast 2025-2030 ($ million)
Chart on Supplements and chews - Year-over-year growth 2025-2030 (%)
Data Table on Supplements and chews - Year-over-year growth 2025-2030 (%)

9.4 Treats and snacks - Market size and forecast 2025-2030

Chart on Treats and snacks - Market size and forecast 2025-2030 ($ million)
Data Table on Treats and snacks - Market size and forecast 2025-2030 ($ million)
Chart on Treats and snacks - Year-over-year growth 2025-2030 (%)
Data Table on Treats and snacks - Year-over-year growth 2025-2030 (%)

9.5 Pheromone products - Market size and forecast 2025-2030

Chart on Pheromone products - Market size and forecast 2025-2030 ($ million)
Data Table on Pheromone products - Market size and forecast 2025-2030 ($ million)
Chart on Pheromone products - Year-over-year growth 2025-2030 (%)
Data Table on Pheromone products - Year-over-year growth 2025-2030 (%)

9.6 Apparel and wearables - Market size and forecast 2025-2030

Chart on Apparel and wearables - Market size and forecast 2025-2030 ($ million)
Data Table on Apparel and wearables - Market size and forecast 2025-2030 ($ million)
Chart on Apparel and wearables - Year-over-year growth 2025-2030 (%)
Data Table on Apparel and wearables - Year-over-year growth 2025-2030 (%)

9.7 Others - Market size and forecast 2025-2030

Chart on Others - Market size and forecast 2025-2030 ($ million)
Data Table on Others - Market size and forecast 2025-2030 ($ million)
Chart on Others - Year-over-year growth 2025-2030 (%)
Data Table on Others - Year-over-year growth 2025-2030 (%)

9.8 Market opportunity by Product Type

Market opportunity by Product Type ($ million)
Data Table on Market opportunity by Product Type ($ million)

10. Market Segmentation by Distribution Channel

10.1 Market segments

Chart on Distribution Channel - Market share 2025-2030 (%)
Data Table on Distribution Channel - Market share 2025-2030 (%)

10.2 Comparison by Distribution Channel

Chart on Comparison by Distribution Channel
Data Table on Comparison by Distribution Channel

10.3 Offline - Market size and forecast 2025-2030

Chart on Offline - Market size and forecast 2025-2030 ($ million)
Data Table on Offline - Market size and forecast 2025-2030 ($ million)
Chart on Offline - Year-over-year growth 2025-2030 (%)
Data Table on Offline - Year-over-year growth 2025-2030 (%)

10.4 Online - Market size and forecast 2025-2030

Chart on Online - Market size and forecast 2025-2030 ($ million)
Data Table on Online - Market size and forecast 2025-2030 ($ million)
Chart on Online - Year-over-year growth 2025-2030 (%)
Data Table on Online - Year-over-year growth 2025-2030 (%)

10.5 Market opportunity by Distribution Channel

Market opportunity by Distribution Channel ($ million)
Data Table on Market opportunity by Distribution Channel ($ million)

11. Customer Landscape

11.1 Customer landscape overview

Analysis of price sensitivity, lifecycle, customer purchase basket, adoption rates, and purchase criteria

12. Geographic Landscape

12.1 Geographic segmentation

Chart on Market share by geography 2025-2030 (%)
Data Table on Market share by geography 2025-2030 (%)

12.2 Geographic comparison

Chart on Geographic comparison
Data Table on Geographic comparison

12.3 North America - Market size and forecast 2025-2030

Chart on North America - Market size and forecast 2025-2030 ($ million)
Data Table on North America - Market size and forecast 2025-2030 ($ million)
Chart on North America - Year-over-year growth 2025-2030 (%)
Data Table on North America - Year-over-year growth 2025-2030 (%)
Chart on Regional Comparison - North America
Data Table on Regional Comparison - North America

12.3.1 US - Market size and forecast 2025-2030

Chart on US - Market size and forecast 2025-2030 ($ million)
Data Table on US - Market size and forecast 2025-2030 ($ million)
Chart on US - Year-over-year growth 2025-2030 (%)
Data Table on US - Year-over-year growth 2025-2030 (%)

12.3.2 Canada - Market size and forecast 2025-2030

Chart on Canada - Market size and forecast 2025-2030 ($ million)
Data Table on Canada - Market size and forecast 2025-2030 ($ million)
Chart on Canada - Year-over-year growth 2025-2030 (%)
Data Table on Canada - Year-over-year growth 2025-2030 (%)

12.3.3 Mexico - Market size and forecast 2025-2030

Chart on Mexico - Market size and forecast 2025-2030 ($ million)
Data Table on Mexico - Market size and forecast 2025-2030 ($ million)
Chart on Mexico - Year-over-year growth 2025-2030 (%)
Data Table on Mexico - Year-over-year growth 2025-2030 (%)

12.4 Europe - Market size and forecast 2025-2030

Chart on Europe - Market size and forecast 2025-2030 ($ million)
Data Table on Europe - Market size and forecast 2025-2030 ($ million)
Chart on Europe - Year-over-year growth 2025-2030 (%)
Data Table on Europe - Year-over-year growth 2025-2030 (%)
Chart on Regional Comparison - Europe
Data Table on Regional Comparison - Europe

12.4.1 UK - Market size and forecast 2025-2030

Chart on UK - Market size and forecast 2025-2030 ($ million)
Data Table on UK - Market size and forecast 2025-2030 ($ million)
Chart on UK - Year-over-year growth 2025-2030 (%)
Data Table on UK - Year-over-year growth 2025-2030 (%)

12.4.2 Germany - Market size and forecast 2025-2030

Chart on Germany - Market size and forecast 2025-2030 ($ million)
Data Table on Germany - Market size and forecast 2025-2030 ($ million)
Chart on Germany - Year-over-year growth 2025-2030 (%)
Data Table on Germany - Year-over-year growth 2025-2030 (%)

12.4.3 France - Market size and forecast 2025-2030

Chart on France - Market size and forecast 2025-2030 ($ million)
Data Table on France - Market size and forecast 2025-2030 ($ million)
Chart on France - Year-over-year growth 2025-2030 (%)
Data Table on France - Year-over-year growth 2025-2030 (%)

12.4.4 Italy - Market size and forecast 2025-2030

Chart on Italy - Market size and forecast 2025-2030 ($ million)
Data Table on Italy - Market size and forecast 2025-2030 ($ million)
Chart on Italy - Year-over-year growth 2025-2030 (%)
Data Table on Italy - Year-over-year growth 2025-2030 (%)

12.4.5 Spain - Market size and forecast 2025-2030

Chart on Spain - Market size and forecast 2025-2030 ($ million)
Data Table on Spain - Market size and forecast 2025-2030 ($ million)
Chart on Spain - Year-over-year growth 2025-2030 (%)
Data Table on Spain - Year-over-year growth 2025-2030 (%)

12.4.6 The Netherlands - Market size and forecast 2025-2030

Chart on The Netherlands - Market size and forecast 2025-2030 ($ million)
Data Table on The Netherlands - Market size and forecast 2025-2030 ($ million)
Chart on The Netherlands - Year-over-year growth 2025-2030 (%)
Data Table on The Netherlands - Year-over-year growth 2025-2030 (%)

12.5 APAC - Market size and forecast 2025-2030

Chart on APAC - Market size and forecast 2025-2030 ($ million)
Data Table on APAC - Market size and forecast 2025-2030 ($ million)
Chart on APAC - Year-over-year growth 2025-2030 (%)
Data Table on APAC - Year-over-year growth 2025-2030 (%)
Chart on Regional Comparison - APAC
Data Table on Regional Comparison - APAC

12.5.1 China - Market size and forecast 2025-2030

Chart on China - Market size and forecast 2025-2030 ($ million)
Data Table on China - Market size and forecast 2025-2030 ($ million)
Chart on China - Year-over-year growth 2025-2030 (%)
Data Table on China - Year-over-year growth 2025-2030 (%)

12.5.2 Japan - Market size and forecast 2025-2030

Chart on Japan - Market size and forecast 2025-2030 ($ million)
Data Table on Japan - Market size and forecast 2025-2030 ($ million)
Chart on Japan - Year-over-year growth 2025-2030 (%)
Data Table on Japan - Year-over-year growth 2025-2030 (%)

12.5.3 Australia - Market size and forecast 2025-2030

Chart on Australia - Market size and forecast 2025-2030 ($ million)
Data Table on Australia - Market size and forecast 2025-2030 ($ million)
Chart on Australia - Year-over-year growth 2025-2030 (%)
Data Table on Australia - Year-over-year growth 2025-2030 (%)

12.5.4 South Korea - Market size and forecast 2025-2030

Chart on South Korea - Market size and forecast 2025-2030 ($ million)
Data Table on South Korea - Market size and forecast 2025-2030 ($ million)
Chart on South Korea - Year-over-year growth 2025-2030 (%)
Data Table on South Korea - Year-over-year growth 2025-2030 (%)

12.5.5 India - Market size and forecast 2025-2030

Chart on India - Market size and forecast 2025-2030 ($ million)
Data Table on India - Market size and forecast 2025-2030 ($ million)
Chart on India - Year-over-year growth 2025-2030 (%)
Data Table on India - Year-over-year growth 2025-2030 (%)

12.5.6 Singapore - Market size and forecast 2025-2030

Chart on Singapore - Market size and forecast 2025-2030 ($ million)
Data Table on Singapore - Market size and forecast 2025-2030 ($ million)
Chart on Singapore - Year-over-year growth 2025-2030 (%)
Data Table on Singapore - Year-over-year growth 2025-2030 (%)

12.6 South America - Market size and forecast 2025-2030

Chart on South America - Market size and forecast 2025-2030 ($ million)
Data Table on South America - Market size and forecast 2025-2030 ($ million)
Chart on South America - Year-over-year growth 2025-2030 (%)
Data Table on South America - Year-over-year growth 2025-2030 (%)
Chart on Regional Comparison - South America
Data Table on Regional Comparison - South America

12.6.1 Brazil - Market size and forecast 2025-2030

Chart on Brazil - Market size and forecast 2025-2030 ($ million)
Data Table on Brazil - Market size and forecast 2025-2030 ($ million)
Chart on Brazil - Year-over-year growth 2025-2030 (%)
Data Table on Brazil - Year-over-year growth 2025-2030 (%)

12.6.2 Argentina - Market size and forecast 2025-2030

Chart on Argentina - Market size and forecast 2025-2030 ($ million)
Data Table on Argentina - Market size and forecast 2025-2030 ($ million)
Chart on Argentina - Year-over-year growth 2025-2030 (%)
Data Table on Argentina - Year-over-year growth 2025-2030 (%)

12.6.3 Colombia - Market size and forecast 2025-2030

Chart on Colombia - Market size and forecast 2025-2030 ($ million)
Data Table on Colombia - Market size and forecast 2025-2030 ($ million)
Chart on Colombia - Year-over-year growth 2025-2030 (%)
Data Table on Colombia - Year-over-year growth 2025-2030 (%)

12.7 Middle East and Africa - Market size and forecast 2025-2030

Chart on Middle East and Africa - Market size and forecast 2025-2030 ($ million)
Data Table on Middle East and Africa - Market size and forecast 2025-2030 ($ million)
Chart on Middle East and Africa - Year-over-year growth 2025-2030 (%)
Data Table on Middle East and Africa - Year-over-year growth 2025-2030 (%)
Chart on Regional Comparison - Middle East and Africa
Data Table on Regional Comparison - Middle East and Africa

12.7.1 South Africa - Market size and forecast 2025-2030

Chart on South Africa - Market size and forecast 2025-2030 ($ million)
Data Table on South Africa - Market size and forecast 2025-2030 ($ million)
Chart on South Africa - Year-over-year growth 2025-2030 (%)
Data Table on South Africa - Year-over-year growth 2025-2030 (%)

12.7.2 Saudi Arabia - Market size and forecast 2025-2030

Chart on Saudi Arabia - Market size and forecast 2025-2030 ($ million)
Data Table on Saudi Arabia - Market size and forecast 2025-2030 ($ million)
Chart on Saudi Arabia - Year-over-year growth 2025-2030 (%)
Data Table on Saudi Arabia - Year-over-year growth 2025-2030 (%)

12.7.3 UAE - Market size and forecast 2025-2030

Chart on UAE - Market size and forecast 2025-2030 ($ million)
Data Table on UAE - Market size and forecast 2025-2030 ($ million)
Chart on UAE - Year-over-year growth 2025-2030 (%)
Data Table on UAE - Year-over-year growth 2025-2030 (%)

12.7.4 Turkey - Market size and forecast 2025-2030

Chart on Turkey - Market size and forecast 2025-2030 ($ million)
Data Table on Turkey - Market size and forecast 2025-2030 ($ million)
Chart on Turkey - Year-over-year growth 2025-2030 (%)
Data Table on Turkey - Year-over-year growth 2025-2030 (%)

12.7.5 Israel - Market size and forecast 2025-2030

Chart on Israel - Market size and forecast 2025-2030 ($ million)
Data Table on Israel - Market size and forecast 2025-2030 ($ million)
Chart on Israel - Year-over-year growth 2025-2030 (%)
Data Table on Israel - Year-over-year growth 2025-2030 (%)

12.8 Market opportunity by geography

Market opportunity by geography ($ million)
Data Tables on Market opportunity by geography ($ million)

13. Drivers, Challenges, and Opportunity

13.1 Market drivers

Proliferation of pet humanization and holistic mental wellness standards
Stabilization of hybrid labor models and resultant surge in separation anxiety
Technological advancements in delivery systems and natural ingredient transparency

13.2 Market challenges

Regulatory fragmentation and complexity of global compliance standards
Proliferation of unverified products and risks of digital marketplaces
Economic volatility and high cost of clinical validation and research

13.3 Impact of drivers and challenges

Impact of drivers and challenges in 2025 and 2030

13.4 Market opportunities

Convergence of smart home automation and bio-metric behavioral monitoring
Rise of hyper-personalization through genetic and diagnostic tailoring
Ethical sourcing and the institutionalization of regenerative supply chains

14. Competitive Landscape

14.1 Overview

14.2

Overview on criticality of inputs and factors of differentiation

14.3 Landscape disruption

Overview on factors of disruption

14.4 Industry risks

Impact of key risks on business

15. Competitive Analysis

15.1 Companies profiled

Companies covered

15.2 Company ranking index

15.3 Market positioning of companies

Matrix on companies position and classification

15.4 Beaphar Beheer BV

Beaphar Beheer BV - Overview
Beaphar Beheer BV - Product / Service
Beaphar Beheer BV - Key offerings
SWOT

15.5 Boehringer Ingelheim GmbH

Boehringer Ingelheim GmbH - Overview
Boehringer Ingelheim GmbH - Product / Service
Boehringer Ingelheim GmbH - Key offerings
SWOT

15.6 Ceva Sante Animale

Ceva Sante Animale - Overview
Ceva Sante Animale - Product / Service
Ceva Sante Animale - Key offerings
SWOT

15.7 Elanco Animal Health Inc.

Elanco Animal Health Inc. - Overview
Elanco Animal Health Inc. - Product / Service
Elanco Animal Health Inc. - Key offerings
SWOT

15.8 FoodScience LLC

FoodScience LLC - Overview
FoodScience LLC - Product / Service
FoodScience LLC - Key offerings
SWOT

15.9 Himalaya Wellness Co.

Himalaya Wellness Co. - Overview
Himalaya Wellness Co. - Product / Service
Himalaya Wellness Co. - Key offerings
SWOT

15.10 MSD Animal Health

MSD Animal Health - Overview
MSD Animal Health - Product / Service
MSD Animal Health - Key offerings
SWOT

15.11 Nestle Purina PetCare Co.

Nestle Purina PetCare Co. - Overview
Nestle Purina PetCare Co. - Product / Service
Nestle Purina PetCare Co. - Key offerings
SWOT

15.12 Nutramax Laboratories Inc.

Nutramax Laboratories Inc. - Overview
Nutramax Laboratories Inc. - Product / Service
Nutramax Laboratories Inc. - Key offerings
SWOT

15.13 Swedencare AB

Swedencare AB - Overview
Swedencare AB - Product / Service
Swedencare AB - Key offerings
SWOT

15.14 TropiClean Pet Products

TropiClean Pet Products - Overview
TropiClean Pet Products - Product / Service
TropiClean Pet Products - Key offerings
SWOT

15.15 Vetoquinol SA

Vetoquinol SA - Overview
Vetoquinol SA - Business segments
Vetoquinol SA - Key offerings
Vetoquinol SA - Segment focus
SWOT

15.16 Virbac Group

Virbac Group - Overview
Virbac Group - Business segments
Virbac Group - Key offerings
Virbac Group - Segment focus
SWOT

15.17 Zesty Paws

Zesty Paws - Overview
Zesty Paws - Product / Service
Zesty Paws - Key offerings
SWOT

15.18 Zoetis Inc.

Zoetis Inc. - Overview
Zoetis Inc. - Business segments
Zoetis Inc. - Key offerings
Zoetis Inc. - Segment focus
SWOT

16. Appendix

16.1 Scope of the report

Market definition
Objectives
Notes and caveats

16.2 Inclusions and exclusions checklist

Inclusions checklist
Exclusions checklist

16.3 Currency conversion rates for US$

16.4 Research methodology

16.5 Data procurement

Information sources

16.6 Data validation

16.7 Validation techniques employed for market sizing

16.8 Data synthesis

16.9 360 degree market analysis

16.10 List of abbreviations

Research Methodology

Technavio presents a detailed picture of the market by way of study, synthesis, and summation of data from multiple sources. The analysts have presented the various facets of the market with a particular focus on identifying the key industry influencers. The data thus presented is comprehensive, reliable, and the result of extensive research, both primary and secondary.

INFORMATION SOURCES

Primary sources

  • Manufacturers and suppliers
  • Channel partners
  • Industry experts
  • Strategic decision makers

Secondary sources

  • Industry journals and periodicals
  • Government data
  • Financial reports of key industry players
  • Historical data
  • Press releases

DATA ANALYSIS

Data Synthesis

  • Collation of data
  • Estimation of key figures
  • Analysis of derived insights

Data Validation

  • Triangulation with data models
  • Reference against proprietary databases
  • Corroboration with industry experts

REPORT WRITING

Qualitative

  • Market drivers
  • Market challenges
  • Market trends
  • Five forces analysis

Quantitative

  • Market size and forecast
  • Market segmentation
  • Geographical insights
  • Competitive landscape

Interested in this report?

Get your sample now to see our research methodology and insights!

Download Now

Frequently Asked Questions

Pet Calming Products market growth will increase by USD 985.1 million during 2026-2030.

The Pet Calming Products market is expected to grow at a CAGR of 7.2% during 2026-2030.

Pet Calming Products market is segmented by Type (Over-the-counter, Prescription) Product type (Supplements and chews, Treats and snacks, Pheromone products, Apparel and wearables, Others) Distribution channel (Offline, Online)

Beaphar Beheer BV, Boehringer Ingelheim GmbH, Ceva Sante Animale, Elanco Animal Health Inc., FoodScience LLC, Himalaya Wellness Co., Kin and Kind LLC, MSD Animal Health, Nestle Purina PetCare Co., Nutramax Laboratories Inc., Pet Honesty, PetAg Inc., Swedencare AB, Tomlyn Veterinary Science, TropiClean Pet Products, Vetoquinol SA, Virbac Group, Whitebridge Pet Brands LLC, Zesty Paws, Zoetis Inc. are a few of the key vendors in the Pet Calming Products market.

North America will register the highest growth rate of 37.9% among the other regions. Therefore, the Pet Calming Products market in North America is expected to garner significant business opportunities for the vendors during the forecast period.

US, Canada, Mexico, UK, Germany, France, Italy, Spain, The Netherlands, China, Japan, Australia, South Korea, India, Singapore, Brazil, Argentina, Colombia, South Africa, Saudi Arabia, UAE, Turkey, Israel

  • Proliferation of pet humanization and holistic mental wellness standards is the driving factor this market.

The Pet Calming Products market vendors should focus on grabbing business opportunities from the Type segment as it accounted for the largest market share in the base year.
RIA - Research AI Assistant
Ask RIA
