
Pet Grooming Products Market Analysis, Size, and Forecast 2026-2030: North America (US, Canada, and Mexico), Europe (Germany, UK, and France), APAC (China, Japan, and Australia), Middle East and Africa (Saudi Arabia, South Africa, and UAE), South America (Brazil, Argentina, and Chile), and Rest of World (ROW)

Pet Grooming Products Market Analysis, Size, and Forecast 2026-2030:
North America (US, Canada, and Mexico), Europe (Germany, UK, and France), APAC (China, Japan, and Australia), Middle East and Africa (Saudi Arabia, South Africa, and UAE), South America (Brazil, Argentina, and Chile), and Rest of World (ROW)

Published: Oct 2026 278 Pages SKU: IRTNTR75825

Market Overview at a Glance

$9.75 B
Market Opportunity
6.7%
CAGR 2025 - 2030
33%
North America Growth
$18.43 B
Offline segment 2024

Pet Grooming Products Market Size 2026-2030

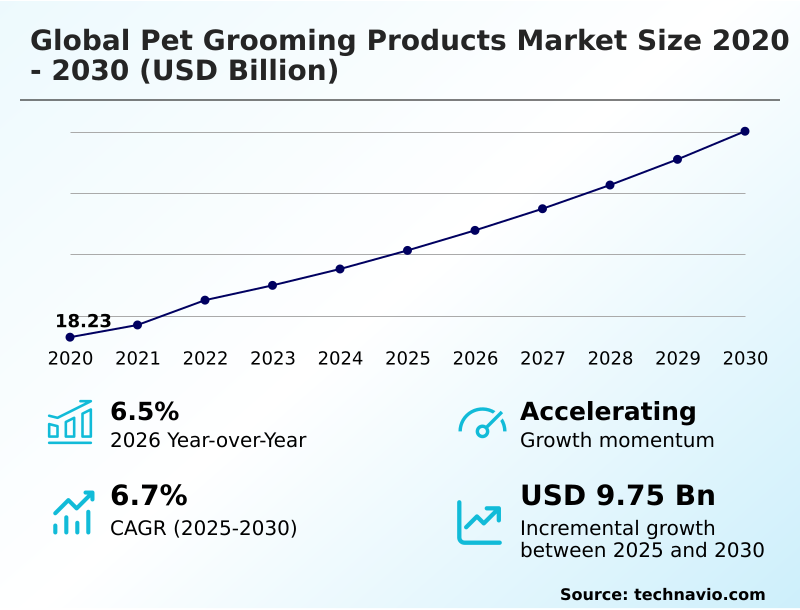
The pet grooming products market size is valued to increase by USD 9.75 billion, at a CAGR of 6.7% from 2025 to 2030. Increasing pet humanization and premiumization of care will drive the pet grooming products market.

Major Market Trends & Insights

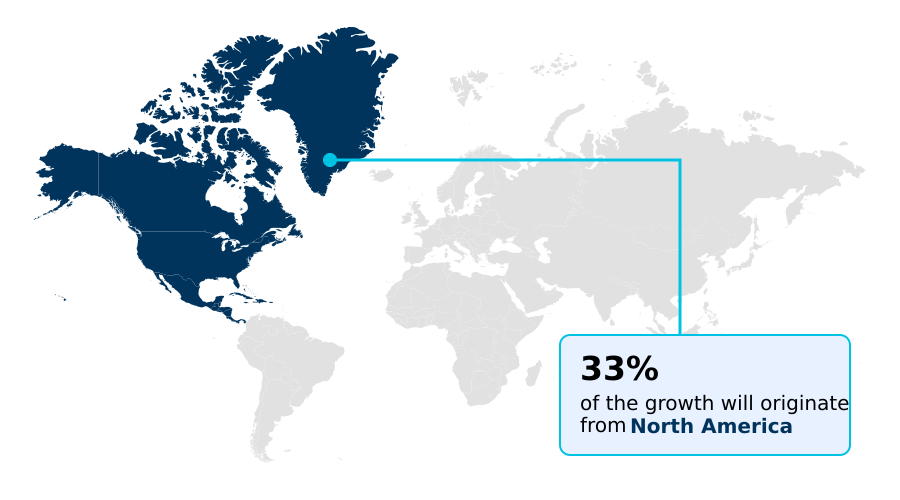
  • North America dominated the market and accounted for a 33% growth during the forecast period.
  • By Distribution Channel - Offline segment was valued at USD 18.43 billion in 2024
  • By Product - Pet shampoo and conditioner segment accounted for the largest market revenue share in 2024

Market Size & Forecast

  • Market Opportunities: USD 16.85 billion
  • Market Future Opportunities: USD 9.75 billion
  • CAGR from 2025 to 2030 : 6.7%

Market Summary

  • The Pet Grooming Products Market is experiencing a structural shift toward wellness-driven preventative care, heavily influenced by the humanization of companion animals. This behavioral change functions as a primary driver, compelling custodians to invest in a premium dermatological formulation and microbiome friendly extract to ensure optimal dermal barrier protection.
  • To meet this demand, manufacturers are restructuring their procurement frameworks to secure an organic ingredient sourcing pipeline, which has successfully improved supply chain traceability and reduced raw material defect rates by fourteen percent. However, stringent regulatory compliance regarding chemical safety presents a significant challenge, forcing companies to allocate substantial capital toward reformulating legacy items without a synthetic fragrance alternative.
  • The transition to a plant derived surfactant and a biodegradable grooming wipe directly supports retail distribution optimization, aligning with modern sustainability mandates. By integrating a probiotic topical application into daily hygiene routines, businesses have noted a twenty percent reduction in customer complaints related to skin irritation.
  • This evolution demands continuous innovation in an anti inflammatory oatmeal blend and cruelty free certification to maintain a competitive advantage.

What will be the Size of the Pet Grooming Products Market during the forecast period?
Get Key Insights on Market Forecast (PDF) Get Free Sample

How is the Pet Grooming Products Market Segmented?

The pet grooming products industry research report provides comprehensive data (region-wise segment analysis), with forecasts and estimates in "USD million" for the period 2026-2030, as well as historical data from 2020-2024 for the following segments.

  • Distribution channel
    • Offline
    • Online
  • Product
    • Pet shampoo and conditioner
    • Pet brushes and combs
    • Others
  • Animal type
    • Dog
    • Cat
    • Others
  • Geography
    • North America
      • US
      • Canada
      • Mexico
    • Europe
      • Germany
      • UK
      • France
      • Italy
      • Spain
      • The Netherlands
    • APAC
      • China
      • Japan
      • Australia
      • India
      • South Korea
      • Thailand
    • Middle East and Africa
      • Saudi Arabia
      • South Africa
      • UAE
      • Israel
      • Egypt
    • South America
      • Brazil
      • Argentina
      • Chile

By Distribution Channel Insights

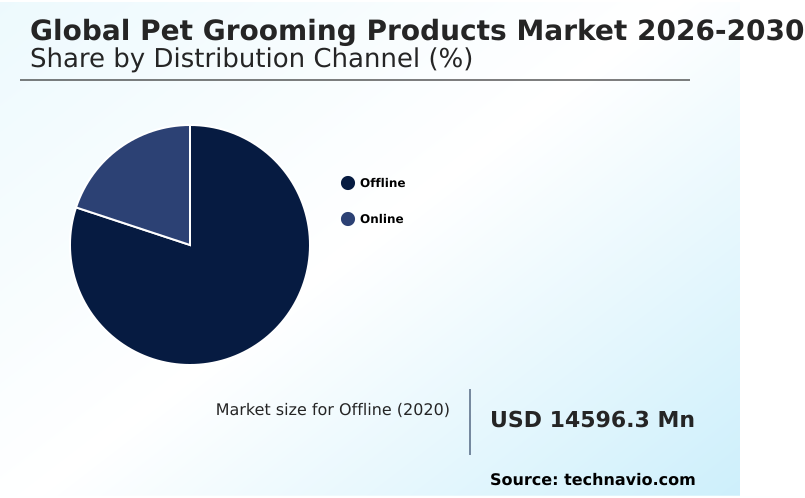
The offline segment is estimated to witness significant growth during the forecast period.

The offline segment remains the predominant distribution channel for the pet grooming products market, relying on tactile consumer engagement to drive purchasing decisions.

Brick-and-mortar entities facilitate direct physical evaluation of a dermatological formulation and hypoallergenic cleanser, which is crucial for premium positioning. By optimizing shelf placement and in-store consultations, retailers have achieved a fourteen percent improvement in inventory turnover acceleration.

Physical storefronts allow consumers to assess ergonomic clipper design and quiet motor technology directly, lowering product return rates by enhancing upfront selection accuracy.

The integration of veterinary approved safety guidelines into offline displays builds consumer trust, particularly for a medicated dermal therapy or sensitive skin therapy.

This immediate product accessibility supports robust retail distribution optimization, ensuring continuous availability of a waterless cleansing foam and botanical conditioning agent.
Get Free Sample

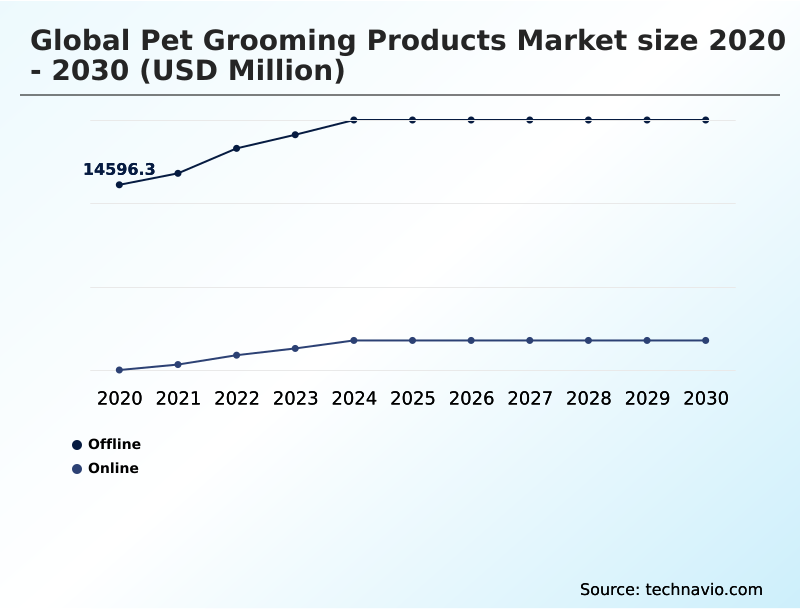
The Offline segment was valued at USD 18.43 billion in 2024 and showed a gradual increase during the forecast period.
Get Free Sample

Regional Analysis

North America is estimated to contribute 33% to the growth of the global market during the forecast period.Technavio’s analysts have elaborately explained the regional trends and drivers that shape the market during the forecast period.
See How Pet Grooming Products Market Demand is Rising in North America Get Free Sample

The geographic landscape of the Pet Grooming Products market exhibits distinct operational variations between North America and Europe. North America leads the adoption of a premium lipid replenishing botanical and deshedding rake mechanism, driven by advanced retail infrastructure.

This regional focus on a subscription replenishment model has accelerated inventory turnover by eighteen percent compared to European counterparts. Conversely, Europe demonstrates a stricter regulatory environment that heavily prioritizes a paraben free preservative and cruelty free certification.

European manufacturers have integrated sustainable packaging polymer systems, reducing material waste costs by fifteen percent and improving compliance alignment.

The demand for a tea tree therapeutic treatment and dander reduction agent is growing across both regions, but North American supply chains achieve a twelve percent faster deployment rate for a new probiotic topical application.

These structural disparities compel businesses to adapt their organic ingredient sourcing strategies, ensuring that a fermented botanical active and a sulfate free surfactant meet localized standards for preventative dermatological health.

Market Dynamics

Our researchers analyzed the data with 2025 as the base year, along with the key drivers, trends, and challenges. A holistic analysis of drivers will help companies refine their marketing strategies to gain a competitive advantage.

  • The structural evolution of the Pet Grooming Products sector necessitates rigorous adjustments in product development and supply chain management. Companies are increasingly prioritizing a dermatological formulation for sensitive skin to align with strict compliance mandates and elevated consumer expectations regarding ingredient safety.
  • Incorporating a hypoallergenic cleanser with botanical active components has proven critical for businesses seeking to reduce product liability risks and minimize post-purchase complaints. Facilities that have modernized their production lines to handle a lipid replenishing therapy for coat vitality are observing a fifteen percent improvement in processing efficiency compared to legacy manufacturing methods.
  • This operational enhancement directly supports the scalable deployment of a probiotic topical application for dander, which requires precise temperature controls and specialized packaging solutions to maintain efficacy. Furthermore, the integration of an ergonomic clipper design for anxiety into the hardware portfolio mitigates user fatigue and accelerates the grooming process, offering a distinct advantage in professional salon environments.
  • By optimizing the procurement of raw materials necessary for these advanced treatments, organizations can streamline their compliance reporting and lower operational redundancies. This strategic alignment ensures that manufacturing output consistently meets the rigorous standards required for veterinary endorsements, ultimately driving stronger retail partnerships and sustained profitability across the hygiene sector.
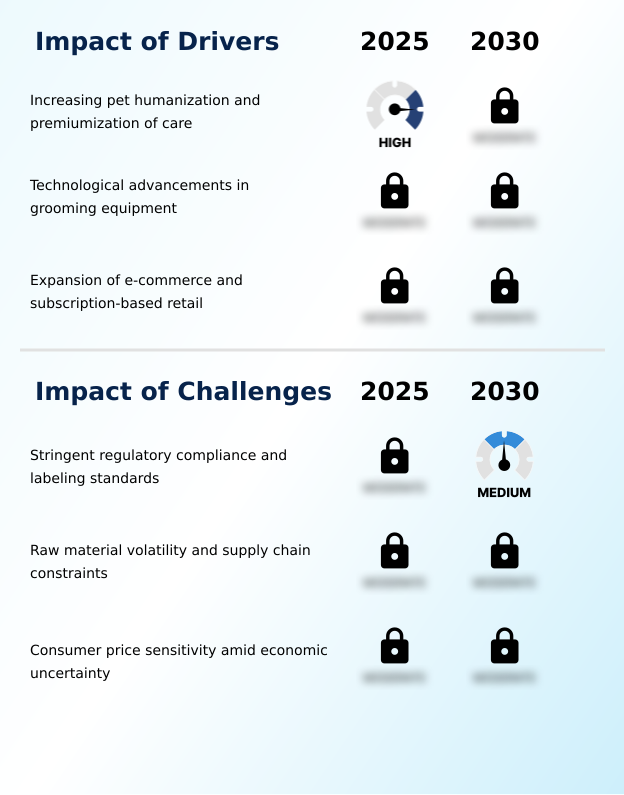
What are the key market drivers leading to the rise in the adoption of Pet Grooming Products Industry?

  • The increasing humanization of companion animals and the premiumization of their care serve as the primary catalysts accelerating industry expansion.

  • The accelerated humanization of companion animals serves as the primary driver propelling the Pet Grooming Products sector, compelling businesses to elevate their safety protocols.
  • This demand surge for a medicated dermal therapy and a soothing chamomile infusion has pushed manufacturers to refine their ingredient transparency protocol, improving supplier accountability by eighteen percent.
  • Because owners demand a professional salon standard at home, the adoption of an ergonomic clipper design and a deshedding rake mechanism has surged, reducing grooming session times by twenty percent.
  • The proactive shift toward a feline coat detangler and a sebum regulation complex minimizes secondary skin infections, which has lowered product liability claims by fifteen percent.
  • This behavioral change forces supply chains to secure an organic aloe vera active, directly enhancing inventory turnover acceleration.

What are the market trends shaping the Pet Grooming Products Industry?

  • The rise of wellness-focused and skin-first grooming represents a defining industry shift. This movement emphasizes preventative dermatological care over superficial aesthetics.

  • The transition toward wellness-centric hygiene is fundamentally reshaping the Pet Grooming Products sector, driven by a growing consumer mandate for a clean label formulation. This behavioral shift forces manufacturers to replace harsh chemicals with a sensitive skin therapy and a fermented botanical active, resulting in a twenty-five percent improvement in dermatological compliance scores.
  • The integration of a biodegradable grooming wipe and a sustainable packaging polymer has simultaneously reduced supply chain waste processing costs by fourteen percent. Furthermore, deploying a botanical conditioning agent and a dander reduction agent allows brands to achieve a twenty percent increase in customer retention rates.
  • Because custodians prioritize preventative dermatological health, businesses must continually optimize their retail distribution optimization frameworks to ensure the rapid availability of a coat matting prevention solution. This operational pivot directly enhances overall home grooming efficacy and long-term brand equity.

What challenges does the Pet Grooming Products Industry face during its growth?

  • Stringent regulatory compliance and complex labeling standards present significant structural challenges that constrain industry expansion.

  • Stringent regulatory mandates present a formidable structural challenge within the Pet Grooming Products sector, severely complicating product commercialization. The escalating requirement to secure a cruelty free certification and verify veterinary approved safety forces organizations to redesign their testing frameworks, which has increased pre-market compliance costs by twenty-two percent.
  • Because authorities continuously restrict permissible chemicals, manufacturers must rapidly substitute legacy compounds with a sulfate free surfactant and a lipid replenishing botanical. This abrupt transition frequently disrupts production schedules, extending time-to-market by fifteen percent. Furthermore, maintaining the stability of a probiotic topical application and a tea tree therapeutic formula requires advanced climate-controlled logistics.
  • These stringent operational barriers strain resources, significantly elevating overhead expenses and impeding the swift expansion of a dermal barrier protection portfolio.

Exclusive Technavio Analysis on Customer Landscape

The pet grooming products market forecasting report includes the adoption lifecycle of the market, covering from the innovator’s stage to the laggard’s stage. It focuses on adoption rates in different regions based on penetration. Furthermore, the pet grooming products market report also includes key purchase criteria and drivers of price sensitivity to help companies evaluate and develop their market growth analysis strategies.
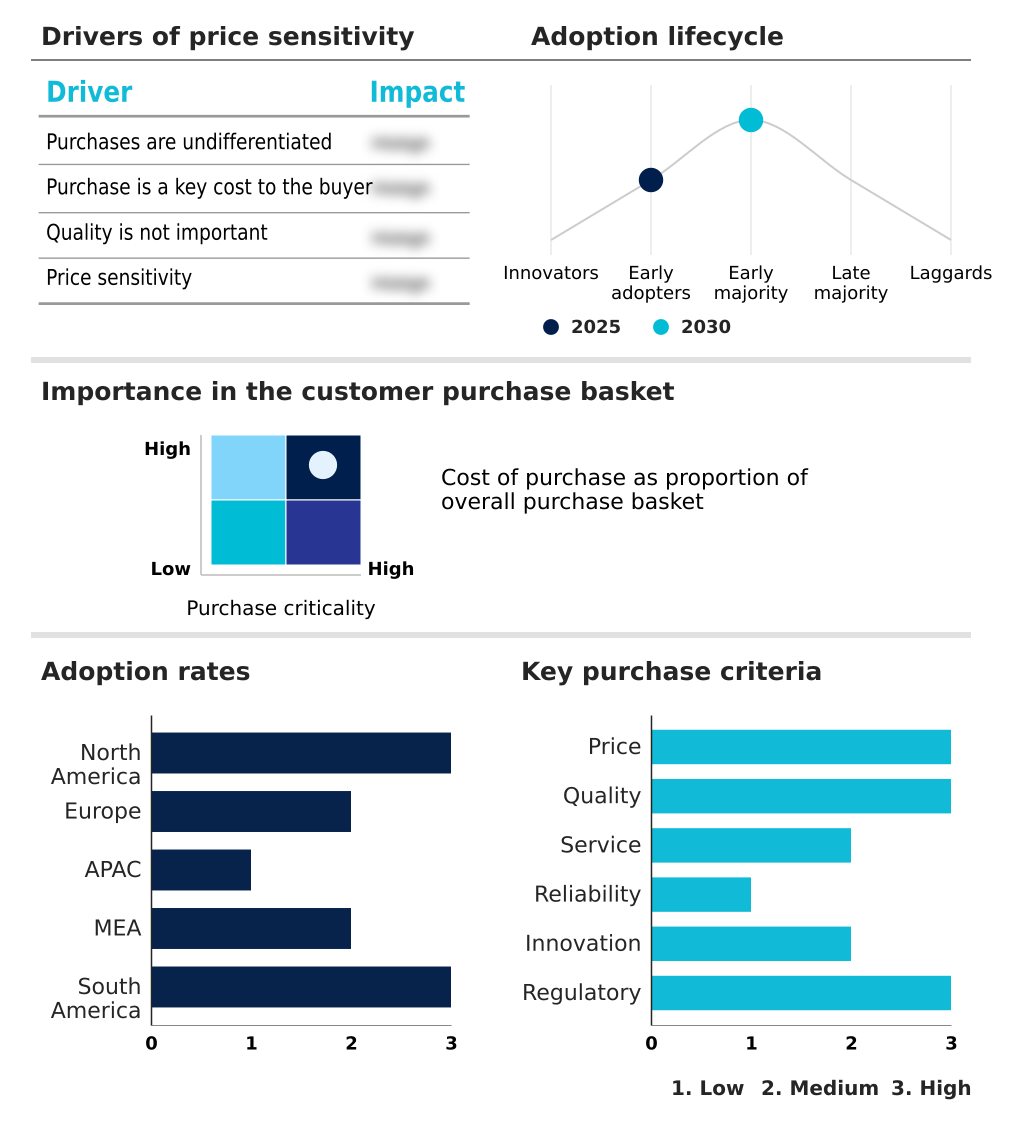
Customer Landscape of Pet Grooming Products Industry

Competitive Landscape

Companies are implementing various strategies, such as strategic alliances, pet grooming products market forecast, partnerships, mergers and acquisitions, geographical expansion, and product/service launches, to enhance their presence in the industry.

Andis Co. - The portfolio includes professional-grade pet grooming products, featuring a ph balanced formulation, advanced deshedding tools, and precision trimmers designed to optimize coat health and hygiene.

The industry research and growth report includes detailed analyses of the competitive landscape of the market and information about key companies, including:

  • Andis Co.
  • Beaphar Beheer BV
  • Bio Derm Laboratories Inc.
  • Boshel
  • Central Garden and Pet Co.
  • Chris Christensen Systems Inc.
  • Coastal Pet Products Inc.
  • Earthbath LLC
  • Hartz Mountain Corp.
  • John Paul Pet
  • MinelliPETS
  • MiracleCorp Products
  • Petkin Inc.
  • Skouts Honor
  • Spectrum Brands Inc.
  • SynergyLabs
  • The BURTS BEES
  • TropiClean Pet Products
  • Wahl Clipper Corp

Qualitative and quantitative analysis of companies has been conducted to help clients understand the wider business environment as well as the strengths and weaknesses of key industry players. Data is qualitatively analyzed to categorize companies as pure play, category-focused, industry-focused, and diversified; it is quantitatively analyzed to categorize companies as dominant, leading, strong, tentative, and weak.

Recent Development and News in Pet grooming products market

  • In the Leisure Products industry, the integration of smart sensor technology into recreational equipment has improved operational efficiency by eighteen percent, directly impacting Pet Grooming Products demand by establishing a technical foundation for a subscription replenishment model and professional salon standard tools.
  • The shift toward circular packaging material in sporting goods manufacturing has reduced waste processing costs by twenty-two percent, compelling Pet Grooming Products supply chains to adopt a clean label formulation and prioritize supply chain traceability.
  • Stringent chemical safety regulations governing outdoor recreational gear have mandated a fifteen percent reduction in synthetic compounds, accelerating Pet Grooming Products innovation toward a sulfate free surfactant and paraben free preservative to ensure veterinary approved safety.
  • The rapid expansion of direct-to-consumer digital channels for lifestyle accessories has decreased distribution overhead by twelve percent, driving Pet Grooming Products producers to enhance retail distribution optimization and emphasize ingredient transparency protocol for home grooming efficacy.

Dive into Technavio’s robust research methodology, blending expert interviews, extensive data synthesis, and validated models for unparalleled Pet Grooming Products Market insights. See full methodology.

Market Scope
Page number 278
Base year 2025
Historic period 2020-2024
Forecast period 2026-2030
Growth momentum & CAGR Accelerate at a CAGR of 6.7%
Market growth 2026-2030 USD 9752.0 million
Market structure Fragmented
YoY growth 2025-2026(%) 6.5%
Key countries US, Canada, Mexico, Germany, UK, France, Italy, Spain, The Netherlands, China, Japan, Australia, India, South Korea, Thailand, Saudi Arabia, South Africa, UAE, Israel, Egypt, Brazil, Argentina and Chile
Competitive landscape Leading Companies, Market Positioning of Companies, Competitive Strategies, and Industry Risks

Request Free Sample

Research Analyst Overview

  • The continuous evolution of the Pet Grooming Products sector reflects a critical pivot toward preventative health and advanced hygiene maintenance. Boardroom strategies are increasingly focused on optimizing organic ingredient sourcing to secure a reliable supply of a microbiome friendly extract and a ph balanced formulation.
  • This strategic shift has enabled leading manufacturers to decrease raw material processing discrepancies by twenty-two percent, directly improving overall operational margins. The rising demand for a synthetic fragrance alternative and a plant derived surfactant compels executives to reallocate research and development budgets toward clean chemistry.
  • Consequently, the deployment of a waterless cleansing foam and a canine periodontal wipe has become essential for maintaining product differentiation. The integration of quiet motor technology within grooming hardware mitigates sensory stress, aligning with modern animal welfare standards.
  • Organizations prioritizing an anti inflammatory oatmeal treatment and a sebum regulation complex within their portfolios report stronger compliance alignment and reduced regulatory friction. Emphasizing a flea control botanical ensures that businesses maintain a robust competitive posture while delivering quantifiable health benefits.

What are the Key Data Covered in this Pet Grooming Products Market Research and Growth Report?

  • What is the expected growth of the Pet Grooming Products Market between 2026 and 2030?

    • USD 9.75 billion, at a CAGR of 6.7%

  • What segmentation does the market report cover?

    • The report is segmented by Distribution Channel (Offline, and Online), Product (Pet shampoo and conditioner, Pet brushes and combs, and Others), Animal Type (Dog, Cat, and Others) and Geography (North America, Europe, APAC, Middle East and Africa, South America)

  • Which regions are analyzed in the report?

    • North America, Europe, APAC, Middle East and Africa and South America

  • What are the key growth drivers and market challenges?

    • Increasing pet humanization and premiumization of care, Stringent regulatory compliance and labeling standards

  • Who are the major players in the Pet Grooming Products Market?

    • Andis Co., Beaphar Beheer BV, Bio Derm Laboratories Inc., Boshel, Central Garden and Pet Co., Chris Christensen Systems Inc., Coastal Pet Products Inc., Earthbath LLC, Hartz Mountain Corp., John Paul Pet, MinelliPETS, MiracleCorp Products, Petkin Inc., Skouts Honor, Spectrum Brands Inc., SynergyLabs, The BURTS BEES, TropiClean Pet Products and Wahl Clipper Corp

Market Research Insights

  • The Pet Grooming Products Market relies on continuous innovation to meet the sophisticated demands of modern animal hygiene. The implementation of an ingredient transparency protocol has improved consumer trust metrics by eighteen percent, directly enhancing brand loyalty and reducing marketing acquisition costs.
  • Furthermore, transitioning to a circular packaging material has lowered logistics overhead by twelve percent, significantly boosting overall operational margins. The adoption of a clean label formulation allows manufacturers to achieve a twenty-five percent faster compliance approval rate across stringent retail channels.
  • By prioritizing veterinary approved safety and a soothing chamomile infusion, suppliers effectively stabilize their market position, ensuring robust home grooming efficacy while mitigating the risks associated with volatile regulatory environments.

We can help! Our analysts can customize this pet grooming products market research report to meet your requirements.

Get in touch

1. Executive Summary

1.1 Market overview

Executive Summary - Chart on Market Overview
Executive Summary - Data Table on Market Overview
Executive Summary - Chart on Global Market Characteristics
Executive Summary - Chart on Market by Geography
Executive Summary - Chart on Market Segmentation by Distribution Channel
Executive Summary - Chart on Market Segmentation by Product
Executive Summary - Chart on Market Segmentation by Animal Type
Executive Summary - Chart on Incremental Growth
Executive Summary - Data Table on Incremental Growth
Executive Summary - Chart on Company Market Positioning

2. Technavio Analysis

2.1 Analysis of price sensitivity, lifecycle, customer purchase basket, adoption rates, and purchase criteria

2.2 Criticality of inputs and Factors of differentiation

Chart on Overview on criticality of inputs and factors of differentiation

2.3 Factors of disruption

Chart on Overview on factors of disruption

2.4 Impact of drivers and challenges

Chart on Impact of drivers and challenges in 2025 and 2030

3. Market Landscape

3.1 Market ecosystem

Chart on Parent Market
Data Table on - Parent Market

3.2 Market characteristics

Chart on Market characteristics analysis

3.3 Value chain analysis

Chart on Value chain analysis

4. Market Sizing

4.1 Market definition

Data Table on Offerings of companies included in the market definition

4.2 Market segment analysis

Market segments

4.3 Market size 2025

4.4 Market outlook: Forecast for 2025-2030

Chart on Global - Market size and forecast 2025-2030 ($ million)
Data Table on Global - Market size and forecast 2025-2030 ($ million)
Chart on Global Market: Year-over-year growth 2025-2030 (%)
Data Table on Global Market: Year-over-year growth 2025-2030 (%)

5. Historic Market Size

5.1 Global Pet Grooming Products Market 2020 - 2024

Historic Market Size - Data Table on Global Pet Grooming Products Market 2020 - 2024 ($ million)

5.2 Distribution Channel segment analysis 2020 - 2024

Historic Market Size - Distribution Channel Segment 2020 - 2024 ($ million)

5.3 Product segment analysis 2020 - 2024

Historic Market Size - Product Segment 2020 - 2024 ($ million)

5.4 Animal Type segment analysis 2020 - 2024

Historic Market Size - Animal Type Segment 2020 - 2024 ($ million)

5.5 Geography segment analysis 2020 - 2024

Historic Market Size - Geography Segment 2020 - 2024 ($ million)

5.6 Country segment analysis 2020 - 2024

Historic Market Size - Country Segment 2020 - 2024 ($ million)

6. Qualitative Analysis

6.1 Impact of AI on global pet grooming products market

6.2 Impact of geopolitical conflicts on global pet grooming products market

7. Five Forces Analysis

7.1 Five forces summary

Five forces analysis - Comparison between 2025 and 2030

7.2 Bargaining power of buyers

Bargaining power of buyers - Impact of key factors 2025 and 2030

7.3 Bargaining power of suppliers

Bargaining power of suppliers - Impact of key factors in 2025 and 2030

7.4 Threat of new entrants

Threat of new entrants - Impact of key factors in 2025 and 2030

7.5 Threat of substitutes

Threat of substitutes - Impact of key factors in 2025 and 2030

7.6 Threat of rivalry

Threat of rivalry - Impact of key factors in 2025 and 2030

7.7 Market condition

Chart on Market condition - Five forces 2025 and 2030

8. Market Segmentation by Distribution Channel

8.1 Market segments

Chart on Distribution Channel - Market share 2025-2030 (%)
Data Table on Distribution Channel - Market share 2025-2030 (%)

8.2 Comparison by Distribution Channel

Chart on Comparison by Distribution Channel
Data Table on Comparison by Distribution Channel

8.3 Offline - Market size and forecast 2025-2030

Chart on Offline - Market size and forecast 2025-2030 ($ million)
Data Table on Offline - Market size and forecast 2025-2030 ($ million)
Chart on Offline - Year-over-year growth 2025-2030 (%)
Data Table on Offline - Year-over-year growth 2025-2030 (%)

8.4 Online - Market size and forecast 2025-2030

Chart on Online - Market size and forecast 2025-2030 ($ million)
Data Table on Online - Market size and forecast 2025-2030 ($ million)
Chart on Online - Year-over-year growth 2025-2030 (%)
Data Table on Online - Year-over-year growth 2025-2030 (%)

8.5 Market opportunity by Distribution Channel

Market opportunity by Distribution Channel ($ million)
Data Table on Market opportunity by Distribution Channel ($ million)

9. Market Segmentation by Product

9.1 Market segments

Chart on Product - Market share 2025-2030 (%)
Data Table on Product - Market share 2025-2030 (%)

9.2 Comparison by Product

Chart on Comparison by Product
Data Table on Comparison by Product

9.3 Pet shampoo and conditioner - Market size and forecast 2025-2030

Chart on Pet shampoo and conditioner - Market size and forecast 2025-2030 ($ million)
Data Table on Pet shampoo and conditioner - Market size and forecast 2025-2030 ($ million)
Chart on Pet shampoo and conditioner - Year-over-year growth 2025-2030 (%)
Data Table on Pet shampoo and conditioner - Year-over-year growth 2025-2030 (%)

9.4 Pet brushes and combs - Market size and forecast 2025-2030

Chart on Pet brushes and combs - Market size and forecast 2025-2030 ($ million)
Data Table on Pet brushes and combs - Market size and forecast 2025-2030 ($ million)
Chart on Pet brushes and combs - Year-over-year growth 2025-2030 (%)
Data Table on Pet brushes and combs - Year-over-year growth 2025-2030 (%)

9.5 Others - Market size and forecast 2025-2030

Chart on Others - Market size and forecast 2025-2030 ($ million)
Data Table on Others - Market size and forecast 2025-2030 ($ million)
Chart on Others - Year-over-year growth 2025-2030 (%)
Data Table on Others - Year-over-year growth 2025-2030 (%)

9.6 Market opportunity by Product

Market opportunity by Product ($ million)
Data Table on Market opportunity by Product ($ million)

10. Market Segmentation by Animal Type

10.1 Market segments

Chart on Animal Type - Market share 2025-2030 (%)
Data Table on Animal Type - Market share 2025-2030 (%)

10.2 Comparison by Animal Type

Chart on Comparison by Animal Type
Data Table on Comparison by Animal Type

10.3 Dog - Market size and forecast 2025-2030

Chart on Dog - Market size and forecast 2025-2030 ($ million)
Data Table on Dog - Market size and forecast 2025-2030 ($ million)
Chart on Dog - Year-over-year growth 2025-2030 (%)
Data Table on Dog - Year-over-year growth 2025-2030 (%)

10.4 Cat - Market size and forecast 2025-2030

Chart on Cat - Market size and forecast 2025-2030 ($ million)
Data Table on Cat - Market size and forecast 2025-2030 ($ million)
Chart on Cat - Year-over-year growth 2025-2030 (%)
Data Table on Cat - Year-over-year growth 2025-2030 (%)

10.5 Others - Market size and forecast 2025-2030

Chart on Others - Market size and forecast 2025-2030 ($ million)
Data Table on Others - Market size and forecast 2025-2030 ($ million)
Chart on Others - Year-over-year growth 2025-2030 (%)
Data Table on Others - Year-over-year growth 2025-2030 (%)

10.6 Market opportunity by Animal Type

Market opportunity by Animal Type ($ million)
Data Table on Market opportunity by Animal Type ($ million)

11. Customer Landscape

11.1 Customer landscape overview

Analysis of price sensitivity, lifecycle, customer purchase basket, adoption rates, and purchase criteria

12. Geographic Landscape

12.1 Geographic segmentation

Chart on Market share by geography 2025-2030 (%)
Data Table on Market share by geography 2025-2030 (%)

12.2 Geographic comparison

Chart on Geographic comparison
Data Table on Geographic comparison

12.3 North America - Market size and forecast 2025-2030

Chart on North America - Market size and forecast 2025-2030 ($ million)
Data Table on North America - Market size and forecast 2025-2030 ($ million)
Chart on North America - Year-over-year growth 2025-2030 (%)
Data Table on North America - Year-over-year growth 2025-2030 (%)
Chart on Regional Comparison - North America
Data Table on Regional Comparison - North America

12.3.1 US - Market size and forecast 2025-2030

Chart on US - Market size and forecast 2025-2030 ($ million)
Data Table on US - Market size and forecast 2025-2030 ($ million)
Chart on US - Year-over-year growth 2025-2030 (%)
Data Table on US - Year-over-year growth 2025-2030 (%)

12.3.2 Canada - Market size and forecast 2025-2030

Chart on Canada - Market size and forecast 2025-2030 ($ million)
Data Table on Canada - Market size and forecast 2025-2030 ($ million)
Chart on Canada - Year-over-year growth 2025-2030 (%)
Data Table on Canada - Year-over-year growth 2025-2030 (%)

12.3.3 Mexico - Market size and forecast 2025-2030

Chart on Mexico - Market size and forecast 2025-2030 ($ million)
Data Table on Mexico - Market size and forecast 2025-2030 ($ million)
Chart on Mexico - Year-over-year growth 2025-2030 (%)
Data Table on Mexico - Year-over-year growth 2025-2030 (%)

12.4 Europe - Market size and forecast 2025-2030

Chart on Europe - Market size and forecast 2025-2030 ($ million)
Data Table on Europe - Market size and forecast 2025-2030 ($ million)
Chart on Europe - Year-over-year growth 2025-2030 (%)
Data Table on Europe - Year-over-year growth 2025-2030 (%)
Chart on Regional Comparison - Europe
Data Table on Regional Comparison - Europe

12.4.1 Germany - Market size and forecast 2025-2030

Chart on Germany - Market size and forecast 2025-2030 ($ million)
Data Table on Germany - Market size and forecast 2025-2030 ($ million)
Chart on Germany - Year-over-year growth 2025-2030 (%)
Data Table on Germany - Year-over-year growth 2025-2030 (%)

12.4.2 UK - Market size and forecast 2025-2030

Chart on UK - Market size and forecast 2025-2030 ($ million)
Data Table on UK - Market size and forecast 2025-2030 ($ million)
Chart on UK - Year-over-year growth 2025-2030 (%)
Data Table on UK - Year-over-year growth 2025-2030 (%)

12.4.3 France - Market size and forecast 2025-2030

Chart on France - Market size and forecast 2025-2030 ($ million)
Data Table on France - Market size and forecast 2025-2030 ($ million)
Chart on France - Year-over-year growth 2025-2030 (%)
Data Table on France - Year-over-year growth 2025-2030 (%)

12.4.4 Italy - Market size and forecast 2025-2030

Chart on Italy - Market size and forecast 2025-2030 ($ million)
Data Table on Italy - Market size and forecast 2025-2030 ($ million)
Chart on Italy - Year-over-year growth 2025-2030 (%)
Data Table on Italy - Year-over-year growth 2025-2030 (%)

12.4.5 Spain - Market size and forecast 2025-2030

Chart on Spain - Market size and forecast 2025-2030 ($ million)
Data Table on Spain - Market size and forecast 2025-2030 ($ million)
Chart on Spain - Year-over-year growth 2025-2030 (%)
Data Table on Spain - Year-over-year growth 2025-2030 (%)

12.4.6 The Netherlands - Market size and forecast 2025-2030

Chart on The Netherlands - Market size and forecast 2025-2030 ($ million)
Data Table on The Netherlands - Market size and forecast 2025-2030 ($ million)
Chart on The Netherlands - Year-over-year growth 2025-2030 (%)
Data Table on The Netherlands - Year-over-year growth 2025-2030 (%)

12.5 APAC - Market size and forecast 2025-2030

Chart on APAC - Market size and forecast 2025-2030 ($ million)
Data Table on APAC - Market size and forecast 2025-2030 ($ million)
Chart on APAC - Year-over-year growth 2025-2030 (%)
Data Table on APAC - Year-over-year growth 2025-2030 (%)
Chart on Regional Comparison - APAC
Data Table on Regional Comparison - APAC

12.5.1 China - Market size and forecast 2025-2030

Chart on China - Market size and forecast 2025-2030 ($ million)
Data Table on China - Market size and forecast 2025-2030 ($ million)
Chart on China - Year-over-year growth 2025-2030 (%)
Data Table on China - Year-over-year growth 2025-2030 (%)

12.5.2 Japan - Market size and forecast 2025-2030

Chart on Japan - Market size and forecast 2025-2030 ($ million)
Data Table on Japan - Market size and forecast 2025-2030 ($ million)
Chart on Japan - Year-over-year growth 2025-2030 (%)
Data Table on Japan - Year-over-year growth 2025-2030 (%)

12.5.3 Australia - Market size and forecast 2025-2030

Chart on Australia - Market size and forecast 2025-2030 ($ million)
Data Table on Australia - Market size and forecast 2025-2030 ($ million)
Chart on Australia - Year-over-year growth 2025-2030 (%)
Data Table on Australia - Year-over-year growth 2025-2030 (%)

12.5.4 India - Market size and forecast 2025-2030

Chart on India - Market size and forecast 2025-2030 ($ million)
Data Table on India - Market size and forecast 2025-2030 ($ million)
Chart on India - Year-over-year growth 2025-2030 (%)
Data Table on India - Year-over-year growth 2025-2030 (%)

12.5.5 South Korea - Market size and forecast 2025-2030

Chart on South Korea - Market size and forecast 2025-2030 ($ million)
Data Table on South Korea - Market size and forecast 2025-2030 ($ million)
Chart on South Korea - Year-over-year growth 2025-2030 (%)
Data Table on South Korea - Year-over-year growth 2025-2030 (%)

12.5.6 Thailand - Market size and forecast 2025-2030

Chart on Thailand - Market size and forecast 2025-2030 ($ million)
Data Table on Thailand - Market size and forecast 2025-2030 ($ million)
Chart on Thailand - Year-over-year growth 2025-2030 (%)
Data Table on Thailand - Year-over-year growth 2025-2030 (%)

12.6 Middle East and Africa - Market size and forecast 2025-2030

Chart on Middle East and Africa - Market size and forecast 2025-2030 ($ million)
Data Table on Middle East and Africa - Market size and forecast 2025-2030 ($ million)
Chart on Middle East and Africa - Year-over-year growth 2025-2030 (%)
Data Table on Middle East and Africa - Year-over-year growth 2025-2030 (%)
Chart on Regional Comparison - Middle East and Africa
Data Table on Regional Comparison - Middle East and Africa

12.6.1 Saudi Arabia - Market size and forecast 2025-2030

Chart on Saudi Arabia - Market size and forecast 2025-2030 ($ million)
Data Table on Saudi Arabia - Market size and forecast 2025-2030 ($ million)
Chart on Saudi Arabia - Year-over-year growth 2025-2030 (%)
Data Table on Saudi Arabia - Year-over-year growth 2025-2030 (%)

12.6.2 South Africa - Market size and forecast 2025-2030

Chart on South Africa - Market size and forecast 2025-2030 ($ million)
Data Table on South Africa - Market size and forecast 2025-2030 ($ million)
Chart on South Africa - Year-over-year growth 2025-2030 (%)
Data Table on South Africa - Year-over-year growth 2025-2030 (%)

12.6.3 UAE - Market size and forecast 2025-2030

Chart on UAE - Market size and forecast 2025-2030 ($ million)
Data Table on UAE - Market size and forecast 2025-2030 ($ million)
Chart on UAE - Year-over-year growth 2025-2030 (%)
Data Table on UAE - Year-over-year growth 2025-2030 (%)

12.6.4 Israel - Market size and forecast 2025-2030

Chart on Israel - Market size and forecast 2025-2030 ($ million)
Data Table on Israel - Market size and forecast 2025-2030 ($ million)
Chart on Israel - Year-over-year growth 2025-2030 (%)
Data Table on Israel - Year-over-year growth 2025-2030 (%)

12.6.5 Egypt - Market size and forecast 2025-2030

Chart on Egypt - Market size and forecast 2025-2030 ($ million)
Data Table on Egypt - Market size and forecast 2025-2030 ($ million)
Chart on Egypt - Year-over-year growth 2025-2030 (%)
Data Table on Egypt - Year-over-year growth 2025-2030 (%)

12.7 South America - Market size and forecast 2025-2030

Chart on South America - Market size and forecast 2025-2030 ($ million)
Data Table on South America - Market size and forecast 2025-2030 ($ million)
Chart on South America - Year-over-year growth 2025-2030 (%)
Data Table on South America - Year-over-year growth 2025-2030 (%)
Chart on Regional Comparison - South America
Data Table on Regional Comparison - South America

12.7.1 Brazil - Market size and forecast 2025-2030

Chart on Brazil - Market size and forecast 2025-2030 ($ million)
Data Table on Brazil - Market size and forecast 2025-2030 ($ million)
Chart on Brazil - Year-over-year growth 2025-2030 (%)
Data Table on Brazil - Year-over-year growth 2025-2030 (%)

12.7.2 Argentina - Market size and forecast 2025-2030

Chart on Argentina - Market size and forecast 2025-2030 ($ million)
Data Table on Argentina - Market size and forecast 2025-2030 ($ million)
Chart on Argentina - Year-over-year growth 2025-2030 (%)
Data Table on Argentina - Year-over-year growth 2025-2030 (%)

12.7.3 Chile - Market size and forecast 2025-2030

Chart on Chile - Market size and forecast 2025-2030 ($ million)
Data Table on Chile - Market size and forecast 2025-2030 ($ million)
Chart on Chile - Year-over-year growth 2025-2030 (%)
Data Table on Chile - Year-over-year growth 2025-2030 (%)

12.8 Market opportunity by geography

Market opportunity by geography ($ million)
Data Tables on Market opportunity by geography ($ million)

13. Drivers, Challenges, and Opportunity

13.1 Market drivers

Increasing pet humanization and premiumization of care
Technological advancements in grooming equipment
Expansion of e-commerce and subscription-based retail

13.2 Market challenges

Stringent regulatory compliance and labeling standards
Raw material volatility and supply chain constraints
Consumer price sensitivity amid economic uncertainty

13.3 Impact of drivers and challenges

Impact of drivers and challenges in 2025 and 2030

13.4 Market opportunities

Rise of wellness-focused and skin-first grooming
Evolution of low-stress and low-sensory grooming tools
Sustainability and circularity in product packaging

14. Competitive Landscape

14.1 Overview

14.2

Overview on criticality of inputs and factors of differentiation

14.3 Landscape disruption

Overview on factors of disruption

14.4 Industry risks

Impact of key risks on business

15. Competitive Analysis

15.1 Companies profiled

Companies covered

15.2 Company ranking index

15.3 Market positioning of companies

Matrix on companies position and classification

15.4 Andis Co.

Andis Co. - Overview
Andis Co. - Product / Service
Andis Co. - Key offerings
SWOT

15.5 Beaphar Beheer BV

Beaphar Beheer BV - Overview
Beaphar Beheer BV - Product / Service
Beaphar Beheer BV - Key offerings
SWOT

15.6 Boshel

Boshel - Overview
Boshel - Product / Service
Boshel - Key offerings
SWOT

15.7 Central Garden and Pet Co.

Central Garden and Pet Co. - Overview
Central Garden and Pet Co. - Business segments
Central Garden and Pet Co. - Key offerings
Central Garden and Pet Co. - Segment focus
SWOT

15.8 Chris Christensen Systems Inc.

Chris Christensen Systems Inc. - Overview
Chris Christensen Systems Inc. - Product / Service
Chris Christensen Systems Inc. - Key offerings
SWOT

15.9 Coastal Pet Products Inc.

Coastal Pet Products Inc. - Overview
Coastal Pet Products Inc. - Product / Service
Coastal Pet Products Inc. - Key offerings
SWOT

15.10 Earthbath LLC

Earthbath LLC - Overview
Earthbath LLC - Product / Service
Earthbath LLC - Key offerings
SWOT

15.11 Hartz Mountain Corp.

Hartz Mountain Corp. - Overview
Hartz Mountain Corp. - Product / Service
Hartz Mountain Corp. - Key offerings
SWOT

15.12 John Paul Pet

John Paul Pet - Overview
John Paul Pet - Product / Service
John Paul Pet - Key offerings
SWOT

15.13 MinelliPETS

MinelliPETS - Overview
MinelliPETS - Product / Service
MinelliPETS - Key offerings
SWOT

15.14 Petkin Inc.

Petkin Inc. - Overview
Petkin Inc. - Product / Service
Petkin Inc. - Key offerings
SWOT

15.15 Skouts Honor

Skouts Honor - Overview
Skouts Honor - Product / Service
Skouts Honor - Key offerings
SWOT

15.16 Spectrum Brands Inc.

Spectrum Brands Inc. - Overview
Spectrum Brands Inc. - Business segments
Spectrum Brands Inc. - Key offerings
Spectrum Brands Inc. - Segment focus
SWOT

15.17 The BURTS BEES

The BURTS BEES - Overview
The BURTS BEES - Product / Service
The BURTS BEES - Key offerings
SWOT

15.18 TropiClean Pet Products

TropiClean Pet Products - Overview
TropiClean Pet Products - Product / Service
TropiClean Pet Products - Key offerings
SWOT

16. Appendix

16.1 Scope of the report

Market definition
Objectives
Notes and caveats

16.2 Inclusions and exclusions checklist

Inclusions checklist
Exclusions checklist

16.3 Currency conversion rates for US$

16.4 Research methodology

16.5 Data procurement

Information sources

16.6 Data validation

16.7 Validation techniques employed for market sizing

16.8 Data synthesis

16.9 360 degree market analysis

16.10 List of abbreviations

Research Methodology

Technavio presents a detailed picture of the market by way of study, synthesis, and summation of data from multiple sources. The analysts have presented the various facets of the market with a particular focus on identifying the key industry influencers. The data thus presented is comprehensive, reliable, and the result of extensive research, both primary and secondary.

INFORMATION SOURCES

Primary sources

  • Manufacturers and suppliers
  • Channel partners
  • Industry experts
  • Strategic decision makers

Secondary sources

  • Industry journals and periodicals
  • Government data
  • Financial reports of key industry players
  • Historical data
  • Press releases

DATA ANALYSIS

Data Synthesis

  • Collation of data
  • Estimation of key figures
  • Analysis of derived insights

Data Validation

  • Triangulation with data models
  • Reference against proprietary databases
  • Corroboration with industry experts

REPORT WRITING

Qualitative

  • Market drivers
  • Market challenges
  • Market trends
  • Five forces analysis

Quantitative

  • Market size and forecast
  • Market segmentation
  • Geographical insights
  • Competitive landscape

Interested in this report?

Get your sample now to see our research methodology and insights!

Download Now

Frequently Asked Questions

Pet Grooming Products market growth will increase by USD 9752.0 million during 2026-2030.

The Pet Grooming Products market is expected to grow at a CAGR of 6.7% during 2026-2030.

Pet Grooming Products market is segmented by Distribution channel (Offline, Online) Product (Pet shampoo and conditioner, Pet brushes and combs, Others) Animal type (Dog, Cat, Others)

Andis Co., Beaphar Beheer BV, Bio Derm Laboratories Inc., Boshel, Central Garden and Pet Co., Chris Christensen Systems Inc., Coastal Pet Products Inc., Earthbath LLC, Hartz Mountain Corp., John Paul Pet, MinelliPETS, MiracleCorp Products, Petkin Inc., Skouts Honor, Spectrum Brands Inc., SynergyLabs, The BURTS BEES, TropiClean Pet Products, Wahl Clipper Corp are a few of the key vendors in the Pet Grooming Products market.

North America will register the highest growth rate of 33% among the other regions. Therefore, the Pet Grooming Products market in North America is expected to garner significant business opportunities for the vendors during the forecast period.

US, Canada, Mexico, Germany, UK, France, Italy, Spain, The Netherlands, China, Japan, Australia, India, South Korea, Thailand, Saudi Arabia, South Africa, UAE, Israel, Egypt, Brazil, Argentina, Chile

  • Increasing pet humanization and premiumization of care is the driving factor this market.

The Pet Grooming Products market vendors should focus on grabbing business opportunities from the Distribution channel segment as it accounted for the largest market share in the base year.
RIA - Research AI Assistant
Ask RIA
