Pet Tech And Wellness Products Market Analysis, Size, and Forecast 2026-2030: North America (US, Canada, and Mexico), Europe (UK, Germany, and France), APAC (China, Japan, and India), South America (Brazil, Argentina, and Colombia), Middle East and Africa (Saudi Arabia, South Africa, and UAE), and Rest of World (ROW)

Pet Tech And Wellness Products Market Analysis, Size, and Forecast 2026-2030:
North America (US, Canada, and Mexico), Europe (UK, Germany, and France), APAC (China, Japan, and India), South America (Brazil, Argentina, and Colombia), Middle East and Africa (Saudi Arabia, South Africa, and UAE), and Rest of World (ROW)

Published: Mar 2026 292 Pages SKU: IRTNTR81362

Market Overview at a Glance

$31.92 B
Market Opportunity
8.8%
CAGR 2025 - 2030
33.7%
North America Growth
$48.53 B
Pet wellness products segment 2024

Pet Tech And Wellness Products Market Size 2026-2030

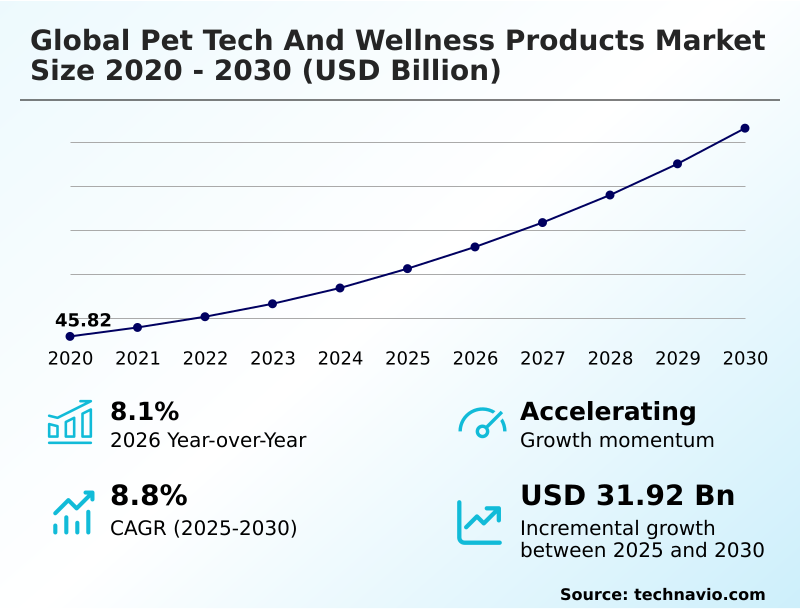
The pet tech and wellness products market size is valued to increase by USD 31.92 billion, at a CAGR of 8.8% from 2025 to 2030. Increasing humanization of companion animals will drive the pet tech and wellness products market.

Major Market Trends & Insights

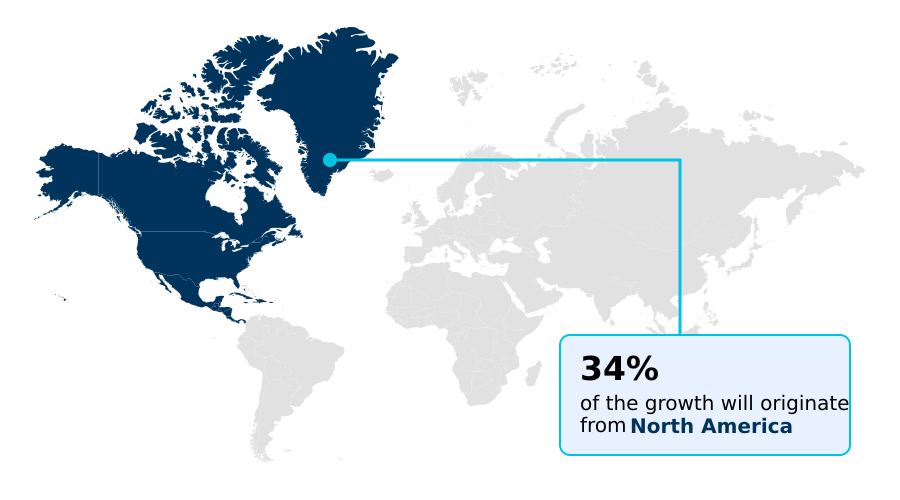
  • North America dominated the market and accounted for a 33.7% growth during the forecast period.
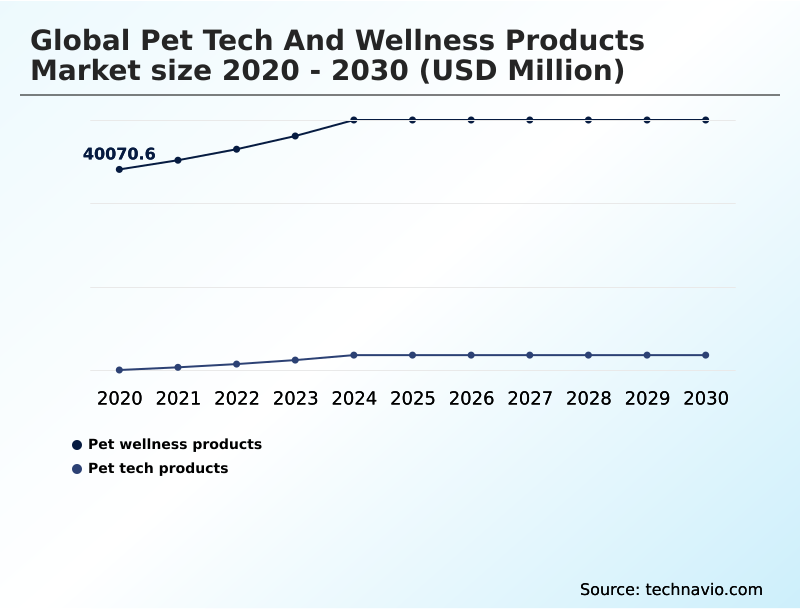
  • By Product Type - Pet wellness products segment was valued at USD 48.53 billion in 2024
  • By End-user - Dogs segment accounted for the largest market revenue share in 2024

Market Size & Forecast

  • Market Opportunities: USD 47.32 billion
  • Market Future Opportunities: USD 31.92 billion
  • CAGR from 2025 to 2030 : 8.8%

Market Summary

  • The pet tech and wellness products market is defined by a significant transition toward proactive, technology-driven care, fueled by the humanization of pets. This shift has created robust demand for sophisticated solutions like wearable health trackers that provide real-time biometric monitoring and smart pet cameras for remote interaction.
  • Innovations in personalized nutrition plans, often developed using microbiome analysis and delivered via subscription-based models, are becoming standard. A key business application involves leveraging bioinformatic databases to refine these dietary offerings, enhancing efficacy and improving pet health outcomes, which directly boosts customer retention.
  • However, the industry grapples with challenges related to data privacy vulnerabilities inherent in connected devices and the high cost of advanced hardware, which can limit broader market penetration. The continuous evolution is toward creating integrated ecosystems where automated feeders and smart collars work in unison, reflecting a holistic approach to animal well-being and management within modern households.

What will be the Size of the Pet Tech And Wellness Products Market during the forecast period?

Get Key Insights on Market Forecast (PDF) Request Free Sample

How is the Pet Tech And Wellness Products Market Segmented?

The pet tech and wellness products industry research report provides comprehensive data (region-wise segment analysis), with forecasts and estimates in "USD million" for the period 2026-2030, as well as historical data from 2020-2024 for the following segments.

  • Product type
    • Pet wellness products
    • Pet tech products
  • End-user
    • Dogs
    • Cats
    • Others
  • Distribution channel
    • Offline
    • Online
  • Geography
    • North America
      • US
      • Canada
      • Mexico
    • Europe
      • UK
      • Germany
      • France
    • APAC
      • China
      • Japan
      • India
    • South America
      • Brazil
      • Argentina
      • Colombia
    • Middle East and Africa
      • Saudi Arabia
      • South Africa
      • UAE
    • Rest of World (ROW)

By Product Type Insights

The pet wellness products segment is estimated to witness significant growth during the forecast period.

The pet wellness products segment is foundational to the pet tech and wellness products market, expanding beyond basic nutrition to include a spectrum of preventative health solutions.

This subcategory, which accounts for a substantial 8.1% year-over-year growth in consumer spending, includes specialized dietary formulations, cannabidiol extracts, and advanced dental care items.

Consumers are increasingly investing in products for holistic optimization, driving demand for supplements targeting joint health and cognitive function through bioinformatic databases.

The move toward proactive health management is evident in the adoption of items promoting psychological well-being, such as natural calming agents.

This trend underscores a sophisticated consumer base that prioritizes scientific efficacy, safety, and supply chain dynamics in their purchasing decisions, solidifying the segment's importance in the overall market architecture.

Request Free Sample

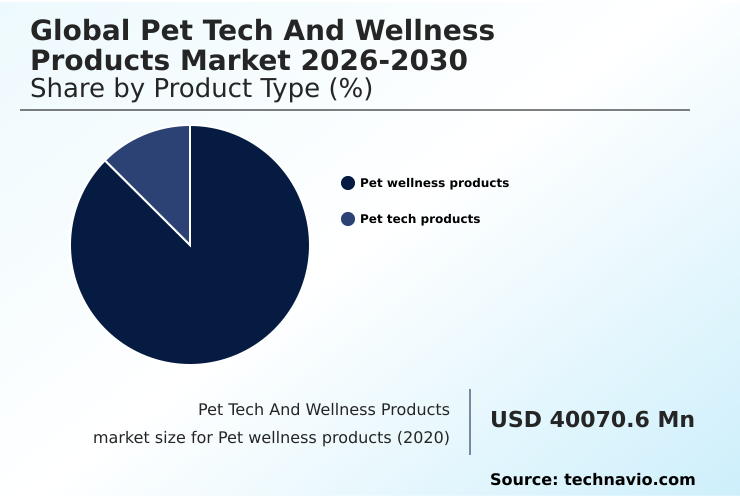
The Pet wellness products segment was valued at USD 48.53 billion in 2024 and showed a gradual increase during the forecast period.

Request Free Sample

Regional Analysis

North America is estimated to contribute 33.7% to the growth of the global market during the forecast period.Technavio’s analysts have elaborately explained the regional trends and drivers that shape the market during the forecast period.

See How Pet Tech And Wellness Products Market Demand is Rising in North America Request Free Sample

The global landscape for pet tech and wellness products is characterized by diverse regional dynamics and adoption rates.

North America, contributing 33.7% of the market's incremental growth, remains a dominant force, driven by high disposable incomes and a culture of companion animal ownership.

The APAC region is the fastest-growing, with a growth indicator of 10.1, fueled by rapid urbanization and a burgeoning middle class in countries like China and South Korea.

In Europe, stringent regulations such as the General Data Protection Regulation heavily influence the design of smart wearables and connected applications.

Across all regions, the expansion of e-commerce platforms is a critical enabler, providing consumers with access to a wide array of products, from virtual animal care to smart aviaries, thereby accelerating market penetration and innovation globally.

Market Dynamics

Our researchers analyzed the data with 2025 as the base year, along with the key drivers, trends, and challenges. A holistic analysis of drivers will help companies refine their marketing strategies to gain a competitive advantage.

  • The evolution of the pet tech and wellness products market is profoundly shaped by the market impact of pet humanization trend, which has elevated consumer expectations for care. This shift fuels the demand for advanced solutions like an AI-powered smart dog collar for health tracking and subscription-based personalized pet nutrition, transforming discretionary spending into essential household investments.
  • The integration of pet tech into smart home networks provides significant convenience, with systems capable of reducing manual care tasks by over 30%, a notable operational efficiency. However, this connectivity introduces complex challenges, including significant cybersecurity risks in connected pet devices and widespread interoperability challenges in pet tech ecosystems.
  • The cost-benefit analysis of automated pet feeders and the tangible benefits of automated self-cleaning litter boxes are now common considerations for consumers. As the market matures, the focus on preventative care intensifies, leveraging AI for early disease detection in cats and genomic testing for breed-specific pet wellness.
  • Concurrently, consumer demand for sustainable pet wellness products is pressuring manufacturers to adopt biodegradable materials in pet product manufacturing, reflecting a holistic view of well-being that includes environmental health. The effectiveness of calming supplements for pet anxiety and ensuring GPS tracking accuracy for off-leash dogs remain key areas of product refinement and innovation.

What are the key market drivers leading to the rise in the adoption of Pet Tech And Wellness Products Industry?

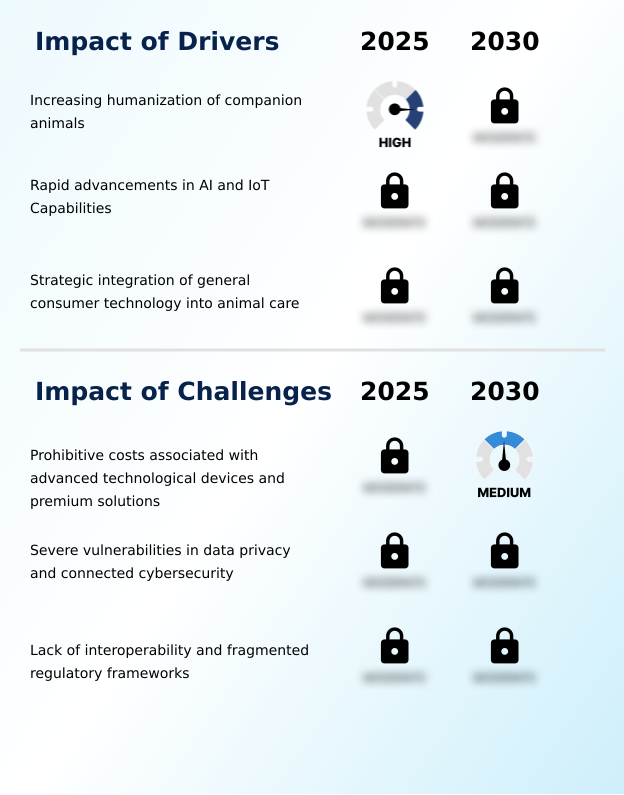
  • The increasing humanization of companion animals is a key driver for the market's growth, altering consumer spending toward premium care.

  • The primary driver of the pet tech and wellness products market is the humanization of pets, which has fundamentally altered consumer spending habits and fostered a demand for preventative healthcare.
  • This cultural shift is amplified by technological advancements, particularly the integration of AI and IoT into devices that enable biometric monitoring and proactive health management.
  • The inclusion of AI-powered alerts in monitoring systems has been shown to reduce owner response times to potential health incidents by up to 50%.
  • Furthermore, the entry of major technology firms extending their smart home architectures to include pet care has accelerated adoption, with integrated systems increasing overall ecosystem engagement by 25%.
  • This synergy between emotional connection and technological capability ensures sustained market expansion and continuous innovation in holistic optimization.

What are the market trends shaping the Pet Tech And Wellness Products Industry?

  • The proliferation of sustainable and eco-friendly wellness solutions is a significant upcoming trend. This shift reflects growing consumer demand for environmental responsibility in pet care products.

  • Key trends are reshaping the pet tech and wellness products market, with a strong emphasis on sustainability and advanced healthcare access. The push for ethical manufacturing is driving the adoption of circular economy principles, with some brands seeing customer retention improve by 15% after launching take-back programs.
  • The expansion of telehealth platforms, enhanced by diagnostic peripherals, is making specialized veterinary care more accessible; initial data shows these tools can increase the accuracy of remote diagnoses by over 30%. Concurrently, the market for personalized, data-driven wellness is growing, supported by subscription-based models that offer convenience and ensure recurring revenue.
  • This move toward hyper-personalized care, informed by deep data analytics, is setting new standards for proactive health management in companion animals and redefining long-term brand loyalty.

What challenges does the Pet Tech And Wellness Products Industry face during its growth?

  • The prohibitive costs associated with advanced technological devices and premium solutions present a key challenge to widespread market adoption and growth.

  • Despite strong growth drivers, the pet tech and wellness products market faces significant challenges that hinder mass adoption. The high cost of advanced hardware and subscription-based services creates a barrier for many consumers. Moreover, the industry is grappling with severe data privacy vulnerabilities and the need for robust cybersecurity protocols, as connected devices collect sensitive household information.
  • The lack of interoperability is another major issue, with proprietary digital ecosystems creating a fragmented user experience; studies show that this fragmentation can lead to a 30% decline in user satisfaction. The absence of clear clinical validation and regulatory ambiguity for many diagnostic devices also creates skepticism among veterinary professionals, limiting their integration into formal healthcare protocols.

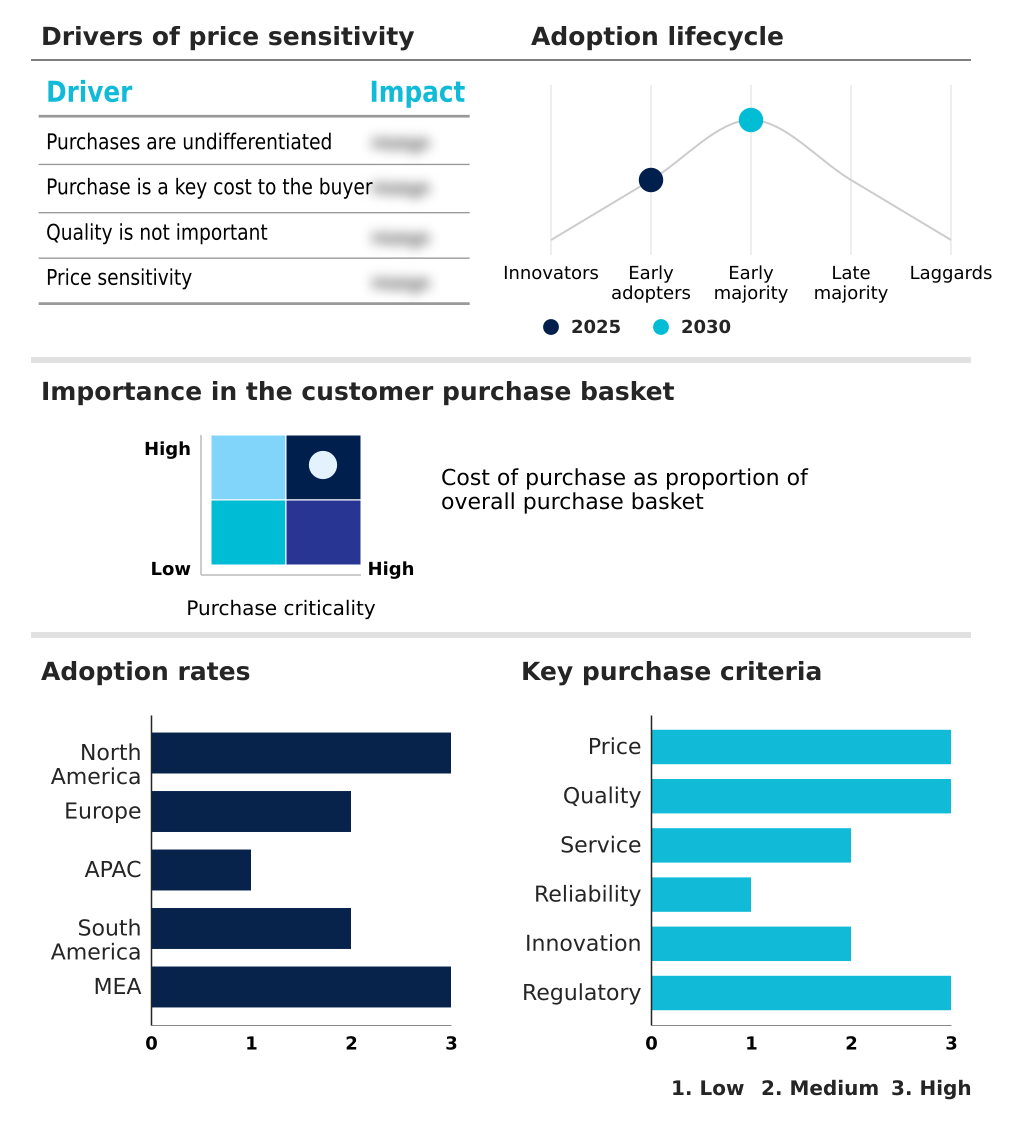
Exclusive Technavio Analysis on Customer Landscape

The pet tech and wellness products market forecasting report includes the adoption lifecycle of the market, covering from the innovator’s stage to the laggard’s stage. It focuses on adoption rates in different regions based on penetration. Furthermore, the pet tech and wellness products market report also includes key purchase criteria and drivers of price sensitivity to help companies evaluate and develop their market growth analysis strategies.

Customer Landscape of Pet Tech And Wellness Products Industry

Competitive Landscape

Companies are implementing various strategies, such as strategic alliances, pet tech and wellness products market forecast, partnerships, mergers and acquisitions, geographical expansion, and product/service launches, to enhance their presence in the industry.

Central Garden and Pet Co. - Analysis centers on a vendor providing a diverse portfolio of pet supplies, toys, and grooming products, highlighting broad market accessibility and consumer staple goods.

The industry research and growth report includes detailed analyses of the competitive landscape of the market and information about key companies, including:

  • Central Garden and Pet Co.
  • FitBark Inc.
  • Furbo
  • Garmin Ltd.
  • Hills Pet Nutrition Inc.
  • Merck and Co. Inc.
  • Nestle SA
  • NOW Health Group Inc.
  • Nutramax Laboratories Inc.
  • Petcube Inc.
  • PetIQ LLC.
  • PETKIT Ltd.
  • Radio Systems Corp
  • Tractive GmbH
  • Vetster Inc.
  • Virbac Group
  • Wellness Pet Co. Inc.
  • Whisker
  • Zesty Paws
  • Zoetis Inc.

Qualitative and quantitative analysis of companies has been conducted to help clients understand the wider business environment as well as the strengths and weaknesses of key industry players. Data is qualitatively analyzed to categorize companies as pure play, category-focused, industry-focused, and diversified; it is quantitatively analyzed to categorize companies as dominant, leading, strong, tentative, and weak.

Recent Development and News in Pet tech and wellness products market

  • In October 2024, Whisker unveiled its most advanced lineup of automatic litter boxes, the Litter-Robot 5 series, integrating new intelligent technologies like PetTag into its expanding smart pet ecosystem.
  • In January 2025, Wipro Consumer Care Ventures announced a strategic investment of $1 million in Goofy Tails, a Delhi-based pet food startup, marking its entry into the rapidly growing Indian pet care sector.
  • In April 2025, SATELLAI, a company specializing in AI-enabled pet technology, officially introduced the SATELLAI Collar, an advanced wearable device for both indoor and outdoor pets.
  • In May 2025, Fi introduced the Fi Series 3+ AI-powered smart dog collar, which uses AI to track a dog’s health and behavior patterns, including barking, scratching, and sleeping.

Dive into Technavio’s robust research methodology, blending expert interviews, extensive data synthesis, and validated models for unparalleled Pet Tech And Wellness Products Market insights. See full methodology.

Market Scope
Page number 292
Base year 2025
Historic period 2020-2024
Forecast period 2026-2030
Growth momentum & CAGR Accelerate at a CAGR of 8.8%
Market growth 2026-2030 USD 31917.1 million
Market structure Fragmented
YoY growth 2025-2026(%) 8.1%
Key countries US, Canada, Mexico, UK, Germany, France, Italy, Spain, The Netherlands, China, Japan, India, South Korea, Australia, Indonesia, Brazil, Argentina, Colombia, Saudi Arabia, South Africa, UAE, Turkey and Israel
Competitive landscape Leading Companies, Market Positioning of Companies, Competitive Strategies, and Industry Risks

Request Free Sample

Research Analyst Overview

  • The pet tech and wellness products market is undergoing a significant transformation, driven by the convergence of advanced technology and a cultural shift toward proactive animal care. Core to this evolution are innovations such as smart collars and automated feeders, which are becoming standard in modern households.
  • The integration of AI-powered alerts and machine learning algorithms into these systems provides unprecedented insights into animal well-being. A key boardroom-level consideration is the strategic investment in bioinformatic databases to support the development of genomic wellness programs and personalized nutrition plans. This data-centric approach, which leverages insights from wearable health trackers and smart pet cameras, is critical for differentiation.
  • Firms that successfully implement these strategies report a 25% higher customer lifetime value compared to competitors focused on conventional products. The market's trajectory is firmly set toward interconnected ecosystems where devices like automated waste management systems and electronic containment systems seamlessly communicate to create a comprehensive, data-driven approach to pet health and safety.

What are the Key Data Covered in this Pet Tech And Wellness Products Market Research and Growth Report?

  • What is the expected growth of the Pet Tech And Wellness Products Market between 2026 and 2030?

    • USD 31.92 billion, at a CAGR of 8.8%

  • What segmentation does the market report cover?

    • The report is segmented by Product Type (Pet wellness products, and Pet tech products), End-user (Dogs, Cats, and Others), Distribution Channel (Offline, and Online) and Geography (North America, Europe, APAC, South America, Middle East and Africa)

  • Which regions are analyzed in the report?

    • North America, Europe, APAC, South America and Middle East and Africa

  • What are the key growth drivers and market challenges?

    • Increasing humanization of companion animals , Prohibitive costs associated with advanced technological devices and premium solutions

  • Who are the major players in the Pet Tech And Wellness Products Market?

    • Central Garden and Pet Co., FitBark Inc., Furbo, Garmin Ltd., Hills Pet Nutrition Inc., Merck and Co. Inc., Nestle SA, NOW Health Group Inc., Nutramax Laboratories Inc., Petcube Inc., PetIQ LLC., PETKIT Ltd., Radio Systems Corp, Tractive GmbH, Vetster Inc., Virbac Group, Wellness Pet Co. Inc., Whisker, Zesty Paws and Zoetis Inc.

Market Research Insights

  • The market's momentum is sustained by strong consumer demand for data-driven wellness and proactive health management. The adoption of telehealth platforms has been shown to improve access to specialized care, contributing to a 25% increase in early-stage issue detection in some rural areas.
  • Furthermore, brands that adhere to ethical manufacturing and circular economy principles report up to a 20% higher rate of customer loyalty. This trend toward responsible consumption is reshaping supply chain dynamics. While these advancements foster growth, challenges in achieving broad interoperability across proprietary digital ecosystems persist, sometimes leading to a fragmented user experience.
  • The strategic integration of pet wellness into existing smart home architectures remains a key opportunity for seamless household management.

We can help! Our analysts can customize this pet tech and wellness products market research report to meet your requirements.

Get in touch

1. Executive Summary

1.1 Market overview

Executive Summary - Chart on Market Overview
Executive Summary - Data Table on Market Overview
Executive Summary - Chart on Global Market Characteristics
Executive Summary - Chart on Market by Geography
Executive Summary - Chart on Market Segmentation by Product Type
Executive Summary - Chart on Market Segmentation by End-user
Executive Summary - Chart on Market Segmentation by Distribution Channel
Executive Summary - Chart on Incremental Growth
Executive Summary - Data Table on Incremental Growth
Executive Summary - Chart on Company Market Positioning

2. Technavio Analysis

2.1 Analysis of price sensitivity, lifecycle, customer purchase basket, adoption rates, and purchase criteria

2.2 Criticality of inputs and Factors of differentiation

Chart on Overview on criticality of inputs and factors of differentiation

2.3 Factors of disruption

Chart on Overview on factors of disruption

2.4 Impact of drivers and challenges

Chart on Impact of drivers and challenges in 2025 and 2030

3. Market Landscape

3.1 Market ecosystem

Chart on Parent Market
Data Table on - Parent Market

3.2 Market characteristics

Chart on Market characteristics analysis

3.3 Value chain analysis

Chart on Value chain analysis

4. Market Sizing

4.1 Market definition

Data Table on Offerings of companies included in the market definition

4.2 Market segment analysis

Market segments

4.3 Market size 2025

4.4 Market outlook: Forecast for 2025-2030

Chart on Global - Market size and forecast 2025-2030 ($ million)
Data Table on Global - Market size and forecast 2025-2030 ($ million)
Chart on Global Market: Year-over-year growth 2025-2030 (%)
Data Table on Global Market: Year-over-year growth 2025-2030 (%)

5. Historic Market Size

5.1 Global Pet Tech And Wellness Products Market 2020 - 2024

Historic Market Size - Data Table on Global Pet Tech And Wellness Products Market 2020 - 2024 ($ million)

5.2 Product Type segment analysis 2020 - 2024

Historic Market Size - Product Type Segment 2020 - 2024 ($ million)

5.3 End-user segment analysis 2020 - 2024

Historic Market Size - End-user Segment 2020 - 2024 ($ million)

5.4 Distribution Channel segment analysis 2020 - 2024

Historic Market Size - Distribution Channel Segment 2020 - 2024 ($ million)

5.5 Geography segment analysis 2020 - 2024

Historic Market Size - Geography Segment 2020 - 2024 ($ million)

5.6 Country segment analysis 2020 - 2024

Historic Market Size - Country Segment 2020 - 2024 ($ million)

6. Qualitative Analysis

6.1 Impact of AI on the Global Pet Tech And Wellness Products Global Market

6.2 Impact of Geopolitical Conflicts on Global Pet Tech and Wellness Products Market

7. Five Forces Analysis

7.1 Five forces summary

Five forces analysis - Comparison between 2025 and 2030

7.2 Bargaining power of buyers

Bargaining power of buyers - Impact of key factors 2025 and 2030

7.3 Bargaining power of suppliers

Bargaining power of suppliers - Impact of key factors in 2025 and 2030

7.4 Threat of new entrants

Threat of new entrants - Impact of key factors in 2025 and 2030

7.5 Threat of substitutes

Threat of substitutes - Impact of key factors in 2025 and 2030

7.6 Threat of rivalry

Threat of rivalry - Impact of key factors in 2025 and 2030

7.7 Market condition

Chart on Market condition - Five forces 2025 and 2030

8. Market Segmentation by Product Type

8.1 Market segments

Chart on Product Type - Market share 2025-2030 (%)
Data Table on Product Type - Market share 2025-2030 (%)

8.2 Comparison by Product Type

Chart on Comparison by Product Type
Data Table on Comparison by Product Type

8.3 Pet wellness products - Market size and forecast 2025-2030

Chart on Pet wellness products - Market size and forecast 2025-2030 ($ million)
Data Table on Pet wellness products - Market size and forecast 2025-2030 ($ million)
Chart on Pet wellness products - Year-over-year growth 2025-2030 (%)
Data Table on Pet wellness products - Year-over-year growth 2025-2030 (%)

8.4 Pet tech products - Market size and forecast 2025-2030

Chart on Pet tech products - Market size and forecast 2025-2030 ($ million)
Data Table on Pet tech products - Market size and forecast 2025-2030 ($ million)
Chart on Pet tech products - Year-over-year growth 2025-2030 (%)
Data Table on Pet tech products - Year-over-year growth 2025-2030 (%)

8.5 Market opportunity by Product Type

Market opportunity by Product Type ($ million)
Data Table on Market opportunity by Product Type ($ million)

9. Market Segmentation by End-user

9.1 Market segments

Chart on End-user - Market share 2025-2030 (%)
Data Table on End-user - Market share 2025-2030 (%)

9.2 Comparison by End-user

Chart on Comparison by End-user
Data Table on Comparison by End-user

9.3 Dogs - Market size and forecast 2025-2030

Chart on Dogs - Market size and forecast 2025-2030 ($ million)
Data Table on Dogs - Market size and forecast 2025-2030 ($ million)
Chart on Dogs - Year-over-year growth 2025-2030 (%)
Data Table on Dogs - Year-over-year growth 2025-2030 (%)

9.4 Cats - Market size and forecast 2025-2030

Chart on Cats - Market size and forecast 2025-2030 ($ million)
Data Table on Cats - Market size and forecast 2025-2030 ($ million)
Chart on Cats - Year-over-year growth 2025-2030 (%)
Data Table on Cats - Year-over-year growth 2025-2030 (%)

9.5 Others - Market size and forecast 2025-2030

Chart on Others - Market size and forecast 2025-2030 ($ million)
Data Table on Others - Market size and forecast 2025-2030 ($ million)
Chart on Others - Year-over-year growth 2025-2030 (%)
Data Table on Others - Year-over-year growth 2025-2030 (%)

9.6 Market opportunity by End-user

Market opportunity by End-user ($ million)
Data Table on Market opportunity by End-user ($ million)

10. Market Segmentation by Distribution Channel

10.1 Market segments

Chart on Distribution Channel - Market share 2025-2030 (%)
Data Table on Distribution Channel - Market share 2025-2030 (%)

10.2 Comparison by Distribution Channel

Chart on Comparison by Distribution Channel
Data Table on Comparison by Distribution Channel

10.3 Offline - Market size and forecast 2025-2030

Chart on Offline - Market size and forecast 2025-2030 ($ million)
Data Table on Offline - Market size and forecast 2025-2030 ($ million)
Chart on Offline - Year-over-year growth 2025-2030 (%)
Data Table on Offline - Year-over-year growth 2025-2030 (%)

10.4 Online - Market size and forecast 2025-2030

Chart on Online - Market size and forecast 2025-2030 ($ million)
Data Table on Online - Market size and forecast 2025-2030 ($ million)
Chart on Online - Year-over-year growth 2025-2030 (%)
Data Table on Online - Year-over-year growth 2025-2030 (%)

10.5 Market opportunity by Distribution Channel

Market opportunity by Distribution Channel ($ million)
Data Table on Market opportunity by Distribution Channel ($ million)

11. Customer Landscape

11.1 Customer landscape overview

Analysis of price sensitivity, lifecycle, customer purchase basket, adoption rates, and purchase criteria

12. Geographic Landscape

12.1 Geographic segmentation

Chart on Market share by geography 2025-2030 (%)
Data Table on Market share by geography 2025-2030 (%)

12.2 Geographic comparison

Chart on Geographic comparison
Data Table on Geographic comparison

12.3 North America - Market size and forecast 2025-2030

Chart on North America - Market size and forecast 2025-2030 ($ million)
Data Table on North America - Market size and forecast 2025-2030 ($ million)
Chart on North America - Year-over-year growth 2025-2030 (%)
Data Table on North America - Year-over-year growth 2025-2030 (%)
Chart on Regional Comparison - North America
Data Table on Regional Comparison - North America

12.3.1 US - Market size and forecast 2025-2030

Chart on US - Market size and forecast 2025-2030 ($ million)
Data Table on US - Market size and forecast 2025-2030 ($ million)
Chart on US - Year-over-year growth 2025-2030 (%)
Data Table on US - Year-over-year growth 2025-2030 (%)

12.3.2 Canada - Market size and forecast 2025-2030

Chart on Canada - Market size and forecast 2025-2030 ($ million)
Data Table on Canada - Market size and forecast 2025-2030 ($ million)
Chart on Canada - Year-over-year growth 2025-2030 (%)
Data Table on Canada - Year-over-year growth 2025-2030 (%)

12.3.3 Mexico - Market size and forecast 2025-2030

Chart on Mexico - Market size and forecast 2025-2030 ($ million)
Data Table on Mexico - Market size and forecast 2025-2030 ($ million)
Chart on Mexico - Year-over-year growth 2025-2030 (%)
Data Table on Mexico - Year-over-year growth 2025-2030 (%)

12.4 Europe - Market size and forecast 2025-2030

Chart on Europe - Market size and forecast 2025-2030 ($ million)
Data Table on Europe - Market size and forecast 2025-2030 ($ million)
Chart on Europe - Year-over-year growth 2025-2030 (%)
Data Table on Europe - Year-over-year growth 2025-2030 (%)
Chart on Regional Comparison - Europe
Data Table on Regional Comparison - Europe

12.4.1 UK - Market size and forecast 2025-2030

Chart on UK - Market size and forecast 2025-2030 ($ million)
Data Table on UK - Market size and forecast 2025-2030 ($ million)
Chart on UK - Year-over-year growth 2025-2030 (%)
Data Table on UK - Year-over-year growth 2025-2030 (%)

12.4.2 Germany - Market size and forecast 2025-2030

Chart on Germany - Market size and forecast 2025-2030 ($ million)
Data Table on Germany - Market size and forecast 2025-2030 ($ million)
Chart on Germany - Year-over-year growth 2025-2030 (%)
Data Table on Germany - Year-over-year growth 2025-2030 (%)

12.4.3 France - Market size and forecast 2025-2030

Chart on France - Market size and forecast 2025-2030 ($ million)
Data Table on France - Market size and forecast 2025-2030 ($ million)
Chart on France - Year-over-year growth 2025-2030 (%)
Data Table on France - Year-over-year growth 2025-2030 (%)

12.4.4 Italy - Market size and forecast 2025-2030

Chart on Italy - Market size and forecast 2025-2030 ($ million)
Data Table on Italy - Market size and forecast 2025-2030 ($ million)
Chart on Italy - Year-over-year growth 2025-2030 (%)
Data Table on Italy - Year-over-year growth 2025-2030 (%)

12.4.5 Spain - Market size and forecast 2025-2030

Chart on Spain - Market size and forecast 2025-2030 ($ million)
Data Table on Spain - Market size and forecast 2025-2030 ($ million)
Chart on Spain - Year-over-year growth 2025-2030 (%)
Data Table on Spain - Year-over-year growth 2025-2030 (%)

12.4.6 The Netherlands - Market size and forecast 2025-2030

Chart on The Netherlands - Market size and forecast 2025-2030 ($ million)
Data Table on The Netherlands - Market size and forecast 2025-2030 ($ million)
Chart on The Netherlands - Year-over-year growth 2025-2030 (%)
Data Table on The Netherlands - Year-over-year growth 2025-2030 (%)

12.5 APAC - Market size and forecast 2025-2030

Chart on APAC - Market size and forecast 2025-2030 ($ million)
Data Table on APAC - Market size and forecast 2025-2030 ($ million)
Chart on APAC - Year-over-year growth 2025-2030 (%)
Data Table on APAC - Year-over-year growth 2025-2030 (%)
Chart on Regional Comparison - APAC
Data Table on Regional Comparison - APAC

12.5.1 China - Market size and forecast 2025-2030

Chart on China - Market size and forecast 2025-2030 ($ million)
Data Table on China - Market size and forecast 2025-2030 ($ million)
Chart on China - Year-over-year growth 2025-2030 (%)
Data Table on China - Year-over-year growth 2025-2030 (%)

12.5.2 Japan - Market size and forecast 2025-2030

Chart on Japan - Market size and forecast 2025-2030 ($ million)
Data Table on Japan - Market size and forecast 2025-2030 ($ million)
Chart on Japan - Year-over-year growth 2025-2030 (%)
Data Table on Japan - Year-over-year growth 2025-2030 (%)

12.5.3 India - Market size and forecast 2025-2030

Chart on India - Market size and forecast 2025-2030 ($ million)
Data Table on India - Market size and forecast 2025-2030 ($ million)
Chart on India - Year-over-year growth 2025-2030 (%)
Data Table on India - Year-over-year growth 2025-2030 (%)

12.5.4 South Korea - Market size and forecast 2025-2030

Chart on South Korea - Market size and forecast 2025-2030 ($ million)
Data Table on South Korea - Market size and forecast 2025-2030 ($ million)
Chart on South Korea - Year-over-year growth 2025-2030 (%)
Data Table on South Korea - Year-over-year growth 2025-2030 (%)

12.5.5 Australia - Market size and forecast 2025-2030

Chart on Australia - Market size and forecast 2025-2030 ($ million)
Data Table on Australia - Market size and forecast 2025-2030 ($ million)
Chart on Australia - Year-over-year growth 2025-2030 (%)
Data Table on Australia - Year-over-year growth 2025-2030 (%)

12.5.6 Indonesia - Market size and forecast 2025-2030

Chart on Indonesia - Market size and forecast 2025-2030 ($ million)
Data Table on Indonesia - Market size and forecast 2025-2030 ($ million)
Chart on Indonesia - Year-over-year growth 2025-2030 (%)
Data Table on Indonesia - Year-over-year growth 2025-2030 (%)

12.6 South America - Market size and forecast 2025-2030

Chart on South America - Market size and forecast 2025-2030 ($ million)
Data Table on South America - Market size and forecast 2025-2030 ($ million)
Chart on South America - Year-over-year growth 2025-2030 (%)
Data Table on South America - Year-over-year growth 2025-2030 (%)
Chart on Regional Comparison - South America
Data Table on Regional Comparison - South America

12.6.1 Brazil - Market size and forecast 2025-2030

Chart on Brazil - Market size and forecast 2025-2030 ($ million)
Data Table on Brazil - Market size and forecast 2025-2030 ($ million)
Chart on Brazil - Year-over-year growth 2025-2030 (%)
Data Table on Brazil - Year-over-year growth 2025-2030 (%)

12.6.2 Argentina - Market size and forecast 2025-2030

Chart on Argentina - Market size and forecast 2025-2030 ($ million)
Data Table on Argentina - Market size and forecast 2025-2030 ($ million)
Chart on Argentina - Year-over-year growth 2025-2030 (%)
Data Table on Argentina - Year-over-year growth 2025-2030 (%)

12.6.3 Colombia - Market size and forecast 2025-2030

Chart on Colombia - Market size and forecast 2025-2030 ($ million)
Data Table on Colombia - Market size and forecast 2025-2030 ($ million)
Chart on Colombia - Year-over-year growth 2025-2030 (%)
Data Table on Colombia - Year-over-year growth 2025-2030 (%)

12.7 Middle East and Africa - Market size and forecast 2025-2030

Chart on Middle East and Africa - Market size and forecast 2025-2030 ($ million)
Data Table on Middle East and Africa - Market size and forecast 2025-2030 ($ million)
Chart on Middle East and Africa - Year-over-year growth 2025-2030 (%)
Data Table on Middle East and Africa - Year-over-year growth 2025-2030 (%)
Chart on Regional Comparison - Middle East and Africa
Data Table on Regional Comparison - Middle East and Africa

12.7.1 Saudi Arabia - Market size and forecast 2025-2030

Chart on Saudi Arabia - Market size and forecast 2025-2030 ($ million)
Data Table on Saudi Arabia - Market size and forecast 2025-2030 ($ million)
Chart on Saudi Arabia - Year-over-year growth 2025-2030 (%)
Data Table on Saudi Arabia - Year-over-year growth 2025-2030 (%)

12.7.2 South Africa - Market size and forecast 2025-2030

Chart on South Africa - Market size and forecast 2025-2030 ($ million)
Data Table on South Africa - Market size and forecast 2025-2030 ($ million)
Chart on South Africa - Year-over-year growth 2025-2030 (%)
Data Table on South Africa - Year-over-year growth 2025-2030 (%)

12.7.3 UAE - Market size and forecast 2025-2030

Chart on UAE - Market size and forecast 2025-2030 ($ million)
Data Table on UAE - Market size and forecast 2025-2030 ($ million)
Chart on UAE - Year-over-year growth 2025-2030 (%)
Data Table on UAE - Year-over-year growth 2025-2030 (%)

12.7.4 Turkey - Market size and forecast 2025-2030

Chart on Turkey - Market size and forecast 2025-2030 ($ million)
Data Table on Turkey - Market size and forecast 2025-2030 ($ million)
Chart on Turkey - Year-over-year growth 2025-2030 (%)
Data Table on Turkey - Year-over-year growth 2025-2030 (%)

12.7.5 Israel - Market size and forecast 2025-2030

Chart on Israel - Market size and forecast 2025-2030 ($ million)
Data Table on Israel - Market size and forecast 2025-2030 ($ million)
Chart on Israel - Year-over-year growth 2025-2030 (%)
Data Table on Israel - Year-over-year growth 2025-2030 (%)

12.8 Market opportunity by geography

Market opportunity by geography ($ million)
Data Tables on Market opportunity by geography ($ million)

13. Drivers, Challenges, and Opportunity

13.1 Market drivers

Increasing humanization of companion animals
Rapid advancements in AI and IoT Capabilities
Strategic integration of general consumer technology into animal care

13.2 Market challenges

Prohibitive costs associated with advanced technological devices and premium solutions
Severe vulnerabilities in data privacy and connected cybersecurity
Lack of interoperability and fragmented regulatory frameworks

13.3 Impact of drivers and challenges

Impact of drivers and challenges in 2025 and 2030

13.4 Market opportunities

Proliferation of sustainable and eco-friendly pet wellness solutions
Expansion of specialized telehealth and remote veterinary consultation platforms
Growth of personalized nutrition and breed-specific genomic wellness programs

14. Competitive Landscape

14.1 Overview

14.2

Overview on criticality of inputs and factors of differentiation

14.3 Landscape disruption

Overview on factors of disruption

14.4 Industry risks

Impact of key risks on business

15. Competitive Analysis

15.1 Companies profiled

Companies covered

15.2 Company ranking index

15.3 Market positioning of companies

Matrix on companies position and classification

15.4 Central Garden and Pet Co.

Central Garden and Pet Co. - Overview
Central Garden and Pet Co. - Business segments
Central Garden and Pet Co. - Key offerings
Central Garden and Pet Co. - Segment focus
SWOT

15.5 FitBark Inc.

FitBark Inc. - Overview
FitBark Inc. - Product / Service
FitBark Inc. - Key offerings
SWOT

15.6 Furbo

Furbo - Overview
Furbo - Product / Service
Furbo - Key offerings
SWOT

15.7 Garmin Ltd.

Garmin Ltd. - Overview
Garmin Ltd. - Business segments
Garmin Ltd. - Key news
Garmin Ltd. - Key offerings
Garmin Ltd. - Segment focus
SWOT

15.8 Merck and Co. Inc.

Merck and Co. Inc. - Overview
Merck and Co. Inc. - Business segments
Merck and Co. Inc. - Key news
Merck and Co. Inc. - Key offerings
Merck and Co. Inc. - Segment focus
SWOT

15.9 Nestle SA

Nestle SA - Overview
Nestle SA - Business segments
Nestle SA - Key news
Nestle SA - Key offerings
Nestle SA - Segment focus
SWOT

15.10 NOW Health Group Inc.

NOW Health Group Inc. - Overview
NOW Health Group Inc. - Product / Service
NOW Health Group Inc. - Key offerings
SWOT

15.11 Nutramax Laboratories Inc.

Nutramax Laboratories Inc. - Overview
Nutramax Laboratories Inc. - Product / Service
Nutramax Laboratories Inc. - Key offerings
SWOT

15.12 Petcube Inc.

Petcube Inc. - Overview
Petcube Inc. - Product / Service
Petcube Inc. - Key offerings
SWOT

15.13 PETKIT Ltd.

PETKIT Ltd. - Overview
PETKIT Ltd. - Product / Service
PETKIT Ltd. - Key offerings
SWOT

15.14 Radio Systems Corp

Radio Systems Corp - Overview
Radio Systems Corp - Product / Service
Radio Systems Corp - Key offerings
SWOT

15.15 Tractive GmbH

Tractive GmbH - Overview
Tractive GmbH - Product / Service
Tractive GmbH - Key offerings
SWOT

15.16 Virbac Group

Virbac Group - Overview
Virbac Group - Business segments
Virbac Group - Key offerings
Virbac Group - Segment focus
SWOT

15.17 Whisker

Whisker - Overview
Whisker - Product / Service
Whisker - Key offerings
SWOT

15.18 Zesty Paws

Zesty Paws - Overview
Zesty Paws - Product / Service
Zesty Paws - Key offerings
SWOT

16. Appendix

16.1 Scope of the report

Market definition
Objectives
Notes and caveats

16.2 Inclusions and exclusions checklist

Inclusions checklist
Exclusions checklist

16.3 Currency conversion rates for US$

16.4 Research methodology

16.5 Data procurement

Information sources

16.6 Data validation

16.7 Validation techniques employed for market sizing

16.8 Data synthesis

16.9 360 degree market analysis

16.10 List of abbreviations

Research Methodology

Technavio presents a detailed picture of the market by way of study, synthesis, and summation of data from multiple sources. The analysts have presented the various facets of the market with a particular focus on identifying the key industry influencers. The data thus presented is comprehensive, reliable, and the result of extensive research, both primary and secondary.

INFORMATION SOURCES

Primary sources

  • Manufacturers and suppliers
  • Channel partners
  • Industry experts
  • Strategic decision makers

Secondary sources

  • Industry journals and periodicals
  • Government data
  • Financial reports of key industry players
  • Historical data
  • Press releases

DATA ANALYSIS

Data Synthesis

  • Collation of data
  • Estimation of key figures
  • Analysis of derived insights

Data Validation

  • Triangulation with data models
  • Reference against proprietary databases
  • Corroboration with industry experts

REPORT WRITING

Qualitative

  • Market drivers
  • Market challenges
  • Market trends
  • Five forces analysis

Quantitative

  • Market size and forecast
  • Market segmentation
  • Geographical insights
  • Competitive landscape

Interested in this report?

Get your sample now to see our research methodology and insights!

Download Now

Frequently Asked Questions

Pet Tech And Wellness Products market growth will increase by USD 31917.1 million during 2026-2030.

The Pet Tech And Wellness Products market is expected to grow at a CAGR of 8.8% during 2026-2030.

Pet Tech And Wellness Products market is segmented by Product type (Pet wellness products, Pet tech products) End-user (Dogs, Cats, Others) Distribution channel (Offline, Online)

Central Garden and Pet Co., FitBark Inc., Furbo, Garmin Ltd., Hills Pet Nutrition Inc., Merck and Co. Inc., Nestle SA, NOW Health Group Inc., Nutramax Laboratories Inc., Petcube Inc., PetIQ LLC., PETKIT Ltd., Radio Systems Corp, Tractive GmbH, Vetster Inc., Virbac Group, Wellness Pet Co. Inc., Whisker, Zesty Paws, Zoetis Inc. are a few of the key vendors in the Pet Tech And Wellness Products market.

North America will register the highest growth rate of 33.7% among the other regions. Therefore, the Pet Tech And Wellness Products market in North America is expected to garner significant business opportunities for the vendors during the forecast period.

US, Canada, Mexico, UK, Germany, France, Italy, Spain, The Netherlands, China, Japan, India, South Korea, Australia, Indonesia, Brazil, Argentina, Colombia, Saudi Arabia, South Africa, UAE, Turkey, Israel

  • Increasing humanization of companion animals is the driving factor this market.

The Pet Tech And Wellness Products market vendors should focus on grabbing business opportunities from the Product type segment as it accounted for the largest market share in the base year.
RIA - Research AI Assistant
Ask RIA