Pharmaceutical Intermediates Market Market Analysis, Size, and Forecast 2026-2030: North America (US, Canada, and Mexico), APAC (China, India, and Japan), Europe (Germany, UK, and France), South America (Brazil), Middle East and Africa (South Africa, UAE, and Saudi Arabia), Asia, Rest of World (ROW)

Pharmaceutical Intermediates Market Market Analysis, Size, and Forecast 2026-2030:
North America (US, Canada, and Mexico), APAC (China, India, and Japan), Europe (Germany, UK, and France), South America (Brazil), Middle East and Africa (South Africa, UAE, and Saudi Arabia), Asia, Rest of World (ROW)

Published: Dec 2025 303 Pages SKU: IRTNTR81171

Market Overview at a Glance

$13.27 B
Market Opportunity
5.7%
CAGR 2025 - 2030
38%
Asia Growth
$11.20 B
Aromatic intermediates segment 2024

Pharmaceutical Intermediates Market Market Size 2026-2030

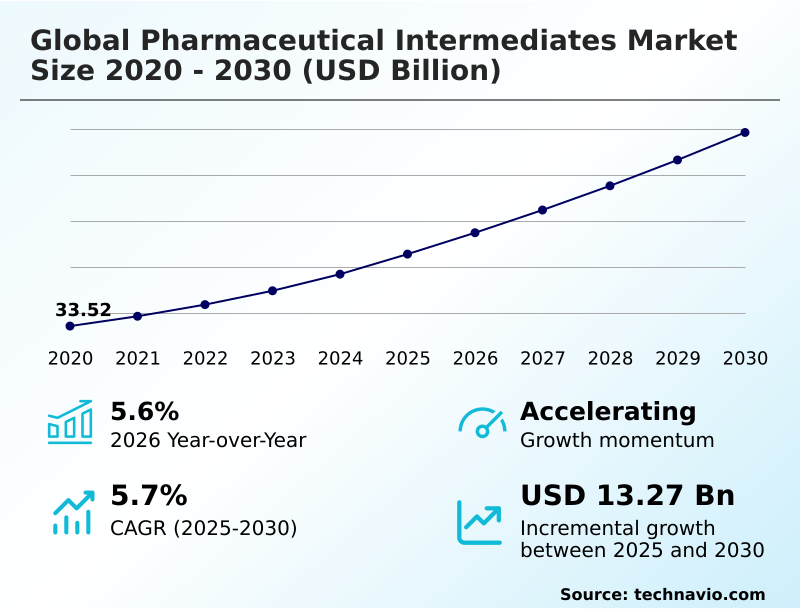
The pharmaceutical intermediates market market size is valued to increase by USD 13.27 billion, at a CAGR of 5.7% from 2025 to 2030. Rising prevalence of chronic diseases and aging global population will drive the pharmaceutical intermediates market market.

Major Market Trends & Insights

  • Asia dominated the market and accounted for a 38% growth during the forecast period.
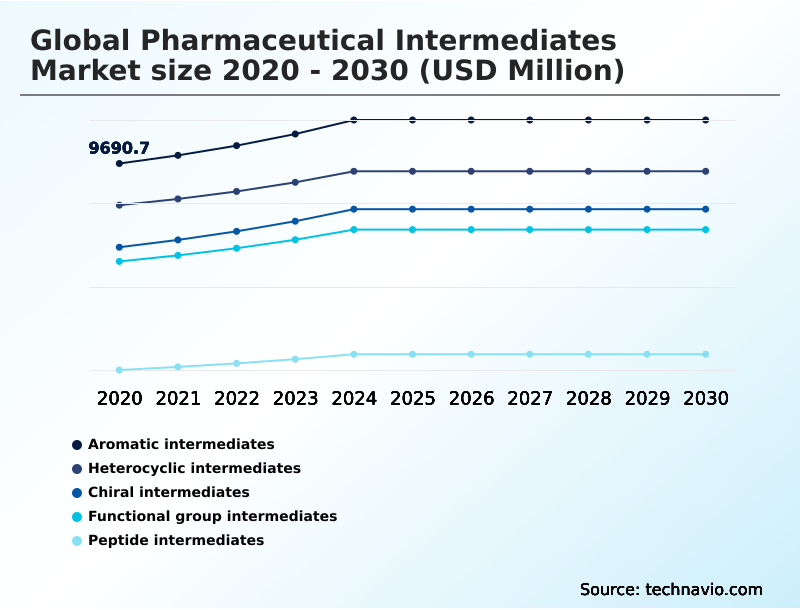
  • By Type - Aromatic intermediates segment was valued at USD 11.20 billion in 2024
  • By Application - Anti-inflammatory drugs segment accounted for the largest market revenue share in 2024

Market Size & Forecast

  • Market Opportunities: USD 21.12 billion
  • Market Future Opportunities: USD 13.27 billion
  • CAGR from 2025 to 2030 : 5.7%

Market Summary

  • The pharmaceutical intermediates market is foundational to the broader pharmaceutical industry, providing the essential molecular building blocks required for synthesizing active pharmaceutical ingredients (APIs). Growth is underpinned by the rising global prevalence of chronic diseases and an aging population, which sustains high-volume demand for a wide array of therapeutics.
  • Concurrently, the burgeoning generic drugs industry creates immense, volume-driven demand as blockbuster drugs lose patent protection, intensifying the need for cost-effective intermediate supply chains. A key business scenario involves an innovative biotech firm deciding to forgo capital-intensive in-house manufacturing.
  • Instead, it engages a specialized contract development and manufacturing organization (CDMO) to handle the complex, multi-step synthesis of its proprietary chiral intermediates. This outsourcing strategy allows the firm to accelerate its drug development timeline and focus its resources on core R&D and clinical trials.
  • However, the market is not without complexities; manufacturers must navigate a labyrinth of stringent cGMP regulations and address vulnerabilities in a supply chain heavily concentrated in Asia, all while facing pressure to adopt greener, more sustainable chemical processes. The industry's trajectory is toward more complex, high-value molecules, requiring advanced synthetic expertise.

What will be the Size of the Pharmaceutical Intermediates Market Market during the forecast period?

Get Key Insights on Market Forecast (PDF) Request Free Sample

How is the Pharmaceutical IntermediatesMarket Market Segmented?

The pharmaceutical intermediatesmarket industry research report provides comprehensive data (region-wise segment analysis), with forecasts and estimates in "USD million" for the period 2026-2030, as well as historical data from 2020-2024 for the following segments.

  • Type
    • Aromatic intermediates
    • Heterocyclic intermediates
    • Chiral intermediates
    • Functional group intermediates
    • Peptide intermediates
  • Application
    • Anti-inflammatory drugs
    • Analgesics
    • Cardiovascular drugs
    • Anti cancer drugs
    • Others
  • End-user
    • Biotech and pharma companies
    • CMOs and CROs
    • Research laboratory
  • Geography
    • North America
      • US
      • Canada
      • Mexico
    • Asia
    • Europe
      • Germany
      • UK
      • France
    • Rest of World (ROW)

By Type Insights

The aromatic intermediates segment is estimated to witness significant growth during the forecast period.

Aromatic intermediates represent a foundational class of organic compounds, serving as the core scaffold for a vast number of small-molecule active pharmaceutical ingredients (APIs).

Their demand is primarily driven by the high-volume production of established generic drugs, where cost efficiency, purity, and supply chain reliability are paramount.

This segment is characterized by intense competition, compelling manufacturers to focus on operational excellence and economies of scale. Key trends involve the development of greener synthesis routes to minimize environmental impact.

The strategic importance of these molecules as workhorse chemical building blocks is undeniable; their stable, cost-effective supply is essential for producing a significant portion of the world's medicines, with some widely used analgesics seeing a 15% improvement in yield through advanced process chemistry.

Request Free Sample

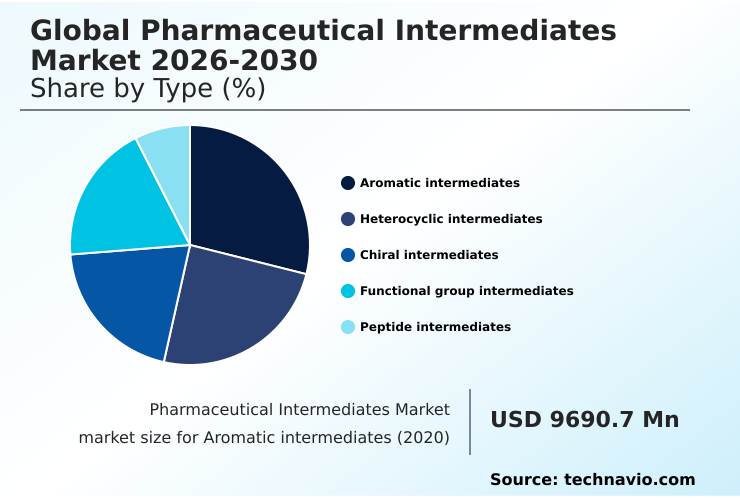
The Aromatic intermediates segment was valued at USD 11.20 billion in 2024 and showed a gradual increase during the forecast period.

Request Free Sample

Regional Analysis

Asia is estimated to contribute 38% to the growth of the global market during the forecast period.Technavio’s analysts have elaborately explained the regional trends and drivers that shape the market during the forecast period.

See How Pharmaceutical IntermediatesMarket Market Demand is Rising in Asia Request Free Sample

The global geographic landscape is defined by a strategic dichotomy. Asia, particularly China and India, remains the manufacturing powerhouse, accounting for over 38% of the market's incremental growth, driven by its vast infrastructure for producing fine chemicals and starting materials.

These nations are pivotal intermediate chemical suppliers for the global drug substance manufacturing ecosystem. However, significant supply chain vulnerabilities have prompted a counter-trend in North America and Europe, where reshoring and regionalization initiatives are gaining momentum.

Supported by government policies, US and European CDMOs are expanding their capacity for advanced intermediates and API synthesis.

This strategic shift aims to enhance pharmaceutical supply chain resilience, as reliance on single-source regions previously led to production delays for up to 45% of surveyed companies, underscoring the drive for a more balanced and secure global network.

Market Dynamics

Our researchers analyzed the data with 2025 as the base year, along with the key drivers, trends, and challenges. A holistic analysis of drivers will help companies refine their marketing strategies to gain a competitive advantage.

  • Strategic planning in the global pharmaceutical intermediates market 2026-2030 requires a multi-faceted approach to navigate a complex and competitive environment. Boardroom decisions increasingly center on the total cost of chiral intermediates production, not just the unit price, factoring in the long-term value of quality and supply security.
  • Adherence to evolving GMP guidelines for API intermediates is non-negotiable, demanding continuous investment in quality systems and advanced analytics for purity profiling. Companies are actively exploring the benefits of continuous manufacturing for intermediates, with flow chemistry in intermediate synthesis offering significant advantages in safety, consistency, and footprint reduction.
  • This has made api synthesis route scouting services that incorporate such technologies highly valuable. The trend of outsourcing advanced intermediate manufacturing services continues, as it provides access to specialized expertise in areas like high-potency API handling. This allows firms to focus on core competencies while managing pharmaceutical supply chain vulnerabilities by diversifying their partner base.
  • Securing reliable starting material suppliers is a critical risk mitigation in drug substance manufacturing. Decision-makers are also comparing CDMO capabilities for peptide synthesis to capitalize on the booming biologics sector, while technology transfer for intermediate processes must be seamless to maintain timelines.
  • As companies navigate patent cliffs for intermediates, the ability to rapidly scale production of building blocks for generic drugs becomes a key competitive differentiator, with some achieving a 20% faster scale-up than competitors. This entire framework depends on a robust strategy for sustainability in fine chemical production and the strategic sourcing of chemical building blocks.

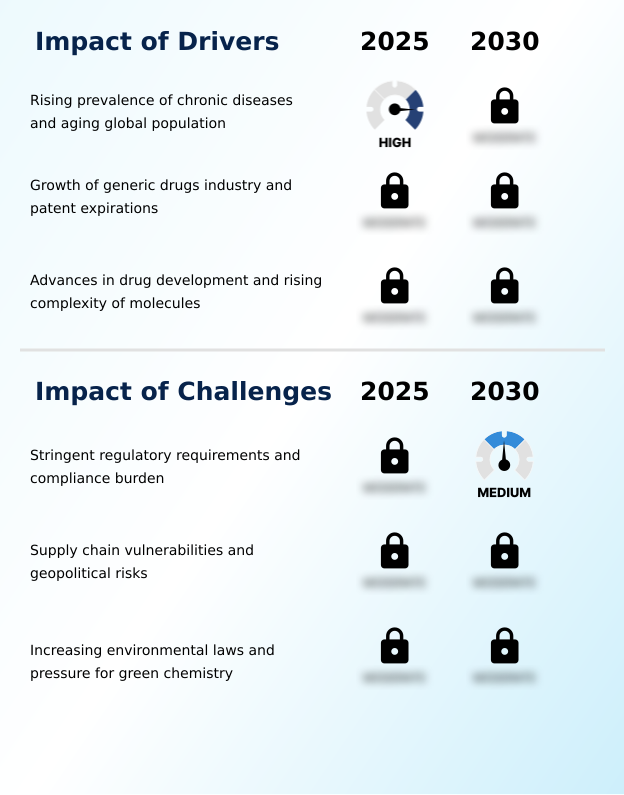
What are the key market drivers leading to the rise in the adoption of Pharmaceutical IntermediatesMarket Industry?

  • The rising global prevalence of chronic diseases, combined with a rapidly aging population, creates a sustained and foundational demand for the therapeutic interventions that rely on these intermediates.

  • Market expansion is fundamentally propelled by the rising global prevalence of chronic diseases and demographic shifts toward an older population, which ensures a sustained, high-volume need for therapeutics.
  • This structural demand for small molecule synthesis is amplified by the burgeoning generic drugs industry.
  • The expiration of patents on blockbuster drugs, often referred to as the patent cliff, creates an immediate and massive need for the corresponding active pharmaceutical ingredient production.
  • Demand for specific generic intermediates can surge by over 200% in the initial post-patent year.
  • Furthermore, relentless innovation in pharmaceutical R&D, particularly the focus on personalized medicine and complex modalities like peptide synthesis and antibody-drug conjugates, is a powerful driver for the high-value segment, requiring a constant supply of novel, sophisticated chiral building blocks for clinical trial materials.

What are the market trends shaping the Pharmaceutical IntermediatesMarket Industry?

  • The market is witnessing a pronounced shift toward the development and manufacturing of high-potency and structurally complex intermediates, driven by the demands of targeted therapies.

  • A defining trend is the escalating demand for high-potency and structurally complex intermediates, a direct result of the shift toward targeted therapies in oncology and immunology. The synthesis of high-potency APIs (HPAPIs) necessitates a series of specialized intermediates that require contained manufacturing environments to ensure worker safety.
  • Firms investing in this niche area have seen a 30% increase in contract value compared to standard intermediate projects. Concurrently, the adoption of advanced manufacturing technologies, particularly flow chemistry technology, is reshaping process development. This approach enhances control over reaction parameters, leading to higher purity and yield.
  • CDMOs adopting continuous manufacturing report a 40% reduction in facility footprint and a 15% improvement in batch-to-batch consistency, providing a distinct competitive advantage in a market focused on efficiency and quality.

What challenges does the Pharmaceutical IntermediatesMarket Industry face during its growth?

  • Navigating stringent and continuously evolving regulatory requirements, along with the associated compliance burden, presents a significant operational and financial challenge for manufacturers in the industry.

  • A formidable challenge is the stringent and complex regulatory landscape governing the pharmaceutical supply chain. Manufacturers of cGMP compliant intermediates face intense scrutiny from bodies like the FDA and EMA, requiring substantial investment in quality systems and meticulous documentation. Adhering to new environmental standards can increase operational costs by up to 20% for manufacturers without established green chemistry principles.
  • Another persistent challenge is the inherent vulnerability of a global supply chain heavily concentrated in Asia. Geopolitical tensions and regional disruptions can lead to sudden shortages and price volatility, threatening the production of essential medicines. Recognizing this, regulatory bodies are introducing measures to strengthen the security of medicine supply, adding another layer of compliance complexity for commercial-scale intermediate manufacturing.

Exclusive Technavio Analysis on Customer Landscape

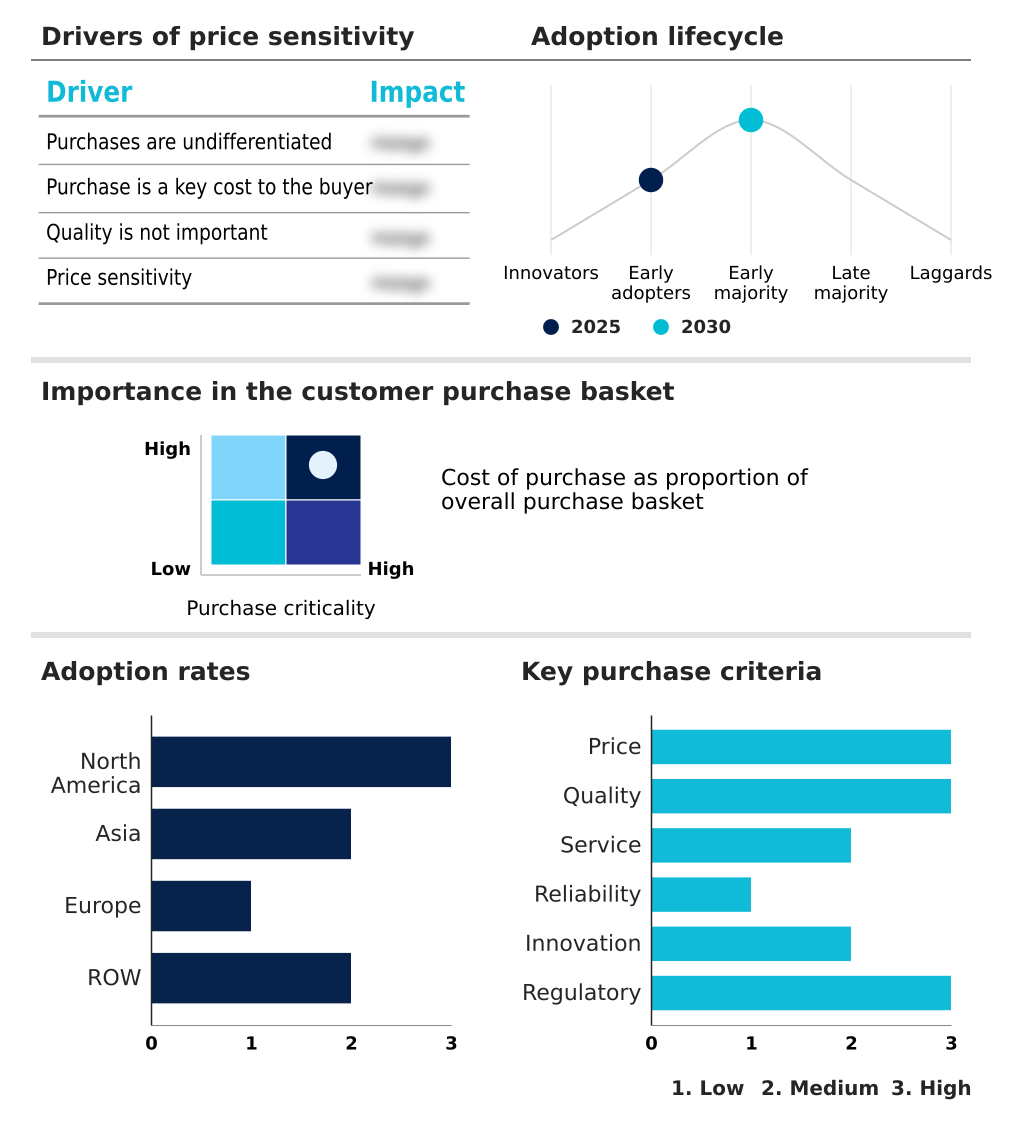
The pharmaceutical intermediates market market forecasting report includes the adoption lifecycle of the market, covering from the innovator’s stage to the laggard’s stage. It focuses on adoption rates in different regions based on penetration. Furthermore, the pharmaceutical intermediates market market report also includes key purchase criteria and drivers of price sensitivity to help companies evaluate and develop their market growth analysis strategies.

Customer Landscape of Pharmaceutical IntermediatesMarket Industry

Competitive Landscape

Companies are implementing various strategies, such as strategic alliances, pharmaceutical intermediates market market forecast, partnerships, mergers and acquisitions, geographical expansion, and product/service launches, to enhance their presence in the industry.

Aceto Corp. - Offerings center on custom synthesis and scalable manufacturing of high-purity pharmaceutical intermediates, including advanced chemical building blocks and GMP-compliant starting materials for API production.

The industry research and growth report includes detailed analyses of the competitive landscape of the market and information about key companies, including:

  • Aceto Corp.
  • Actylis
  • Arkema Group
  • Aurobindo Pharma Ltd.
  • BASF SE
  • Cambrex Corp.
  • Carbogen Amcis Ltd.
  • EUROAPI S.A.
  • Evonik Industries AG
  • HIKAL Ltd.
  • Hovione S.A.
  • Interchem Pvt. Ltd.
  • Lianhe Chemical Technology
  • Lonza Group Ltd.
  • Merck KGaA
  • Midas Pharma GmbH
  • Thermo Fisher Scientific Inc.
  • Vertellus Holdings LLC
  • WuXi AppTec Co. Ltd.

Qualitative and quantitative analysis of companies has been conducted to help clients understand the wider business environment as well as the strengths and weaknesses of key industry players. Data is qualitatively analyzed to categorize companies as pure play, category-focused, industry-focused, and diversified; it is quantitatively analyzed to categorize companies as dominant, leading, strong, tentative, and weak.

Recent Development and News in Pharmaceutical intermediates market market

  • In October 2024, a leading CDMO announced a significant investment to construct a new facility in North America dedicated to the manufacturing of high-potency intermediates and linkers for antibody-drug conjugates (ADCs).
  • In January 2025, two prominent pharmaceutical technology firms revealed a strategic partnership to integrate AI-driven platforms into process chemistry, aiming to accelerate synthetic route design and optimization for novel intermediates.
  • In March 2025, a major European chemical company launched a new portfolio of bio-based starting materials, developed in alignment with green chemistry principles to reduce the environmental footprint of API synthesis.
  • In May 2025, a consortium of top generic drug manufacturers established a joint venture in India to secure the supply chain for key peptide intermediates, responding to the unprecedented demand for GLP-1 agonists.

Dive into Technavio’s robust research methodology, blending expert interviews, extensive data synthesis, and validated models for unparalleled Pharmaceutical Intermediates Market Market insights. See full methodology.

Market Scope
Page number 303
Base year 2025
Historic period 2020-2024
Forecast period 2026-2030
Growth momentum & CAGR Accelerate at a CAGR of 5.7%
Market growth 2026-2030 USD 13273.6 million
Market structure Fragmented
YoY growth 2025-2026(%) 5.6%
Key countries US, Canada, Mexico, China, India, Japan, South Korea, Indonesia, Thailand, Singapore, Germany, UK, France, The Netherlands, Italy, Spain, Russia, Brazil, Australia, South Africa, UAE, Saudi Arabia and Turkey
Competitive landscape Leading Companies, Market Positioning of Companies, Competitive Strategies, and Industry Risks

Request Free Sample

Research Analyst Overview

  • The pharmaceutical intermediates market is undergoing a significant transformation, driven by the dual pressures of pharmaceutical innovation and supply chain optimization. The core of this evolution lies in the increasing complexity of molecular architecture in modern therapeutics, particularly small molecule drugs.
  • This shift intensifies the demand for advanced intermediates produced through sophisticated synthetic chemistry, including asymmetric catalysis and organometallic chemistry, to achieve precise stereochemistry. As a result, the industry is moving beyond commodity chemicals toward high-value chemical building blocks and fine chemicals.
  • Boardroom-level decisions are now heavily focused on capital expenditure for cGMP manufacturing facilities capable of handling high-potency APIs and executing complex process chemistry. For instance, companies that have invested in advanced process development and reaction parameters control have reported a 20% improvement in final product purity.
  • The synthesis of these compounds, critical for drug discovery and subsequent drug substance manufacturing, requires deep expertise in medicinal chemistry and a reliable supply of high-purity starting materials. Success hinges on a company's ability to master both the science of API synthesis and the logistics of a global supply chain.

What are the Key Data Covered in this Pharmaceutical Intermediates Market Market Research and Growth Report?

  • What is the expected growth of the Pharmaceutical Intermediates Market Market between 2026 and 2030?

    • USD 13.27 billion, at a CAGR of 5.7%

  • What segmentation does the market report cover?

    • The report is segmented by Type (Aromatic intermediates, Heterocyclic intermediates, Chiral intermediates, Functional group intermediates, and Peptide intermediates), Application (Anti-inflammatory drugs, Analgesics, Cardiovascular drugs, Anti Cancer drugs, and Others), End-user (Biotech and Pharma Companies, CMOs and CROs, and Research Laboratory) and Geography (North America, Asia, Europe, Rest of World (ROW))

  • Which regions are analyzed in the report?

    • North America, Asia, Europe and Rest of World (ROW)

  • What are the key growth drivers and market challenges?

    • Rising prevalence of chronic diseases and aging global population, Stringent regulatory requirements and compliance burden

  • Who are the major players in the Pharmaceutical Intermediates Market Market?

    • Aceto Corp., Actylis, Arkema Group, Aurobindo Pharma Ltd., BASF SE, Cambrex Corp., Carbogen Amcis Ltd., EUROAPI S.A., Evonik Industries AG, HIKAL Ltd., Hovione S.A., Interchem Pvt. Ltd., Lianhe Chemical Technology, Lonza Group Ltd., Merck KGaA, Midas Pharma GmbH, Thermo Fisher Scientific Inc., Vertellus Holdings LLC and WuXi AppTec Co. Ltd.

Market Research Insights

  • The market's momentum is shaped by the strategic decisions of biotech and pharma companies. The trend of outsourcing intermediate production to a contract development and manufacturing organization is accelerating, as it allows innovators to avoid significant capital expenditure and access specialized technologies.
  • CDMOs implementing flow chemistry technology have demonstrated the ability to reduce reaction times by over 25% and improve yield consistency compared to traditional batch methods. This efficiency is critical for managing the supply of pharmaceutical raw materials and ensuring supply chain resilience.
  • Furthermore, strategic partnerships for custom intermediate synthesis are proving vital for drug substance development, with collaborative projects showing a 15% higher success rate in progressing from preclinical to Phase I trials by leveraging expert scale-up synthesis services and optimized API process optimization.

We can help! Our analysts can customize this pharmaceutical intermediates market market research report to meet your requirements.

Get in touch

1. Executive Summary

1.1 Market overview

Executive Summary - Chart on Market Overview
Executive Summary - Data Table on Market Overview
Executive Summary - Chart on Global Market Characteristics
Executive Summary - Chart on Market by Geography
Executive Summary - Chart on Market Segmentation by Type
Executive Summary - Chart on Market Segmentation by Application
Executive Summary - Chart on Market Segmentation by End-user
Executive Summary - Chart on Incremental Growth
Executive Summary - Data Table on Incremental Growth
Executive Summary - Chart on Company Market Positioning

2. Technavio Analysis

2.1 Analysis of price sensitivity, lifecycle, customer purchase basket, adoption rates, and purchase criteria

2.2 Criticality of inputs and Factors of differentiation

Chart on Overview on criticality of inputs and factors of differentiation

2.3 Factors of disruption

Chart on Overview on factors of disruption

2.4 Impact of drivers and challenges

Chart on Impact of drivers and challenges in 2025 and 2030

3. Market Landscape

3.1 Market ecosystem

Chart on Parent Market
Data Table on - Parent Market

3.2 Market characteristics

Chart on Market characteristics analysis

3.3 Value chain analysis

Chart on Value chain analysis

4. Market Sizing

4.1 Market definition

Data Table on Offerings of companies included in the market definition

4.2 Market segment analysis

Market segments

4.3 Market size 2025

4.4 Market outlook: Forecast for 2025-2030

Chart on Global - Market size and forecast 2025-2030 ($ million)
Data Table on Global - Market size and forecast 2025-2030 ($ million)
Chart on Global Market: Year-over-year growth 2025-2030 (%)
Data Table on Global Market: Year-over-year growth 2025-2030 (%)

5. Historic Market Size

5.1 Global Pharmaceutical Intermediates Market 2020 - 2024

Historic Market Size - Data Table on Global Pharmaceutical Intermediates Market 2020 - 2024 ($ million)

5.2 Type segment analysis 2020 - 2024

Historic Market Size - Type Segment 2020 - 2024 ($ million)

5.3 Application segment analysis 2020 - 2024

Historic Market Size - Application Segment 2020 - 2024 ($ million)

5.4 End-user segment analysis 2020 - 2024

Historic Market Size - End-user Segment 2020 - 2024 ($ million)

5.5 Geography segment analysis 2020 - 2024

Historic Market Size - Geography Segment 2020 - 2024 ($ million)

5.6 Country segment analysis 2020 - 2024

Historic Market Size - Country Segment 2020 - 2024 ($ million)

6. Qualitative Analysis

6.1 The AI impact on global pharmaceutical intermediates market

7. Five Forces Analysis

7.1 Five forces summary

Five forces analysis - Comparison between 2025 and 2030

7.2 Bargaining power of buyers

Bargaining power of buyers - Impact of key factors 2025 and 2030

7.3 Bargaining power of suppliers

Bargaining power of suppliers - Impact of key factors in 2025 and 2030

7.4 Threat of new entrants

Threat of new entrants - Impact of key factors in 2025 and 2030

7.5 Threat of substitutes

Threat of substitutes - Impact of key factors in 2025 and 2030

7.6 Threat of rivalry

Threat of rivalry - Impact of key factors in 2025 and 2030

7.7 Market condition

Chart on Market condition - Five forces 2025 and 2030

8. Market Segmentation by Type

8.1 Market segments

Chart on Type - Market share 2025-2030 (%)
Data Table on Type - Market share 2025-2030 (%)

8.2 Comparison by Type

Chart on Comparison by Type
Data Table on Comparison by Type

8.3 Aromatic intermediates - Market size and forecast 2025-2030

Chart on Aromatic intermediates - Market size and forecast 2025-2030 ($ million)
Data Table on Aromatic intermediates - Market size and forecast 2025-2030 ($ million)
Chart on Aromatic intermediates - Year-over-year growth 2025-2030 (%)
Data Table on Aromatic intermediates - Year-over-year growth 2025-2030 (%)

8.4 Heterocyclic intermediates - Market size and forecast 2025-2030

Chart on Heterocyclic intermediates - Market size and forecast 2025-2030 ($ million)
Data Table on Heterocyclic intermediates - Market size and forecast 2025-2030 ($ million)
Chart on Heterocyclic intermediates - Year-over-year growth 2025-2030 (%)
Data Table on Heterocyclic intermediates - Year-over-year growth 2025-2030 (%)

8.5 Chiral intermediates - Market size and forecast 2025-2030

Chart on Chiral intermediates - Market size and forecast 2025-2030 ($ million)
Data Table on Chiral intermediates - Market size and forecast 2025-2030 ($ million)
Chart on Chiral intermediates - Year-over-year growth 2025-2030 (%)
Data Table on Chiral intermediates - Year-over-year growth 2025-2030 (%)

8.6 Functional group intermediates - Market size and forecast 2025-2030

Chart on Functional group intermediates - Market size and forecast 2025-2030 ($ million)
Data Table on Functional group intermediates - Market size and forecast 2025-2030 ($ million)
Chart on Functional group intermediates - Year-over-year growth 2025-2030 (%)
Data Table on Functional group intermediates - Year-over-year growth 2025-2030 (%)

8.7 Peptide intermediates - Market size and forecast 2025-2030

Chart on Peptide intermediates - Market size and forecast 2025-2030 ($ million)
Data Table on Peptide intermediates - Market size and forecast 2025-2030 ($ million)
Chart on Peptide intermediates - Year-over-year growth 2025-2030 (%)
Data Table on Peptide intermediates - Year-over-year growth 2025-2030 (%)

8.8 Market opportunity by Type

Market opportunity by Type ($ million)
Data Table on Market opportunity by Type ($ million)

9. Market Segmentation by Application

9.1 Market segments

Chart on Application - Market share 2025-2030 (%)
Data Table on Application - Market share 2025-2030 (%)

9.2 Comparison by Application

Chart on Comparison by Application
Data Table on Comparison by Application

9.3 Anti-inflammatory drugs - Market size and forecast 2025-2030

Chart on Anti-inflammatory drugs - Market size and forecast 2025-2030 ($ million)
Data Table on Anti-inflammatory drugs - Market size and forecast 2025-2030 ($ million)
Chart on Anti-inflammatory drugs - Year-over-year growth 2025-2030 (%)
Data Table on Anti-inflammatory drugs - Year-over-year growth 2025-2030 (%)

9.4 Analgesics - Market size and forecast 2025-2030

Chart on Analgesics - Market size and forecast 2025-2030 ($ million)
Data Table on Analgesics - Market size and forecast 2025-2030 ($ million)
Chart on Analgesics - Year-over-year growth 2025-2030 (%)
Data Table on Analgesics - Year-over-year growth 2025-2030 (%)

9.5 Cardiovascular drugs - Market size and forecast 2025-2030

Chart on Cardiovascular drugs - Market size and forecast 2025-2030 ($ million)
Data Table on Cardiovascular drugs - Market size and forecast 2025-2030 ($ million)
Chart on Cardiovascular drugs - Year-over-year growth 2025-2030 (%)
Data Table on Cardiovascular drugs - Year-over-year growth 2025-2030 (%)

9.6 Anti cancer drugs - Market size and forecast 2025-2030

Chart on Anti cancer drugs - Market size and forecast 2025-2030 ($ million)
Data Table on Anti cancer drugs - Market size and forecast 2025-2030 ($ million)
Chart on Anti cancer drugs - Year-over-year growth 2025-2030 (%)
Data Table on Anti cancer drugs - Year-over-year growth 2025-2030 (%)

9.7 Others - Market size and forecast 2025-2030

Chart on Others - Market size and forecast 2025-2030 ($ million)
Data Table on Others - Market size and forecast 2025-2030 ($ million)
Chart on Others - Year-over-year growth 2025-2030 (%)
Data Table on Others - Year-over-year growth 2025-2030 (%)

9.8 Market opportunity by Application

Market opportunity by Application ($ million)
Data Table on Market opportunity by Application ($ million)

10. Market Segmentation by End-user

10.1 Market segments

Chart on End-user - Market share 2025-2030 (%)
Data Table on End-user - Market share 2025-2030 (%)

10.2 Comparison by End-user

Chart on Comparison by End-user
Data Table on Comparison by End-user

10.3 Biotech and pharma companies - Market size and forecast 2025-2030

Chart on Biotech and pharma companies - Market size and forecast 2025-2030 ($ million)
Data Table on Biotech and pharma companies - Market size and forecast 2025-2030 ($ million)
Chart on Biotech and pharma companies - Year-over-year growth 2025-2030 (%)
Data Table on Biotech and pharma companies - Year-over-year growth 2025-2030 (%)

10.4 CMOs and CROs - Market size and forecast 2025-2030

Chart on CMOs and CROs - Market size and forecast 2025-2030 ($ million)
Data Table on CMOs and CROs - Market size and forecast 2025-2030 ($ million)
Chart on CMOs and CROs - Year-over-year growth 2025-2030 (%)
Data Table on CMOs and CROs - Year-over-year growth 2025-2030 (%)

10.5 Research laboratory - Market size and forecast 2025-2030

Chart on Research laboratory - Market size and forecast 2025-2030 ($ million)
Data Table on Research laboratory - Market size and forecast 2025-2030 ($ million)
Chart on Research laboratory - Year-over-year growth 2025-2030 (%)
Data Table on Research laboratory - Year-over-year growth 2025-2030 (%)

10.6 Market opportunity by End-user

Market opportunity by End-user ($ million)
Data Table on Market opportunity by End-user ($ million)

11. Customer Landscape

11.1 Customer landscape overview

Analysis of price sensitivity, lifecycle, customer purchase basket, adoption rates, and purchase criteria

12. Geographic Landscape

12.1 Geographic segmentation

Chart on Market share by geography 2025-2030 (%)
Data Table on Market share by geography 2025-2030 (%)

12.2 Geographic comparison

Chart on Geographic comparison
Data Table on Geographic comparison

12.3 North America - Market size and forecast 2025-2030

Chart on North America - Market size and forecast 2025-2030 ($ million)
Data Table on North America - Market size and forecast 2025-2030 ($ million)
Chart on North America - Year-over-year growth 2025-2030 (%)
Data Table on North America - Year-over-year growth 2025-2030 (%)
Chart on Regional Comparison - North America
Data Table on Regional Comparison - North America

12.3.1 US - Market size and forecast 2025-2030

Chart on US - Market size and forecast 2025-2030 ($ million)
Data Table on US - Market size and forecast 2025-2030 ($ million)
Chart on US - Year-over-year growth 2025-2030 (%)
Data Table on US - Year-over-year growth 2025-2030 (%)

12.3.2 Canada - Market size and forecast 2025-2030

Chart on Canada - Market size and forecast 2025-2030 ($ million)
Data Table on Canada - Market size and forecast 2025-2030 ($ million)
Chart on Canada - Year-over-year growth 2025-2030 (%)
Data Table on Canada - Year-over-year growth 2025-2030 (%)

12.3.3 Mexico - Market size and forecast 2025-2030

Chart on Mexico - Market size and forecast 2025-2030 ($ million)
Data Table on Mexico - Market size and forecast 2025-2030 ($ million)
Chart on Mexico - Year-over-year growth 2025-2030 (%)
Data Table on Mexico - Year-over-year growth 2025-2030 (%)

12.4 Asia - Market size and forecast 2025-2030

Chart on Asia - Market size and forecast 2025-2030 ($ million)
Data Table on Asia - Market size and forecast 2025-2030 ($ million)
Chart on Asia - Year-over-year growth 2025-2030 (%)
Data Table on Asia - Year-over-year growth 2025-2030 (%)
Chart on Regional Comparison - Asia
Data Table on Regional Comparison - Asia

12.4.1 China - Market size and forecast 2025-2030

Chart on China - Market size and forecast 2025-2030 ($ million)
Data Table on China - Market size and forecast 2025-2030 ($ million)
Chart on China - Year-over-year growth 2025-2030 (%)
Data Table on China - Year-over-year growth 2025-2030 (%)

12.4.2 India - Market size and forecast 2025-2030

Chart on India - Market size and forecast 2025-2030 ($ million)
Data Table on India - Market size and forecast 2025-2030 ($ million)
Chart on India - Year-over-year growth 2025-2030 (%)
Data Table on India - Year-over-year growth 2025-2030 (%)

12.4.3 Japan - Market size and forecast 2025-2030

Chart on Japan - Market size and forecast 2025-2030 ($ million)
Data Table on Japan - Market size and forecast 2025-2030 ($ million)
Chart on Japan - Year-over-year growth 2025-2030 (%)
Data Table on Japan - Year-over-year growth 2025-2030 (%)

12.4.4 South Korea - Market size and forecast 2025-2030

Chart on South Korea - Market size and forecast 2025-2030 ($ million)
Data Table on South Korea - Market size and forecast 2025-2030 ($ million)
Chart on South Korea - Year-over-year growth 2025-2030 (%)
Data Table on South Korea - Year-over-year growth 2025-2030 (%)

12.4.5 Indonesia - Market size and forecast 2025-2030

Chart on Indonesia - Market size and forecast 2025-2030 ($ million)
Data Table on Indonesia - Market size and forecast 2025-2030 ($ million)
Chart on Indonesia - Year-over-year growth 2025-2030 (%)
Data Table on Indonesia - Year-over-year growth 2025-2030 (%)

12.4.6 Thailand - Market size and forecast 2025-2030

Chart on Thailand - Market size and forecast 2025-2030 ($ million)
Data Table on Thailand - Market size and forecast 2025-2030 ($ million)
Chart on Thailand - Year-over-year growth 2025-2030 (%)
Data Table on Thailand - Year-over-year growth 2025-2030 (%)

12.4.7 Singapore - Market size and forecast 2025-2030

Chart on Singapore - Market size and forecast 2025-2030 ($ million)
Data Table on Singapore - Market size and forecast 2025-2030 ($ million)
Chart on Singapore - Year-over-year growth 2025-2030 (%)
Data Table on Singapore - Year-over-year growth 2025-2030 (%)

12.5 Europe - Market size and forecast 2025-2030

Chart on Europe - Market size and forecast 2025-2030 ($ million)
Data Table on Europe - Market size and forecast 2025-2030 ($ million)
Chart on Europe - Year-over-year growth 2025-2030 (%)
Data Table on Europe - Year-over-year growth 2025-2030 (%)
Chart on Regional Comparison - Europe
Data Table on Regional Comparison - Europe

12.5.1 Germany - Market size and forecast 2025-2030

Chart on Germany - Market size and forecast 2025-2030 ($ million)
Data Table on Germany - Market size and forecast 2025-2030 ($ million)
Chart on Germany - Year-over-year growth 2025-2030 (%)
Data Table on Germany - Year-over-year growth 2025-2030 (%)

12.5.2 UK - Market size and forecast 2025-2030

Chart on UK - Market size and forecast 2025-2030 ($ million)
Data Table on UK - Market size and forecast 2025-2030 ($ million)
Chart on UK - Year-over-year growth 2025-2030 (%)
Data Table on UK - Year-over-year growth 2025-2030 (%)

12.5.3 France - Market size and forecast 2025-2030

Chart on France - Market size and forecast 2025-2030 ($ million)
Data Table on France - Market size and forecast 2025-2030 ($ million)
Chart on France - Year-over-year growth 2025-2030 (%)
Data Table on France - Year-over-year growth 2025-2030 (%)

12.5.4 The Netherlands - Market size and forecast 2025-2030

Chart on The Netherlands - Market size and forecast 2025-2030 ($ million)
Data Table on The Netherlands - Market size and forecast 2025-2030 ($ million)
Chart on The Netherlands - Year-over-year growth 2025-2030 (%)
Data Table on The Netherlands - Year-over-year growth 2025-2030 (%)

12.5.5 Italy - Market size and forecast 2025-2030

Chart on Italy - Market size and forecast 2025-2030 ($ million)
Data Table on Italy - Market size and forecast 2025-2030 ($ million)
Chart on Italy - Year-over-year growth 2025-2030 (%)
Data Table on Italy - Year-over-year growth 2025-2030 (%)

12.5.6 Spain - Market size and forecast 2025-2030

Chart on Spain - Market size and forecast 2025-2030 ($ million)
Data Table on Spain - Market size and forecast 2025-2030 ($ million)
Chart on Spain - Year-over-year growth 2025-2030 (%)
Data Table on Spain - Year-over-year growth 2025-2030 (%)

12.5.7 Russia - Market size and forecast 2025-2030

Chart on Russia - Market size and forecast 2025-2030 ($ million)
Data Table on Russia - Market size and forecast 2025-2030 ($ million)
Chart on Russia - Year-over-year growth 2025-2030 (%)
Data Table on Russia - Year-over-year growth 2025-2030 (%)

12.6 Rest of World (ROW) - Market size and forecast 2025-2030

Chart on Rest of World (ROW) - Market size and forecast 2025-2030 ($ million)
Data Table on Rest of World (ROW) - Market size and forecast 2025-2030 ($ million)
Chart on Rest of World (ROW) - Year-over-year growth 2025-2030 (%)
Data Table on Rest of World (ROW) - Year-over-year growth 2025-2030 (%)
Chart on Regional Comparison - Rest of World (ROW)
Data Table on Regional Comparison - Rest of World (ROW)

12.6.1 Brazil - Market size and forecast 2025-2030

Chart on Brazil - Market size and forecast 2025-2030 ($ million)
Data Table on Brazil - Market size and forecast 2025-2030 ($ million)
Chart on Brazil - Year-over-year growth 2025-2030 (%)
Data Table on Brazil - Year-over-year growth 2025-2030 (%)

12.6.2 Australia - Market size and forecast 2025-2030

Chart on Australia - Market size and forecast 2025-2030 ($ million)
Data Table on Australia - Market size and forecast 2025-2030 ($ million)
Chart on Australia - Year-over-year growth 2025-2030 (%)
Data Table on Australia - Year-over-year growth 2025-2030 (%)

12.6.3 South Africa - Market size and forecast 2025-2030

Chart on South Africa - Market size and forecast 2025-2030 ($ million)
Data Table on South Africa - Market size and forecast 2025-2030 ($ million)
Chart on South Africa - Year-over-year growth 2025-2030 (%)
Data Table on South Africa - Year-over-year growth 2025-2030 (%)

12.6.4 UAE - Market size and forecast 2025-2030

Chart on UAE - Market size and forecast 2025-2030 ($ million)
Data Table on UAE - Market size and forecast 2025-2030 ($ million)
Chart on UAE - Year-over-year growth 2025-2030 (%)
Data Table on UAE - Year-over-year growth 2025-2030 (%)

12.6.5 Saudi Arabia - Market size and forecast 2025-2030

Chart on Saudi Arabia - Market size and forecast 2025-2030 ($ million)
Data Table on Saudi Arabia - Market size and forecast 2025-2030 ($ million)
Chart on Saudi Arabia - Year-over-year growth 2025-2030 (%)
Data Table on Saudi Arabia - Year-over-year growth 2025-2030 (%)

12.6.6 Turkey - Market size and forecast 2025-2030

Chart on Turkey - Market size and forecast 2025-2030 ($ million)
Data Table on Turkey - Market size and forecast 2025-2030 ($ million)
Chart on Turkey - Year-over-year growth 2025-2030 (%)
Data Table on Turkey - Year-over-year growth 2025-2030 (%)

12.7 Market opportunity by geography

Market opportunity by geography ($ million)
Data Tables on Market opportunity by geography ($ million)

13. Drivers, Challenges, and Opportunity

13.1 Market drivers

Rising prevalence of chronic diseases and aging global population
Growth of generic drugs industry and patent expirations
Advances in drug development and rising complexity of molecules

13.2 Market challenges

Stringent regulatory requirements and compliance burden
Supply chain vulnerabilities and geopolitical risks
Increasing environmental laws and pressure for green chemistry

13.3 Impact of drivers and challenges

Impact of drivers and challenges in 2025 and 2030

13.4 Market opportunities

Growing focus on high potency and complex intermediates
Adoption of advanced manufacturing technologies like flow chemistry
Supply chain diversification and reshoring initiatives

14. Competitive Landscape

14.1 Overview

14.2

Overview on criticality of inputs and factors of differentiation

14.3 Landscape disruption

Overview on factors of disruption

14.4 Industry risks

Impact of key risks on business

15. Competitive Analysis

15.1 Companies profiled

Companies covered

15.2 Company ranking index

15.3 Market positioning of companies

Matrix on companies position and classification

15.4 Arkema Group

Arkema Group - Overview
Arkema Group - Business segments
Arkema Group - Key news
Arkema Group - Key offerings
Arkema Group - Segment focus
SWOT

15.5 Aurobindo Pharma Ltd.

Aurobindo Pharma Ltd. - Overview
Aurobindo Pharma Ltd. - Product / Service
Aurobindo Pharma Ltd. - Key offerings
SWOT

15.6 BASF SE

BASF SE - Overview
BASF SE - Business segments
BASF SE - Key news
BASF SE - Key offerings
BASF SE - Segment focus
SWOT

15.7 Cambrex Corp.

Cambrex Corp. - Overview
Cambrex Corp. - Product / Service
Cambrex Corp. - Key offerings
SWOT

15.8 Carbogen Amcis Ltd.

Carbogen Amcis Ltd. - Overview
Carbogen Amcis Ltd. - Product / Service
Carbogen Amcis Ltd. - Key offerings
SWOT

15.9 EUROAPI S.A.

EUROAPI S.A. - Overview
EUROAPI S.A. - Product / Service
EUROAPI S.A. - Key offerings
SWOT

15.10 Evonik Industries AG

Evonik Industries AG - Overview
Evonik Industries AG - Business segments
Evonik Industries AG - Key news
Evonik Industries AG - Key offerings
Evonik Industries AG - Segment focus
SWOT

15.11 HIKAL Ltd.

HIKAL Ltd. - Overview
HIKAL Ltd. - Business segments
HIKAL Ltd. - Key offerings
HIKAL Ltd. - Segment focus
SWOT

15.12 Hovione S.A.

Hovione S.A. - Overview
Hovione S.A. - Product / Service
Hovione S.A. - Key offerings
SWOT

15.13 Lianhe Chemical Technology

Lianhe Chemical Technology - Overview
Lianhe Chemical Technology - Product / Service
Lianhe Chemical Technology - Key offerings
SWOT

15.14 Lonza Group Ltd.

Lonza Group Ltd. - Overview
Lonza Group Ltd. - Business segments
Lonza Group Ltd. - Key news
Lonza Group Ltd. - Key offerings
Lonza Group Ltd. - Segment focus
SWOT

15.15 Merck KGaA

Merck KGaA - Overview
Merck KGaA - Business segments
Merck KGaA - Key news
Merck KGaA - Key offerings
Merck KGaA - Segment focus
SWOT

15.16 Thermo Fisher Scientific Inc.

Thermo Fisher Scientific Inc. - Overview
Thermo Fisher Scientific Inc. - Business segments
Thermo Fisher Scientific Inc. - Key news
Thermo Fisher Scientific Inc. - Key offerings
Thermo Fisher Scientific Inc. - Segment focus
SWOT

15.17 Vertellus Holdings LLC

Vertellus Holdings LLC - Overview
Vertellus Holdings LLC - Product / Service
Vertellus Holdings LLC - Key offerings
SWOT

15.18 WuXi AppTec Co. Ltd.

WuXi AppTec Co. Ltd. - Overview
WuXi AppTec Co. Ltd. - Business segments
WuXi AppTec Co. Ltd. - Key offerings
WuXi AppTec Co. Ltd. - Segment focus
SWOT

16. Appendix

16.1 Scope of the report

Market definition
Objectives
Notes and caveats

16.2 Inclusions and exclusions checklist

Inclusions checklist
Exclusions checklist

16.3 Currency conversion rates for US$

16.4 Research methodology

16.5 Data procurement

Information sources

16.6 Data validation

16.7 Validation techniques employed for market sizing

16.8 Data synthesis

16.9 360 degree market analysis

16.10 List of abbreviations

Research Methodology

Technavio presents a detailed picture of the market by way of study, synthesis, and summation of data from multiple sources. The analysts have presented the various facets of the market with a particular focus on identifying the key industry influencers. The data thus presented is comprehensive, reliable, and the result of extensive research, both primary and secondary.

INFORMATION SOURCES

Primary sources

  • Manufacturers and suppliers
  • Channel partners
  • Industry experts
  • Strategic decision makers

Secondary sources

  • Industry journals and periodicals
  • Government data
  • Financial reports of key industry players
  • Historical data
  • Press releases

DATA ANALYSIS

Data Synthesis

  • Collation of data
  • Estimation of key figures
  • Analysis of derived insights

Data Validation

  • Triangulation with data models
  • Reference against proprietary databases
  • Corroboration with industry experts

REPORT WRITING

Qualitative

  • Market drivers
  • Market challenges
  • Market trends
  • Five forces analysis

Quantitative

  • Market size and forecast
  • Market segmentation
  • Geographical insights
  • Competitive landscape

Interested in this report?

Get your sample now to see our research methodology and insights!

Download Now

Frequently Asked Questions

Pharmaceutical IntermediatesMarket market growth will increase by USD 13273.6 million during 2026-2030 .

The Pharmaceutical IntermediatesMarket market is expected to grow at a CAGR of 5.7% during 2026-2030 .

Pharmaceutical IntermediatesMarket market is segmented by Type (Aromatic intermediates, Heterocyclic intermediates, Chiral intermediates, Functional group intermediates, Peptide intermediates) Application (Anti-inflammatory drugs, Analgesics, Cardiovascular drugs, Anti cancer drugs, Others) End-user (Biotech and pharma companies, CMOs and CROs, Research laboratory)

Aceto Corp., Actylis, Arkema Group, Aurobindo Pharma Ltd., BASF SE, Cambrex Corp., Carbogen Amcis Ltd., EUROAPI S.A., Evonik Industries AG, HIKAL Ltd., Hovione S.A., Interchem Pvt. Ltd., Lianhe Chemical Technology, Lonza Group Ltd., Merck KGaA, Midas Pharma GmbH, Thermo Fisher Scientific Inc., Vertellus Holdings LLC, WuXi AppTec Co. Ltd. are a few of the key vendors in the Pharmaceutical IntermediatesMarket market.

Asia will register the highest growth rate of 38% among the other regions. Therefore, the Pharmaceutical IntermediatesMarket market in Asia is expected to garner significant business opportunities for the vendors during the forecast period.

US, Canada, Mexico, China, India, Japan, South Korea, Indonesia, Thailand, Singapore, Germany, UK, France, The Netherlands, Italy, Spain, Russia, Brazil, Australia, South Africa, UAE, Saudi Arabia, Turkey

  • Rising prevalence of chronic diseases and aging global population is the driving factor this market.

The Pharmaceutical IntermediatesMarket market vendors should focus on grabbing business opportunities from the Type segment as it accounted for the largest market share in the base year.