
Pipeline Transport Market Size 2025-2029
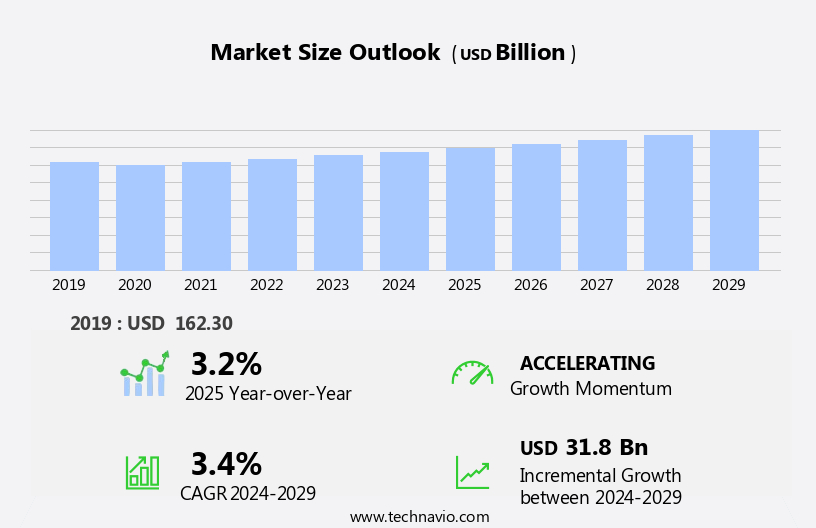
The pipeline transport market size is forecast to increase by USD 31.8 billion, at a CAGR of 3.4% between 2024 and 2029.
- The market is witnessing significant growth due to the benefits that pipelines offer over other modes of oil and gas transportation, including their efficiency, cost-effectiveness, and environmental sustainability. A notable trend in the market is the development of pipelines for transporting hydrogen, reflecting the growing importance of renewable energy sources and the transition towards a low-carbon economy. However, the market faces significant challenges, including the requirement for constant surveillance and monitoring to ensure safe and smooth transportation, as well as the high initial investment costs and regulatory complexities involved in pipeline construction and operation.
- Companies seeking to capitalize on market opportunities must address these challenges through innovative technologies and strategic partnerships, while also staying abreast of regulatory developments and market trends. Navigating these dynamics requires a deep understanding of the market landscape and a proactive approach to operational planning and risk management. This market is subject to dynamic market trends and influences, such as the increasing focus on renewable energy sources and the continued reliance on traditional fossil fuels In the energy and chemical sectors.
What will be the Size of the Pipeline Transport Market during the forecast period?
Explore in-depth regional segment analysis with market size data - historical 2019-2023 and forecasts 2025-2029 - in the full report.
Request Free Sample
The market encompasses the design, construction, operation, and maintenance of transmission, distribution, and gathering pipelines for transporting various commodities, including natural gas, oil, coal, water, chemicals, and renewable resources. The market continues to evolve, shaped by dynamic market conditions and diverse applications across various sectors. Pipeline analytics and automation play a crucial role in optimizing pipeline performance and enhancing operational efficiency. Pipeline abandonment and decommissioning are ongoing processes that impact the market's economic landscape. Environmental concerns and sustainability are increasingly shaping pipeline design and construction. Pipeline safety and insulation remain paramount, with ongoing advancements in technology and regulation. Pipeline capacity expansion and optimization are key drivers, as pipelines adapt to meet evolving energy demands. Pipeline risk assessment and permitting are complex processes, requiring intricate coordination and compliance with regulations.
Telemetry and SCADA systems facilitate real-time monitoring and control, while pipeline coating and corrosion mitigation ensure longevity. Pipeline capacity expansion and optimization are ongoing priorities, with capacity expansion projects and pipeline rehabilitation initiatives underway. Pipeline robotics and artificial intelligence are transforming pipeline maintenance and inspection, enabling more precise and efficient operations. Pipeline modeling and simulation tools enable accurate forecasting and scenario analysis, while pipeline temperature and pressure measurement provide critical data for pipeline management. Compressors and pumps are essential components of pipeline infrastructure, ensuring consistent flow and pressure. Pipeline data acquisition and security are critical, with ongoing advancements in data analytics and cybersecurity. Pipeline transportation caters to various industries, including oil & gas, chemical, and water resources, transporting liquid products like crude oil, petroleum products, coal, water, chemicals, beer, hot water, steam, drinking water, irrigation water, steel, plastic tubes, and natural gas liquids.
How is this Pipeline Transport Industry segmented?
The pipeline transport industry research report provides comprehensive data (region-wise segment analysis), with forecasts and estimates in "USD billion" for the period 2025-2029, as well as historical data from 2019-2023 for the following segments.
- Type
- Oil and gas
- Water
- Chemical and petrochemicals
- Others
- Application
- Gathering
- Transmission
- Distribution
- Feeder
- Service
- Consulting services
- Managed services
- Maintenance and support
- Geography
- North America
- US
- Canada
- Mexico
- Europe
- France
- Italy
- Russia
- Ukraine
- APAC
- China
- India
- Japan
- Rest of World (ROW)
- North America
. By Type Insights
The oil and gas segment is estimated to witness significant growth during the forecast period. The market has been shaped significantly by the oil and gas industry, experiencing both challenges and transformations. Government initiatives have been instrumental in shaping this sector. For example, in early 2023, the US Biden administration introduced stricter regulations and limitations on new oil and gas pipelines, reflecting a focus on clean energy and environmental sustainability. Conversely, government efforts to enhance infrastructure development and energy security in countries like India have led to investments in oil and gas pipelines. One notable instance is the government-backed Nord Stream 2 project in Russia, designed to enhance oil and gas transportation. Pipeline control systems and flow measurement are crucial components of pipeline infrastructure, ensuring efficient and safe operations.
Technological advancements have led to the integration of pipeline blockchain, risk assessment tools, and telemetry systems to improve security and operational efficiency. Pipeline capacity expansion is a continuous priority, with robotics, rehabilitation, and compressors playing essential roles in maintaining pipeline integrity and increasing throughput. Pipeline maintenance, including pressure measurement, temperature monitoring, and optimization, is crucial for ensuring pipeline safety and longevity. Regulatory compliance, data acquisition, and security are ongoing concerns, with analytics, automation, and artificial intelligence increasingly being employed to address these challenges. Sustainability and environmental impact assessments are also becoming increasingly important, with insulation, modeling, and corrosion management playing key roles in reducing environmental footprints. Pipeline design, construction, and decommissioning are ongoing processes in the market, with fittings, remediation, and leak detection essential components of pipeline infrastructure.
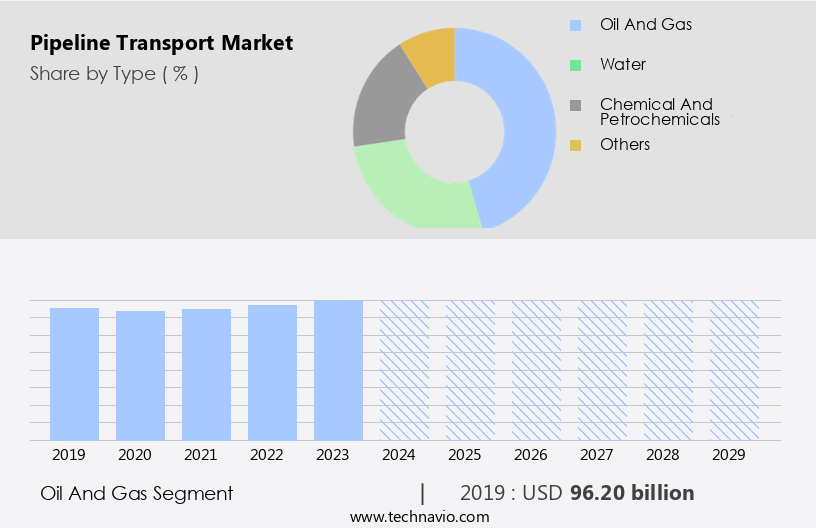
The Oil and gas segment was valued at USD 96.20 billion in 2019 and showed a gradual increase during the forecast period.
Regional Analysis
North America is estimated to contribute 57% to the growth of the global market during the forecast period. Technavio's analysts have elaborately explained the regional trends and drivers that shape the market during the forecast period.

In the global pipeline transportation market, North America held the largest share in 2024. The economic growth in countries like the US, Canada, and Mexico fueled this regional market's expansion. Government initiatives, such as the Pipeline Safety, Regulatory Certainty, and Job Creation Act of 2011, enhanced safety standards and regulatory certainty, thereby boosting investor confidence. The development of pipelines for transporting hydrogen is a promising trend in the market, as the demand for clean energy sources continues to rise. Notable projects, like the Atlantic Coast Pipeline, illustrate the ongoing efforts to strengthen energy infrastructure and cater to escalating demand. Pipeline control systems and optimization play a significant role in ensuring efficient operations. Pipeline flow measurement and telemetry enable real-time monitoring, while SCADA systems offer centralized control.
Pipeline risk assessment and security are critical components, with advanced analytics and automation ensuring continuous improvement. Pipeline maintenance, rehabilitation, and capacity expansion are ongoing priorities. Technological advancements in robotics, coating, and corrosion mitigation contribute to extended asset life. Pipeline design, pressure measurement, and temperature measurement are essential aspects of pipeline infrastructure. Pipeline regulation and permitting processes are evolving, with a focus on sustainability and environmental impact. Pipeline simulation and modeling aid in optimizing operations and minimizing risks. Pipeline safety, insulation, and inspections are crucial to maintaining the integrity of the infrastructure. Pipeline capacity expansion and decommissioning are essential for addressing changing market conditions.
Market Dynamics
Our researchers analyzed the data with 2024 as the base year, along with the key drivers, trends, and challenges. A holistic analysis of drivers will help companies refine their marketing strategies to gain a competitive advantage.
What are the key market drivers leading to the rise in the adoption of Pipeline Transport Industry?
- The significant advantages of pipelines as a mode of oil and gas transportation are the primary factors fueling market growth. Pipelines have been a vital component of the oil and gas industry for several decades, facilitating the efficient transport of large volumes of crude oil and natural gas from production sites to refineries. This intricate network of pipelines is essential for energy security and underpins the industrial sector's growth. Some key advantages of pipeline transport include its ability to transport substantial quantities of oil and gas more efficiently than alternative modes such as rail, trucks, or ships. Moreover, pipeline transport enhances safety by reducing the number of road and sea transport vehicles, thereby minimizing the risk of accidents.
- Advanced pipeline control systems, pipeline flow measurement, and pipeline telemetry enable operators to monitor and optimize pipeline performance in real-time. Additionally, pipeline risk assessment, pipeline permitting, and pipeline economic impact studies help ensure the safe and sustainable operation of pipelines. Pipeline capacity expansion is a continuous process to meet the growing energy demands. Pipeline coating, pipeline regulation, and pipeline SCADA systems are some of the critical aspects of pipeline infrastructure development and maintenance. The integration of pipeline blockchain technology further enhances pipeline security and transparency, ensuring the integrity of the oil and gas supply chain.
What are the market trends shaping the Pipeline Transport Industry?
- The development of pipelines for transporting hydrogen is an emerging market trend. This infrastructure is essential for the large-scale production and distribution of hydrogen as a clean energy source. The market is experiencing notable growth due to the increasing emphasis on pipeline rehabilitation and optimization. Pipeline robotics plays a crucial role in this regard, enabling efficient inspection and maintenance of pipelines. Pipeline temperature and pressure measurement are essential for ensuring safe and efficient operations. Advanced pipeline design, incorporating pipeline valves and compressors, enhances the overall performance of pipeline systems. Moreover, pipeline data acquisition and security are becoming increasingly important to mitigate potential risks and improve operational efficiency. The integration of pipeline data with advanced analytics and AI technologies offers valuable insights for pipeline management.
- The trend towards hydrogen transportation through pipelines is gaining momentum as hydrogen is recognized as a clean energy source essential for decarbonization. Countries are investing in hydrogen infrastructure, including the construction of hydrogen pipelines, to facilitate the transfer of hydrogen from production centers to consumption hubs. Overall, pipeline maintenance, optimization, and the adoption of innovative technologies are key drivers in the market.
What challenges does the Pipeline Transport Industry face during its growth?
- The need for continuous surveillance and monitoring is a significant challenge that necessitates substantial resources for ensuring seamless transportation operations, thereby impacting the industry's growth. Pipeline transportation is a critical mode of transporting bulk commodities such as oil and natural gas, but it requires constant monitoring to mitigate environmental concerns and ensure safety. Pipeline analytics and automation technologies are increasingly being adopted to monitor pipeline conditions in real-time, reducing the risk of leaks and potential disasters. However, pipeline abandonment is a growing concern due to aging infrastructure and increasing environmental regulations. Pipeline insulation and sustainability are also crucial factors in pipeline construction and operation. Pipeline simulation and modeling are essential tools for optimizing pipeline performance and reducing operational costs. Pipeline safety is a top priority, with stringent regulations and penalties for any damage to the environment.
- Pipeline artificial intelligence and machine learning are being integrated into pipeline systems to improve efficiency and predict potential issues before they occur. Despite these advancements, pipeline transportation faces challenges such as environmental impact and public perception. Pipeline construction and expansion projects often face opposition from local communities and environmental groups. Therefore, pipeline developers must prioritize transparency, stakeholder engagement, and sustainability to build public trust and support.
Exclusive Customer Landscape
The pipeline transport market forecasting report includes the adoption lifecycle of the market, covering from the innovator's stage to the laggard's stage. It focuses on adoption rates in different regions based on penetration. Furthermore, the pipeline transport market report also includes key purchase criteria and drivers of price sensitivity to help companies evaluate and develop their market growth analysis strategies.

Customer Landscape
Key Companies & Market Insights
Companies are implementing various strategies, such as strategic alliances, pipeline transport market forecast, partnerships, mergers and acquisitions, geographical expansion, and product/service launches, to enhance their presence in the industry.
ABB Ltd. - The company specializes in pipeline transport solutions for the oil and gas industry, leveraging automation, electrification, and digital technologies to enhance pipeline operations.
The industry research and growth report includes detailed analyses of the competitive landscape of the market and information about key companies, including:
- ABB Ltd.
- China National Petroleum Corp.
- ConocoPhillips
- Emerson Electric Co.
- Enbridge Inc.
- Energy Transfer LP
- Enterprise Products Partners LP
- General Electric Co.
- Huawei Technologies Co. Ltd.
- Indian Oil Corp. Ltd.
- Inter Pipeline Ltd.
- Kinder Morgan Inc.
- ONEOK Inc.
- Plains All American Pipeline
- Rockwell Automation Inc.
- Shell plc
- Siemens Energy AG
- TechnipFMC plc
- TransCanada PipeLines Ltd.
- West Shore Pipe Line Co.
Qualitative and quantitative analysis of companies has been conducted to help clients understand the wider business environment as well as the strengths and weaknesses of key industry players. Data is qualitatively analyzed to categorize companies as pure play, category-focused, industry-focused, and diversified; it is quantitatively analyzed to categorize companies as dominant, leading, strong, tentative, and weak.
Recent Development and News in Pipeline Transport Market
- In February 2024, Shell and Qatar Petroleum announced a strategic collaboration to develop the Pearl Gas-to-Liquids (GTL) project in Qatar, expanding the pipeline transport capacity for natural gas and increasing the production of liquefied natural gas (LNG) (Shell press release, 2024). This partnership represents a significant investment in the market, with an estimated project value of USD 11 billion.
- In July 2024, Enbridge Inc. completed the acquisition of the 50% stake in the Bayou Bridge Pipeline from Energy Transfer LP, solidifying its position as a major player in the market for crude oil in the United States (Enbridge press release, 2024). The acquisition strengthened Enbridge's presence in the Gulf Coast region and increased its pipeline network's capacity by approximately 610,000 barrels per day.
- In March 2025, the European Commission approved the Nord Stream 2 pipeline project, allowing the construction of the natural gas pipeline from Russia to Germany to proceed (European Commission press release, 2025). This approval, despite political opposition, signifies a significant geographic expansion in the market and will enable the transport of an additional 55 billion cubic meters of natural gas per year.
- In May 2025, Plains All American Pipelines announced the successful deployment of its advanced pipeline monitoring system, utilizing artificial intelligence and machine learning technologies to enhance pipeline safety and efficiency (Plains All American Pipelines press release, 2025). This technological advancement represents a significant shift in the market, as companies increasingly focus on implementing smart technologies to optimize operations and minimize risks.
Research Analyst Overview
- In the market, safety and integrity are paramount. Pipeline Cyber Security and Data Security are crucial aspects, as digital threats can disrupt operations and compromise sensitive information. Pipeline Risk Management strategies employ Pipeline GIS for situational awareness, while Pipeline BIM and 3D Modeling facilitate efficient design and planning. Pipeline Commissioning and Startup require meticulous attention, with Hydrostatic Testing and Inline Inspection ensuring structural integrity. Pipeline Predictive Maintenance, Fracture Mechanics, and Fatigue Analysis prevent unexpected failures. Pipeline Spill Prevention and Response plans are essential, as are regulatory compliance measures.
-
The Pipeline Transport Market is evolving rapidly with advancements in pipeline automation and efficiency-driven pipeline optimization strategies. Ensuring structural integrity through pipeline inspection and managing risks like pipeline corrosion are critical for maintaining safety and reliability. Technologies such as pipeline compressors, pipeline pressure measurement, and pipeline temperature measurement help regulate flow and enhance performance. As the industry considers pipeline decommissioning, efforts in pipeline remediation focus on restoring affected areas while mitigating pipeline environmental impact and addressing pipeline social impact.
-
The Pipeline Transport Market is advancing with innovations in pipeline asset management, ensuring efficiency and longevity. Digital tools like pipeline CAD and pipeline D modeling enhance design precision, while pipeline remote monitoring and pipeline condition assessment improve real-time operations. Protective measures such as pipeline cathodic protection and pipeline anodic protection mitigate corrosion risks. Structural integrity is maintained through pipeline stress analysis, pipeline fatigue analysis, and pipeline fracture mechanics. Quality assurance in pipeline welding, pipeline coating application, and pipeline insulation application strengthens durability. Operational protocols for pipeline startup, pipeline shutdown, pipeline emergency response, and pipeline spill response ensure safety. Adherence to pipeline regulatory compliance and securing pipeline data security remain critical for sustainable industry growth.
- Cathodic Protection and Coating Application safeguard against corrosion, while Pigging Operations and Non-Destructive Testing reveal hidden issues. Pipeline Integrity Management encompasses stress analysis, emergency response, and asset management. Remote Monitoring technologies enable real-time surveillance, enhancing overall operational efficiency.
Dive into Technavio's robust research methodology, blending expert interviews, extensive data synthesis, and validated models for unparalleled Pipeline Transport Market insights. See full methodology.
|
Market Scope |
|
|
Report Coverage |
Details |
|
Page number |
227 |
|
Base year |
2024 |
|
Historic period |
2019-2023 |
|
Forecast period |
2025-2029 |
|
Growth momentum & CAGR |
Accelerate at a CAGR of 3.4% |
|
Market growth 2025-2029 |
USD 31.8 billion |
|
Market structure |
Fragmented |
|
YoY growth 2024-2025(%) |
3.2 |
|
Key countries |
US, Canada, Russia, China, Japan, India, Ukraine, Mexico, France, and Italy |
|
Competitive landscape |
Leading Companies, Market Positioning of Companies, Competitive Strategies, and Industry Risks |
What are the Key Data Covered in this Pipeline Transport Market Research and Growth Report?
- CAGR of the Pipeline Transport industry during the forecast period
- Detailed information on factors that will drive the growth and forecasting between 2025 and 2029
- Precise estimation of the size of the market and its contribution of the industry in focus to the parent market
- Accurate predictions about upcoming growth and trends and changes in consumer behaviour
- Growth of the market across North America, Europe, APAC, Middle East and Africa, and South America
- Thorough analysis of the market's competitive landscape and detailed information about companies
- Comprehensive analysis of factors that will challenge the pipeline transport market growth of industry companies
We can help! Our analysts can customize this pipeline transport market research report to meet your requirements.
 RIA -
RIA - 
