Plasma Protease C1 Inhibitor Market Analysis North America, Europe, Asia, Rest of World (ROW) - US, Germany, UK, China, Japan - Size and Forecast 2024-2028

Plasma Protease C1 Inhibitor Market Analysis North America, Europe, Asia, Rest of World (ROW) - US, Germany, UK, China, Japan - Size and Forecast 2024-2028

Published: Jan 2024 166 Pages SKU: IRTNTR72978

Market Overview at a Glance

$2 B
Market Opportunity
7.55%
CAGR
7.12
YoY growth 2023-2024(%)

Plasma Protease C1 Inhibitor Market Size 2024-2028 

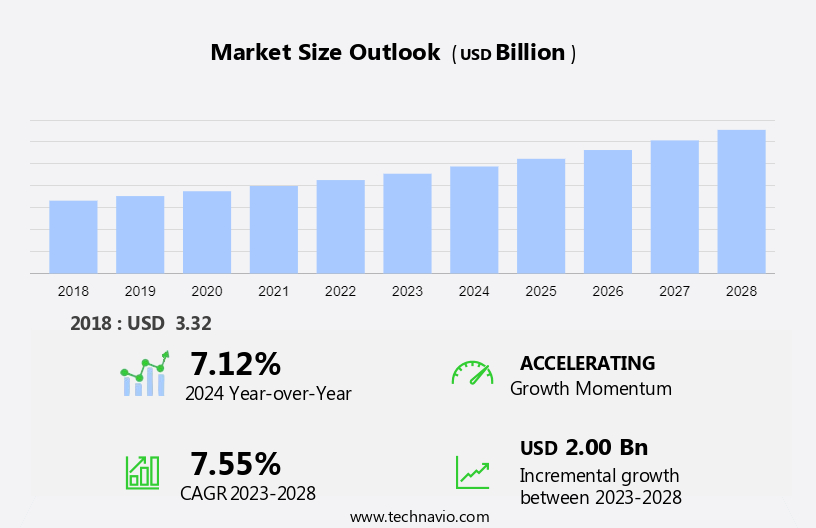
The plasma protease C1 inhibitor market size is forecast to increase by USD 2.00 billion at a CAGR of 7.55% between 2023 and 2028.

  • The market is witnessing significant growth due to the increasing research and development in this field. The growing adoption of bradykinin B2 receptor antagonists as effective treatments for various conditions, such as hereditary angioedema and paroxysmal nocturnal hemoglobinuria, is driving market expansion. However, the high cost and complex treatment procedures associated with plasma protease C1 inhibitors remain challenges for market growth. Despite these obstacles, the potential benefits of these therapies in improving patient outcomes and quality of life are expected to fuel market demand. The market analysis also covers emerging trends, such as the development of biosimilars and the exploration of alternative delivery methods, which are poised to disrupt the market landscape. Overall, the market is anticipated to experience steady growth In the coming years, driven by advancements in technology and the increasing prevalence of diseases that can be treated with these therapies.

What will be the Plasma Protease C1 Inhibitor Market Size During the Forecast Period?

Plasma Protease C1 Inhibitor Market Size

 Request Free Sample

  • The market caters to the growing demand for treatments targeting inflammatory diseases, particularly those involving the complement and contact systems. Key conditions include sepsis and septic shock, where endotoxins trigger a cascade of inflammatory responses, leading to the activation of C1, C5a, bradykinin, and other mediators. Plasma Protease C1 Inhibitor plays a crucial role in inhibiting these proteases, thereby controlling the inflammatory response. The Serpin family, specifically C1-inh, is a vital component of the classical pathway, coagulation system, kinin system, and fibrinolytic system. Deficiencies in C1-inh lead to hereditary and acquired angioedema, characterized by symptoms such as swelling In the subcutaneous tissue, gastrointestinal mucosa, and upper respiratory tract.
  • Moreover, replacement therapy using anti-plasmin agents is a common treatment approach. The market dynamics for Plasma Protease C1 Inhibitor are influenced by ongoing research and development efforts, regulatory approvals, and increasing awareness of inflammatory diseases. The trend towards personalized medicine and e-commerce platforms may also impact market growth. Despite this, challenges such as high production costs and the emergence of alternative therapies persist.

How is this Plasma Protease C1 Inhibitor Industry segmented and which is the largest segment?

The plasma protease C1 inhibitor industry research report provides comprehensive data (region-wise segment analysis), with forecasts and estimates in "USD billion" for the period 2024-2028, as well as historical data from 2018-2022 for the following segments.

  • End-user
    • Hospital pharmacy
    • Retail pharmacy
    • Online pharmacy
  • Product
    • Lyophilized
    • Injectable
  • Geography
    • North America
      • US
    • Europe
      • Germany
      • UK
    • Asia
      • China
      • Japan
    • Rest of World (ROW)

By End-user Insights

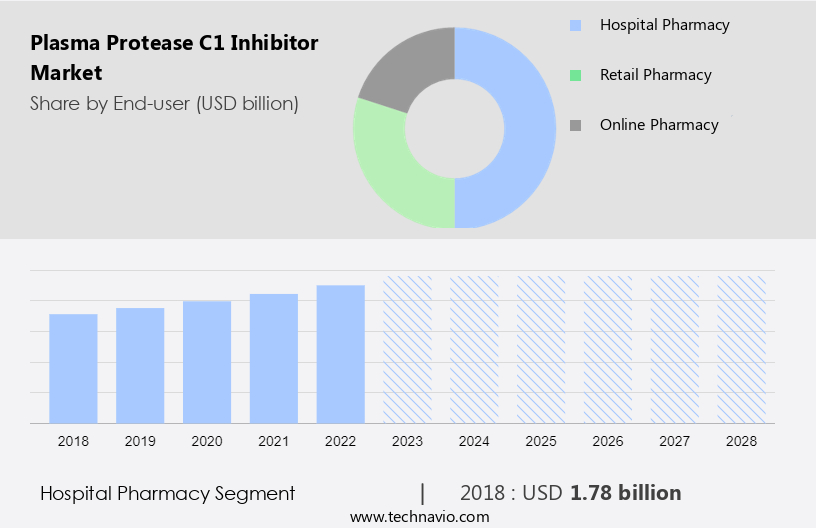
  • The hospital pharmacy segment is estimated to witness significant growth during the forecast period.

The hospital pharmacy segment holds a significant position In the market due to the increasing prevalence of C1-INH deficiency, particularly hereditary angioedema. This condition necessitates the regular use of plasma protease C1 inhibitors for symptom management. Hospital pharmacies play a vital role in procuring, storing, and dispensing these medications to patients. The growing number of HAE diagnoses worldwide fuels the demand for plasma protease C1 inhibitors, providing an opportunity for hospital pharmacies to cater to the medication needs of these patients. Moreover, hospital pharmacies ensure the accessibility and availability of these essential medications for HAE patients.

Plasma Protease C1 Inhibitor Market Size

Get a glance at the  Plasma Protease C1 Inhibitor Industry report of share of various segments Request Free Sample

The hospital pharmacy segment was valued at USD 1.78 billion in 2018 and showed a gradual increase during the forecast period.

Regional Analysis

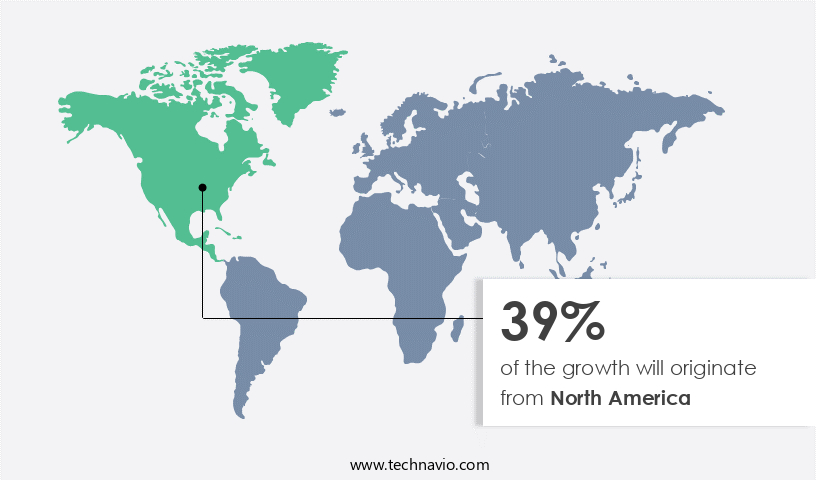
  • North America is estimated to contribute 39% to the growth of the global market during the forecast period.

Technavio's analysts have elaborately explained the regional trends and drivers that shape the market during the forecast period.

Plasma Protease C1 Inhibitor Market Share by Geography

For more insights on the market share of various regions, Request Free Sample

The market is significantly driven by the rising prevalence of inflammatory diseases, such as hereditary angioedema (HAE), and increasing research and development investments. North America dominates this market due to a well-established healthcare infrastructure and the presence of major market participants offering effective treatment options for HAE patients. Organizations like the US Hereditary Angioedema Association are dedicated to providing access to the latest treatments and support for patients. Recent studies, such as one published In the National Library of Medicine, evaluate HAE management and new treatment options' impact on physician practice patterns. The complement system and contact system play crucial roles in protease inhibition, and endotoxin naturally triggers the inflammatory response, further increasing market demand. Overall, the market is poised for growth due to these factors.

Market Dynamics

Our plasma protease C1 inhibitor market researchers analyzed the data with 2023 as the base year, along with the key drivers, trends, and challenges. A holistic analysis of drivers will help companies refine their marketing strategies to gain a competitive advantage.

What are the key market drivers leading to the rise In the adoption of Plasma Protease C1 Inhibitor Industry?

Increasing research and development in plasma protease C1 inhibitor is the key driver of the market.

  • The market is projected to expand due to the growing focus of biopharmaceutical companies on developing effective treatments for inflammatory diseases, such as hereditary angioedema (HAE) and diabetic macular edema (DME), using plasma protease C1 inhibitor drugs. The complement system and contact system play crucial roles In the pathogenesis of these conditions, and plasma protease C1 inhibitor functions as a key regulator of these systems through protease inhibition. Kallikrein inhibitor medicines are currently In the preclinical and clinical stages of development.
  • Furthermore, plasma protease C1 inhibitor deficiency results In the activation of the complement system, coagulation system, and kinin system, leading to angioedema symptoms such as swelling of the subcutaneous tissue, gastrointestinal mucosa, and upper respiratory tract. Plasma protease C1 inhibitor is a serine protease inhibitor that plays a significant role in regulating various plasma enzyme systems, including the classical pathway, coagulation system, and fibrinolytic system. The activation of these systems results In the formation of C1-INH complexes and activation complexes, which can be detected through ELISA. The molecular background of plasma protease C1 inhibitor deficiency involves the dysregulation of these systems, leading to the release of endotoxins, selectins, and autoantibodies.

What are the market trends shaping the Plasma Protease C1 Inhibitor Industry?

Growing adoption of bradykinin B2 receptor antagonist is the upcoming market trend.

  • Plasma protease C1 inhibitors serve a vital function in regulating the complement and contact systems, which are crucial In the production of the inflammatory mediator, bradykinin. However, insufficient levels of these inhibitors can lead to uncontrolled bradykinin release, resulting in inflammatory conditions such as angioedema. In particular, hereditary angioedema (HAE) is characterized by C1-INH deficiency, leading to the activation of the complement and contact systems and subsequent bradykinin production. This results in symptoms such as swelling of the subcutaneous tissue, gastrointestinal mucosa, and upper respiratory tract. To manage HAE attacks and prevent future episodes, Bradykinin B2 receptor antagonists have gained significant attention In the market.
  • In addition, these antagonists inhibit the activation of B2 receptors by bradykinin, thereby mitigating angioedema symptoms. The complement system, coagulation system, and fibrinolytic system are all involved In the pathogenesis of angioedema, and plasma protease C1 inhibitors play a crucial role In their regulation. Plasma concentrations of C1-INH and the presence of C1-INH complexes and activation complexes are essential markers in diagnosing HAE. The molecular background of HAE involves the dysregulation of the complement and contact systems, leading to the production of pro-inflammatory cytokines, endotoxins, and autoantibodies. The plasma enzyme systems, including plasmin, antiplasmin agents, and serine protease inhibitors, are also implicated In the pathogenesis of angioedema.

What challenges does the Plasma Protease C1 Inhibitor Industry face during its growth?

High cost and complex treatment of plasma protease C1 inhibitor is a key challenge affecting the industry growth.

  • Plasma protease C1 inhibitor (C1-INH) is an essential anti-inflammatory protein involved In the regulation of various systems, including the complement system, contact system, coagulation system, and kinin system. Its primary function is protease inhibition, which plays a crucial role in preventing the activation of key enzymes such as plasma kallikrein, thrombin, and plasmin. C1-INH deficiency can lead to inflammatory diseases, including sepsis and septic shock, as well as hereditary and acquired angioedema. Angioedema symptoms, such as swelling of the subcutaneous tissue In the upper respiratory tract and gastrointestinal mucosa, can be debilitating and potentially life-threatening. Replacement therapy is often necessary during symptom-free periods to prevent HAE attacks.
  • Furthermore, C1-INH functions as a serine protease inhibitor, regulating the pathogenesis of these conditions by modulating the activation of the complement and coagulation systems. Despite the benefits of C1-INH replacement therapy, it comes with challenges. The risk of blood-borne diseases, such as HIV, hepatitis B, and hepatitis C, is a concern due to the use of plasma-derived products. Although primary blood screening is performed, the risk of infection transmission during transfusion remains significant due to various pathogen strains, blood purification-resistant pathogens, and the threat of new viruses. In the US market, the demand for C1-INH replacement therapies continues to grow, driven by the increasing prevalence of inflammatory diseases and the need for effective treatments.

Exclusive Customer Landscape

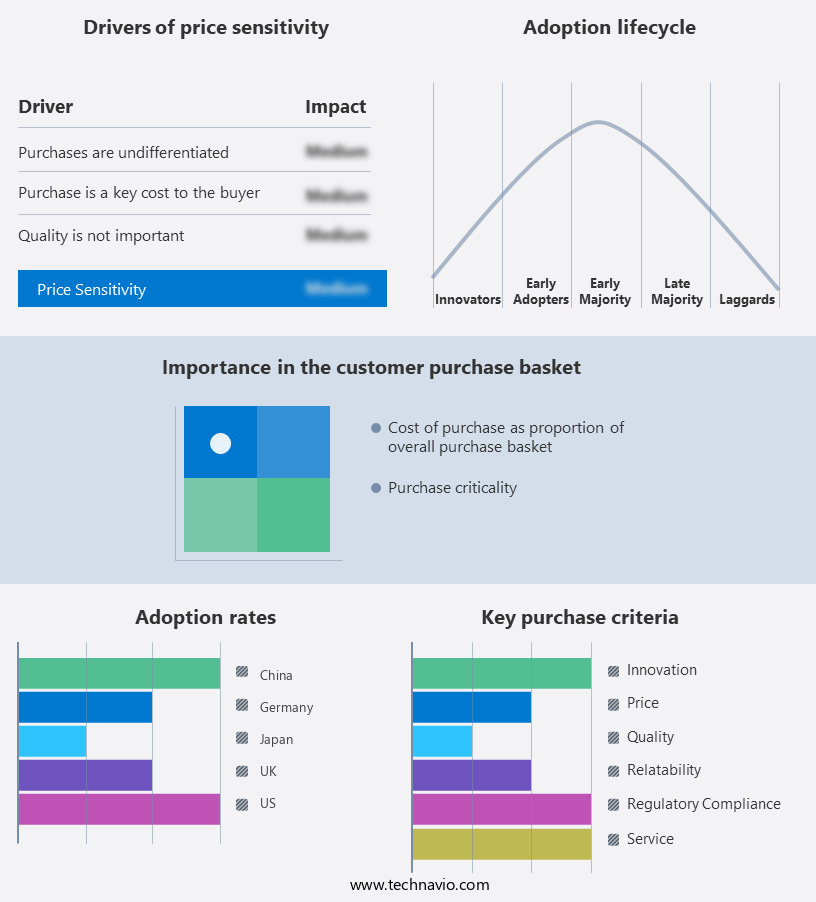
The plasma protease c1 inhibitor market forecasting report includes the adoption lifecycle of the market, covering from the innovator's stage to the laggard's stage. It focuses on adoption rates in different regions based on penetration. Furthermore, the plasma protease c1 inhibitor market report also includes key purchase criteria and drivers of price sensitivity to help companies evaluate and develop their market growth analysis strategies.

Plasma Protease C1 Inhibitor Market Share by Geography

 Customer Landscape

Key Companies & Market Insights

Companies are implementing various strategies, such as strategic alliances, plasma protease c1 inhibitor market forecast, partnerships, mergers and acquisitions, geographical expansion, and product/service launches, to enhance their presence In the industry.

The industry research and growth report includes detailed analyses of the competitive landscape of the market and information about key companies, including:

  • AbbVie Inc.
  • AstraZeneca Plc
  • Bausch Health Companies Inc.
  • Bio Techne Corp.
  • BioCryst Pharmaceuticals Inc.
  • Biosynth Ltd.
  • Bristol Myers Squibb Co.
  • Cayman Chemical
  • CSL Ltd.
  • FibroGen Inc.
  • Fresenius SE and Co. KGaA
  • Gilead Sciences Inc.
  • Ionis Pharmaceuticals Inc.
  • KalVista Pharmaceuticals Inc.
  • Merck KGaA
  • Novartis AG
  • Pharming Group NV
  • Sino Biological Inc.
  • Takeda Pharmaceutical Co. Ltd.
  • Thermo Fisher Scientific Inc.
  • Vertex Pharmaceuticals Inc.

Qualitative and quantitative analysis of companies has been conducted to help clients understand the wider business environment as well as the strengths and weaknesses of key industry players. Data is qualitatively analyzed to categorize companies as pure play, category-focused, industry-focused, and diversified; it is quantitatively analyzed to categorize companies as dominant, leading, strong, tentative, and weak.

Research Analyst Overview

The plasma protease C1 inhibitor (C1-INH) is a crucial component of the human body's defense system against inflammation and coagulation. This protein plays a pivotal role in regulating various physiological processes, including the complement system, contact system, and coagulation system. C1-INH functions as a serine protease inhibitor, preventing the activation of complement components C1r and C1s, and regulating the contact system by inhibiting plasma kallikrein and factor XIIa. In the coagulation system, C1-INH acts as a cofactor for activated protein C (APC) and inhibits the activation of factor Va and VIIIa.

Moreover, inflammatory diseases, such as sepsis and septic shock, are characterized by an excessive activation of the complement system and coagulation cascade. C1-INH deficiency can lead to uncontrolled activation of these systems, resulting in various complications, including angioedema, thrombosis, and hemorrhage. The complement system is a critical part of the innate immune response, and its dysregulation can lead to the development of inflammatory diseases. Endotoxins, such as lipopolysaccharides (LPS), can activate the complement system, leading to the production of anaphylatoxins and the recruitment of inflammatory cells to the site of infection. C1-INH plays a crucial role in regulating this response by inhibiting the activation of the complement system's classical pathway.

In addition, the contact system, another pathway of the coagulation cascade, is also regulated by C1-INH. The contact system is activated upon interaction between blood and surfaces, leading to the generation of bradykinin and the initiation of the coagulation cascade. C1-INh inhibits the activation of plasma kallikrein, a key enzyme In the contact system, preventing the excessive production of bradykinin and the subsequent coagulation response. The pathogenesis of inflammatory diseases, such as hereditary angioedema (HAE) and acquired angioedema (AAE), is characterized by a deficiency or dysfunction of C1-INH. In HAE, the deficiency is caused by mutations In the C1-INH gene, leading to a reduced production of functional C1-INH.

Furthermore, in AAE, the dysfunction is caused by the formation of C1-INH autoantibodies, which neutralize the functional activity of C1-INH. The symptoms of angioedema, a common complication of C1-INH deficiency, can affect various parts of the body, including the subcutaneous tissue, gastrointestinal mucosa, and upper respiratory tract. Symptoms can range from mild swelling to life-threatening airway obstruction. Replacement therapy with C1-INH is an effective treatment for these conditions, preventing the symptoms and reducing the risk of complications. Plasma enzyme systems, such as plasmin and antiplasmin agents, also play a role In the regulation of the coagulation system. Plasmin is a proteolytic enzyme that degrades fibrin clots, while antiplasmin agents inhibit its activity.

Plasma Protease C1 Inhibitor Market Scope

Report Coverage

Details

Page number

166

Base year

2023

Historic period

2018-2022

Forecast period

2024-2028

Growth momentum & CAGR

Accelerate at a CAGR of 7.55%

Market growth 2024-2028

USD 2.00 billion

Market structure

Fragmented

YoY growth 2023-2024(%)

7.12

Key countries

US, Germany, UK, China, and Japan

Competitive landscape

Leading Companies, market growth and forecasting , Market Positioning of Companies, Competitive Strategies, and Industry Risks

Request Free Sample

What are the Key Data Covered in this Plasma Protease C1 Inhibitor Market Research and Growth Report?

  • CAGR of the Plasma Protease C1 Inhibitor industry during the forecast period
  • Detailed information on factors that will drive the Plasma Protease C1 Inhibitor growth and forecasting between 2024 and 2028
  • Precise estimation of the size of the market and its contribution of the industry in focus to the parent market
  • Accurate predictions about upcoming growth and trends and changes in consumer behaviour
  • Growth of the market across North America, Europe, Asia, and Rest of World (ROW)
  • Thorough analysis of the market's competitive landscape and detailed information about companies
  • Comprehensive analysis of factors that will challenge the plasma protease c1 inhibitor market growth of industry companies

We can help! Our analysts can customize this plasma protease c1 inhibitor market research report to meet your requirements.

Get in touch

1 Executive Summary

  • 1.1 Market overview
    • Exhibit 01: Executive Summary – Chart on Market Overview
    • Exhibit 02: Executive Summary – Data Table on Market Overview
    • Exhibit 03: Executive Summary – Chart on Global Market Characteristics
    • Exhibit 04: Executive Summary – Chart on Market by Geography
    • Exhibit 05: Executive Summary – Chart on Market Segmentation by End-user
    • Exhibit 06: Executive Summary – Chart on Market Segmentation by Product
    • Exhibit 07: Executive Summary – Chart on Incremental Growth
    • Exhibit 08: Executive Summary – Data Table on Incremental Growth
    • Exhibit 09: Executive Summary – Chart on Vendor Market Positioning

2 Market Landscape

  • 2.1 Market ecosystem
    • Exhibit 10: Parent market
    • Exhibit 11: Market Characteristics

3 Market Sizing

  • 3.1 Market definition
    • Exhibit 12: Offerings of vendors included in the market definition
  • 3.2 Market segment analysis
    • Exhibit 13: Market segments
  • 3.3 Market size 2023
    • 3.4 Market outlook: Forecast for 2023-2028
      • Exhibit 14: Chart on Global - Market size and forecast 2023-2028 ($ billion)
      • Exhibit 15: Data Table on Global - Market size and forecast 2023-2028 ($ billion)
      • Exhibit 16: Chart on Global Market: Year-over-year growth 2023-2028 (%)
      • Exhibit 17: Data Table on Global Market: Year-over-year growth 2023-2028 (%)

    4 Historic Market Size

    • 4.1 Global plasma protease C1 inhibitor market 2018 - 2022
      • Exhibit 18: Historic Market Size – Data Table on global plasma protease c1 inhibitor market 2018 - 2022 ($ billion)
    • 4.2 End-user Segment Analysis 2018 - 2022
      • Exhibit 19: Historic Market Size – End-user Segment 2018 - 2022 ($ billion)
    • 4.3 Product Segment Analysis 2018 - 2022
      • Exhibit 20: Historic Market Size – Product Segment 2018 - 2022 ($ billion)
    • 4.4 Geography Segment Analysis 2018 - 2022
      • Exhibit 21: Historic Market Size – Geography Segment 2018 - 2022 ($ billion)
    • 4.5 Country Segment Analysis 2018 - 2022
      • Exhibit 22: Historic Market Size – Country Segment 2018 - 2022 ($ billion)

    5 Five Forces Analysis

    • 5.1 Five forces summary
      • Exhibit 23: Five forces analysis - Comparison between 2023 and 2028
    • 5.2 Bargaining power of buyers
      • Exhibit 24: Chart on Bargaining power of buyers – Impact of key factors 2023 and 2028
    • 5.3 Bargaining power of suppliers
      • Exhibit 25: Bargaining power of suppliers – Impact of key factors in 2023 and 2028
    • 5.4 Threat of new entrants
      • Exhibit 26: Threat of new entrants – Impact of key factors in 2023 and 2028
    • 5.5 Threat of substitutes
      • Exhibit 27: Threat of substitutes – Impact of key factors in 2023 and 2028
    • 5.6 Threat of rivalry
      • Exhibit 28: Threat of rivalry – Impact of key factors in 2023 and 2028
    • 5.7 Market condition
      • Exhibit 29: Chart on Market condition - Five forces 2023 and 2028

    6 Market Segmentation by End-user

    • 6.1 Market segments
      • Exhibit 30: Chart on End-user - Market share 2023-2028 (%)
      • Exhibit 31: Data Table on End-user - Market share 2023-2028 (%)
    • 6.2 Comparison by End-user
      • Exhibit 32: Chart on Comparison by End-user
      • Exhibit 33: Data Table on Comparison by End-user
    • 6.3 Hospital pharmacy - Market size and forecast 2023-2028
      • Exhibit 34: Chart on Hospital pharmacy - Market size and forecast 2023-2028 ($ billion)
      • Exhibit 35: Data Table on Hospital pharmacy - Market size and forecast 2023-2028 ($ billion)
      • Exhibit 36: Chart on Hospital pharmacy - Year-over-year growth 2023-2028 (%)
      • Exhibit 37: Data Table on Hospital pharmacy - Year-over-year growth 2023-2028 (%)
    • 6.4 Retail pharmacy - Market size and forecast 2023-2028
      • Exhibit 38: Chart on Retail pharmacy - Market size and forecast 2023-2028 ($ billion)
      • Exhibit 39: Data Table on Retail pharmacy - Market size and forecast 2023-2028 ($ billion)
      • Exhibit 40: Chart on Retail pharmacy - Year-over-year growth 2023-2028 (%)
      • Exhibit 41: Data Table on Retail pharmacy - Year-over-year growth 2023-2028 (%)
    • 6.5 Online pharmacy - Market size and forecast 2023-2028
      • Exhibit 42: Chart on Online pharmacy - Market size and forecast 2023-2028 ($ billion)
      • Exhibit 43: Data Table on Online pharmacy - Market size and forecast 2023-2028 ($ billion)
      • Exhibit 44: Chart on Online pharmacy - Year-over-year growth 2023-2028 (%)
      • Exhibit 45: Data Table on Online pharmacy - Year-over-year growth 2023-2028 (%)
    • 6.6 Market opportunity by End-user
      • Exhibit 46: Market opportunity by End-user ($ billion)
      • Exhibit 47: Data Table on Market opportunity by End-user ($ billion)

    7 Market Segmentation by Product

    • 7.1 Market segments
      • Exhibit 48: Chart on Product - Market share 2023-2028 (%)
      • Exhibit 49: Data Table on Product - Market share 2023-2028 (%)
    • 7.2 Comparison by Product
      • Exhibit 50: Chart on Comparison by Product
      • Exhibit 51: Data Table on Comparison by Product
    • 7.3 Lyophilized - Market size and forecast 2023-2028
      • Exhibit 52: Chart on Lyophilized - Market size and forecast 2023-2028 ($ billion)
      • Exhibit 53: Data Table on Lyophilized - Market size and forecast 2023-2028 ($ billion)
      • Exhibit 54: Chart on Lyophilized - Year-over-year growth 2023-2028 (%)
      • Exhibit 55: Data Table on Lyophilized - Year-over-year growth 2023-2028 (%)
    • 7.4 Injectable - Market size and forecast 2023-2028
      • Exhibit 56: Chart on Injectable - Market size and forecast 2023-2028 ($ billion)
      • Exhibit 57: Data Table on Injectable - Market size and forecast 2023-2028 ($ billion)
      • Exhibit 58: Chart on Injectable - Year-over-year growth 2023-2028 (%)
      • Exhibit 59: Data Table on Injectable - Year-over-year growth 2023-2028 (%)
    • 7.5 Market opportunity by Product
      • Exhibit 60: Market opportunity by Product ($ billion)
      • Exhibit 61: Data Table on Market opportunity by Product ($ billion)

    8 Customer Landscape

    • 8.1 Customer landscape overview
      • Exhibit 62: Analysis of price sensitivity, lifecycle, customer purchase basket, adoption rates, and purchase criteria

    9 Geographic Landscape

    • 9.1 Geographic segmentation
      • Exhibit 63: Chart on Market share by geography 2023-2028 (%)
      • Exhibit 64: Data Table on Market share by geography 2023-2028 (%)
    • 9.2 Geographic comparison
      • Exhibit 65: Chart on Geographic comparison
      • Exhibit 66: Data Table on Geographic comparison
    • 9.3 North America - Market size and forecast 2023-2028
      • Exhibit 67: Chart on North America - Market size and forecast 2023-2028 ($ billion)
      • Exhibit 68: Data Table on North America - Market size and forecast 2023-2028 ($ billion)
      • Exhibit 69: Chart on North America - Year-over-year growth 2023-2028 (%)
      • Exhibit 70: Data Table on North America - Year-over-year growth 2023-2028 (%)
    • 9.4 Europe - Market size and forecast 2023-2028
      • Exhibit 71: Chart on Europe - Market size and forecast 2023-2028 ($ billion)
      • Exhibit 72: Data Table on Europe - Market size and forecast 2023-2028 ($ billion)
      • Exhibit 73: Chart on Europe - Year-over-year growth 2023-2028 (%)
      • Exhibit 74: Data Table on Europe - Year-over-year growth 2023-2028 (%)
    • 9.5 Asia - Market size and forecast 2023-2028
      • Exhibit 75: Chart on Asia - Market size and forecast 2023-2028 ($ billion)
      • Exhibit 76: Data Table on Asia - Market size and forecast 2023-2028 ($ billion)
      • Exhibit 77: Chart on Asia - Year-over-year growth 2023-2028 (%)
      • Exhibit 78: Data Table on Asia - Year-over-year growth 2023-2028 (%)
    • 9.6 Rest of World (ROW) - Market size and forecast 2023-2028
      • Exhibit 79: Chart on Rest of World (ROW) - Market size and forecast 2023-2028 ($ billion)
      • Exhibit 80: Data Table on Rest of World (ROW) - Market size and forecast 2023-2028 ($ billion)
      • Exhibit 81: Chart on Rest of World (ROW) - Year-over-year growth 2023-2028 (%)
      • Exhibit 82: Data Table on Rest of World (ROW) - Year-over-year growth 2023-2028 (%)
    • 9.7 US - Market size and forecast 2023-2028
      • Exhibit 83: Chart on US - Market size and forecast 2023-2028 ($ billion)
      • Exhibit 84: Data Table on US - Market size and forecast 2023-2028 ($ billion)
      • Exhibit 85: Chart on US - Year-over-year growth 2023-2028 (%)
      • Exhibit 86: Data Table on US - Year-over-year growth 2023-2028 (%)
    • 9.8 Germany - Market size and forecast 2023-2028
      • Exhibit 87: Chart on Germany - Market size and forecast 2023-2028 ($ billion)
      • Exhibit 88: Data Table on Germany - Market size and forecast 2023-2028 ($ billion)
      • Exhibit 89: Chart on Germany - Year-over-year growth 2023-2028 (%)
      • Exhibit 90: Data Table on Germany - Year-over-year growth 2023-2028 (%)
    • 9.9 UK - Market size and forecast 2023-2028
      • Exhibit 91: Chart on UK - Market size and forecast 2023-2028 ($ billion)
      • Exhibit 92: Data Table on UK - Market size and forecast 2023-2028 ($ billion)
      • Exhibit 93: Chart on UK - Year-over-year growth 2023-2028 (%)
      • Exhibit 94: Data Table on UK - Year-over-year growth 2023-2028 (%)
    • 9.10 China - Market size and forecast 2023-2028
      • Exhibit 95: Chart on China - Market size and forecast 2023-2028 ($ billion)
      • Exhibit 96: Data Table on China - Market size and forecast 2023-2028 ($ billion)
      • Exhibit 97: Chart on China - Year-over-year growth 2023-2028 (%)
      • Exhibit 98: Data Table on China - Year-over-year growth 2023-2028 (%)
    • 9.11 Japan - Market size and forecast 2023-2028
      • Exhibit 99: Chart on Japan - Market size and forecast 2023-2028 ($ billion)
      • Exhibit 100: Data Table on Japan - Market size and forecast 2023-2028 ($ billion)
      • Exhibit 101: Chart on Japan - Year-over-year growth 2023-2028 (%)
      • Exhibit 102: Data Table on Japan - Year-over-year growth 2023-2028 (%)
    • 9.12 Market opportunity by geography
      • Exhibit 103: Market opportunity by geography ($ billion)
      • Exhibit 104: Data Tables on Market opportunity by geography ($ billion)

    10 Drivers, Challenges, and Trends

    • 10.1 Market drivers
      • 10.2 Market challenges
        • 10.3 Impact of drivers and challenges
          • Exhibit 105: Impact of drivers and challenges in 2023 and 2028
        • 10.4 Market trends

          11 Vendor Landscape

          • 11.1 Overview
            • 11.2 Vendor landscape
              • Exhibit 106: Overview on Criticality of inputs and Factors of differentiation
            • 11.3 Landscape disruption
              • Exhibit 107: Overview on factors of disruption
            • 11.4 Industry risks
              • Exhibit 108: Impact of key risks on business

            12 Vendor Analysis

            • 12.1 Vendors covered
              • Exhibit 109: Vendors covered
            • 12.2 Market positioning of vendors
              • Exhibit 110: Matrix on vendor position and classification
            • 12.3 AstraZeneca Plc
              • Exhibit 111: AstraZeneca Plc - Overview
              • Exhibit 112: AstraZeneca Plc - Product / Service
              • Exhibit 113: AstraZeneca Plc - Key news
              • Exhibit 114: AstraZeneca Plc - Key offerings
            • 12.4 Bausch Health Companies Inc.
              • Exhibit 115: Bausch Health Companies Inc. - Overview
              • Exhibit 116: Bausch Health Companies Inc. - Business segments
              • Exhibit 117: Bausch Health Companies Inc. - Key news
              • Exhibit 118: Bausch Health Companies Inc. - Key offerings
              • Exhibit 119: Bausch Health Companies Inc. - Segment focus
            • 12.5 Bio Techne Corp.
              • Exhibit 120: Bio Techne Corp. - Overview
              • Exhibit 121: Bio Techne Corp. - Business segments
              • Exhibit 122: Bio Techne Corp. - Key offerings
              • Exhibit 123: Bio Techne Corp. - Segment focus
            • 12.6 BioCryst Pharmaceuticals Inc.
              • Exhibit 124: BioCryst Pharmaceuticals Inc. - Overview
              • Exhibit 125: BioCryst Pharmaceuticals Inc. - Product / Service
              • Exhibit 126: BioCryst Pharmaceuticals Inc. - Key offerings
            • 12.7 Biosynth Ltd.
              • Exhibit 127: Biosynth Ltd. - Overview
              • Exhibit 128: Biosynth Ltd. - Product / Service
              • Exhibit 129: Biosynth Ltd. - Key offerings
            • 12.8 Bristol Myers Squibb Co.
              • Exhibit 130: Bristol Myers Squibb Co. - Overview
              • Exhibit 131: Bristol Myers Squibb Co. - Product / Service
              • Exhibit 132: Bristol Myers Squibb Co. - Key news
              • Exhibit 133: Bristol Myers Squibb Co. - Key offerings
            • 12.9 Cayman Chemical
              • Exhibit 134: Cayman Chemical - Overview
              • Exhibit 135: Cayman Chemical - Product / Service
              • Exhibit 136: Cayman Chemical - Key offerings
            • 12.10 CSL Ltd.
              • Exhibit 137: CSL Ltd. - Overview
              • Exhibit 138: CSL Ltd. - Business segments
              • Exhibit 139: CSL Ltd. - Key offerings
              • Exhibit 140: CSL Ltd. - Segment focus
            • 12.11 Fresenius SE and Co. KGaA
              • Exhibit 141: Fresenius SE and Co. KGaA - Overview
              • Exhibit 142: Fresenius SE and Co. KGaA - Business segments
              • Exhibit 143: Fresenius SE and Co. KGaA - Key news
              • Exhibit 144: Fresenius SE and Co. KGaA - Key offerings
              • Exhibit 145: Fresenius SE and Co. KGaA - Segment focus
            • 12.12 Ionis Pharmaceuticals Inc.
              • Exhibit 146: Ionis Pharmaceuticals Inc. - Overview
              • Exhibit 147: Ionis Pharmaceuticals Inc. - Business segments
              • Exhibit 148: Ionis Pharmaceuticals Inc. - Key news
              • Exhibit 149: Ionis Pharmaceuticals Inc. - Key offerings
              • Exhibit 150: Ionis Pharmaceuticals Inc. - Segment focus
            • 12.13 KalVista Pharmaceuticals Inc.
              • Exhibit 151: KalVista Pharmaceuticals Inc. - Overview
              • Exhibit 152: KalVista Pharmaceuticals Inc. - Product / Service
              • Exhibit 153: KalVista Pharmaceuticals Inc. - Key offerings
            • 12.14 Sino Biological Inc.
              • Exhibit 154: Sino Biological Inc. - Overview
              • Exhibit 155: Sino Biological Inc. - Product / Service
              • Exhibit 156: Sino Biological Inc. - Key offerings
            • 12.15 Takeda Pharmaceutical Co. Ltd.
              • Exhibit 157: Takeda Pharmaceutical Co. Ltd. - Overview
              • Exhibit 158: Takeda Pharmaceutical Co. Ltd. - Product / Service
              • Exhibit 159: Takeda Pharmaceutical Co. Ltd. - Key news
              • Exhibit 160: Takeda Pharmaceutical Co. Ltd. - Key offerings
            • 12.16 Thermo Fisher Scientific Inc.
              • Exhibit 161: Thermo Fisher Scientific Inc. - Overview
              • Exhibit 162: Thermo Fisher Scientific Inc. - Business segments
              • Exhibit 163: Thermo Fisher Scientific Inc. - Key news
              • Exhibit 164: Thermo Fisher Scientific Inc. - Key offerings
              • Exhibit 165: Thermo Fisher Scientific Inc. - Segment focus
            • 12.17 Vertex Pharmaceuticals Inc.
              • Exhibit 166: Vertex Pharmaceuticals Inc. - Overview
              • Exhibit 167: Vertex Pharmaceuticals Inc. - Product / Service
              • Exhibit 168: Vertex Pharmaceuticals Inc. - Key offerings

            13 Appendix

            • 13.1 Scope of the report
              • 13.2 Inclusions and exclusions checklist
                • Exhibit 169: Inclusions checklist
                • Exhibit 170: Exclusions checklist
              • 13.3 Currency conversion rates for US$
                • Exhibit 171: Currency conversion rates for US$
              • 13.4 Research methodology
                • Exhibit 172: Research methodology
                • Exhibit 173: Validation techniques employed for market sizing
                • Exhibit 174: Information sources
              • 13.5 List of abbreviations
                • Exhibit 175: List of abbreviations

              Research Methodology

              Technavio presents a detailed picture of the market by way of study, synthesis, and summation of data from multiple sources. The analysts have presented the various facets of the market with a particular focus on identifying the key industry influencers. The data thus presented is comprehensive, reliable, and the result of extensive research, both primary and secondary.

              INFORMATION SOURCES

              Primary sources

              • Manufacturers and suppliers
              • Channel partners
              • Industry experts
              • Strategic decision makers

              Secondary sources

              • Industry journals and periodicals
              • Government data
              • Financial reports of key industry players
              • Historical data
              • Press releases

              DATA ANALYSIS

              Data Synthesis

              • Collation of data
              • Estimation of key figures
              • Analysis of derived insights

              Data Validation

              • Triangulation with data models
              • Reference against proprietary databases
              • Corroboration with industry experts

              REPORT WRITING

              Qualitative

              • Market drivers
              • Market challenges
              • Market trends
              • Five forces analysis

              Quantitative

              • Market size and forecast
              • Market segmentation
              • Geographical insights
              • Competitive landscape

              Interested in this report?

              Get your sample now to see our research methodology and insights!

              Download Now

              Frequently Asked Questions

              Plasma Protease C1 Inhibitor market growth will increase by $ 2.00 bn during 2024-2028.

              The Plasma Protease C1 Inhibitor market is expected to grow at a CAGR of 7.55% during 2024-2028.

              Plasma Protease C1 Inhibitor market is segmented by End-user( Hospital pharmacy, Retail pharmacy, Online pharmacy) Product( Lyophilized, Injectable, Asia, Rest of World (ROW))

              AbbVie Inc., AstraZeneca Plc, Bausch Health Companies Inc., Bio Techne Corp., BioCryst Pharmaceuticals Inc., Biosynth Ltd., Bristol Myers Squibb Co., Cayman Chemical, CSL Ltd., FibroGen Inc., Fresenius SE and Co. KGaA, Gilead Sciences Inc., Ionis Pharmaceuticals Inc., KalVista Pharmaceuticals Inc., Merck KGaA, Novartis AG, Pharming Group NV, Sino Biological Inc., Takeda Pharmaceutical Co. Ltd., Thermo Fisher Scientific Inc., Vertex Pharmaceuticals Inc. are a few of the key vendors in the Plasma Protease C1 Inhibitor market.

              North America will register the highest growth rate of 39% among the other regions. Therefore, the Plasma Protease C1 Inhibitor market in North America is expected to garner significant business opportunities for the vendors during the forecast period.

              US, Germany, UK, China, Japan

              • Increasing research and development in plasma protease C1 inhibitorThe global plasma protease C1 inhibitor market is predicted to rise due to biopharmaceutical firms increased attention on developing effective plasma protease C1 inhibitor treatment drugs/therapy for various health disorders such as HAE is the driving factor this market.
              • diabetic macular edema (DME) is the driving factor this market.
              • and others. A number of kallikrein inhibitor medicines are now in the preclinical and clinical stages of development. In March 2022 is the driving factor this market.
              • KalVista Pharmaceuticals is the driving factor this market.
              • Inc. is the driving factor this market.
              • a clinical-stage pharmaceutical company focused on the discovery is the driving factor this market.
              • development is the driving factor this market.
              • and commercialization of small molecule protease inhibitors is the driving factor this market.
              • announced the initiation of the KVD900 Phase 3 KONFIDENT Clinical Trial evaluating efficacy and safety as the first potential oral is the driving factor this market.
              • on-demand therapy for HAE attacks. Such an increase in research and development related to plasma protease C1 inhibitors is expected to drive the growth of the global plasma protease C1 inhibitor market during the forecast period. is the driving factor this market.

              The Plasma Protease C1 Inhibitor market vendors should focus on grabbing business opportunities from the Hospital pharmacy segment as it accounted for the largest market share in the base year.