Precious Metals Market Size 2026-2030
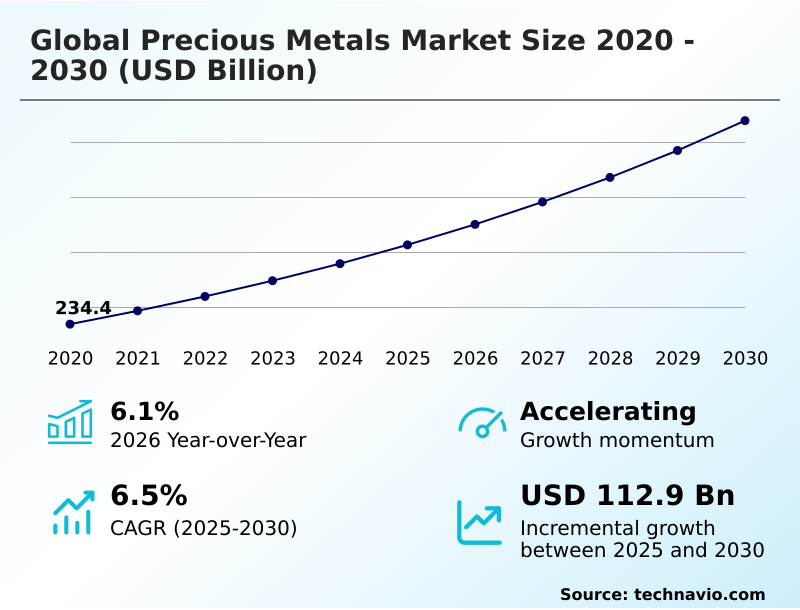
The precious metals market size is valued to increase by USD 112.9 billion, at a CAGR of 6.5% from 2025 to 2030. Precious metals shine as safe havens amid economic turbulence will drive the precious metals market.
Major Market Trends & Insights
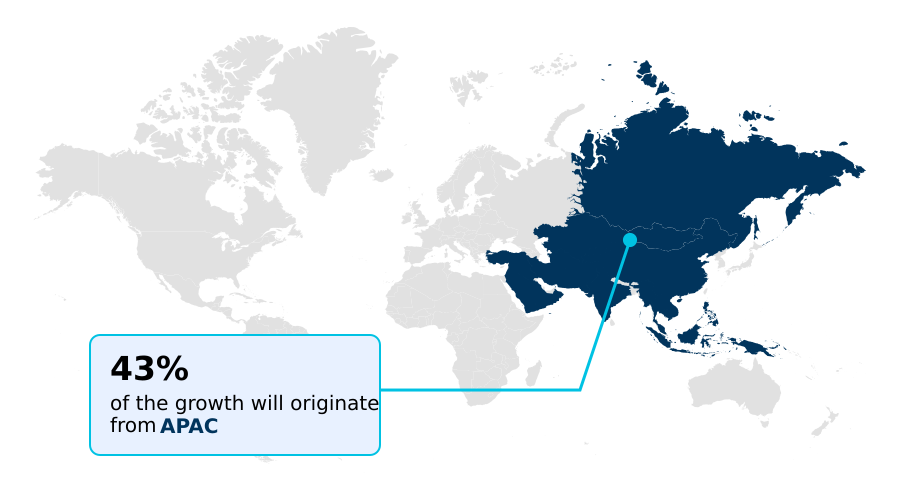
- APAC dominated the market and accounted for a 42.8% growth during the forecast period.
- By Type - Gold segment was valued at USD 117.8 billion in 2024
- By Application - Industrial segment accounted for the largest market revenue share in 2024
Market Size & Forecast
- Market Opportunities: USD 185 billion
- Market Future Opportunities: USD 112.9 billion
- CAGR from 2025 to 2030 : 6.5%
Market Summary
- The precious metals market operates on a dual-axis of value, serving as both a critical input for high-technology industries and a foundational safe-haven asset for global investors.
- Market dynamics are shaped by the intricate balance between industrial silver demand for applications like photovoltaic manufacturing and electronics, and the investment-driven pursuit of gold bullion as a hedge against currency devaluation and geopolitical risk. A key business scenario involves an automotive manufacturer navigating the complexities of the platinum group metals (PGMs) supply chain.
- The firm must secure long-term contracts for palladium and rhodium for catalytic converters while simultaneously modeling the impact of the electric vehicle transition on future PGM demand, all while adhering to stringent responsible sourcing standards.
- This requires sophisticated forecasting to manage price volatility and supply disruptions, highlighting the interplay between industrial necessity, investment sentiment, and evolving ESG mandates that define the contemporary precious metals landscape.
- The sector’s resilience is continually tested by challenges such as shifting mining regulations and the high operational costs of extraction, which are balanced by drivers like central bank purchasing and innovation in green technologies dependent on these unique elements.
What will be the Size of the Precious Metals Market during the forecast period?
Get Key Insights on Market Forecast (PDF) Get Free Sample
How is the Precious Metals Market Segmented?
The precious metals industry research report provides comprehensive data (region-wise segment analysis), with forecasts and estimates in "USD billion" for the period 2026-2030, as well as historical data from 2020-2024 for the following segments.
- Type
- Gold
- Silver
- Platinum
- Application
- Industrial
- Jewelry
- Investment
- Distribution channel
- Offline
- Online
- Geography
- APAC
- China
- Japan
- India
- North America
- US
- Canada
- Mexico
- Europe
- Germany
- UK
- France
- Middle East and Africa
- South Africa
- UAE
- Turkey
- South America
- Brazil
- Argentina
- Rest of World (ROW)
- APAC
By Type Insights
The gold segment is estimated to witness significant growth during the forecast period.
The gold segment's market position is reinforced by its dual function as both a primary financial instrument and a cornerstone of the luxury goods sector.
Demand is increasingly driven by institutional investors seeking portfolio diversification and a reliable fiat currency hedge against macroeconomic volatility. This investment bullion market activity is complemented by consistent consumer demand, particularly for high-purity bullion and jewelry.
While high prices can temper some purchasing, the metal's cultural and financial roles ensure sustained interest. Innovations in mineral exploration technology are critical for maintaining supply, with advanced techniques improving discovery success rates by over 15%.
This dynamic supports the entire value chain, from mining extraction process to the bullion dealer network, ensuring gold remains a pivotal component of the precious metals landscape.
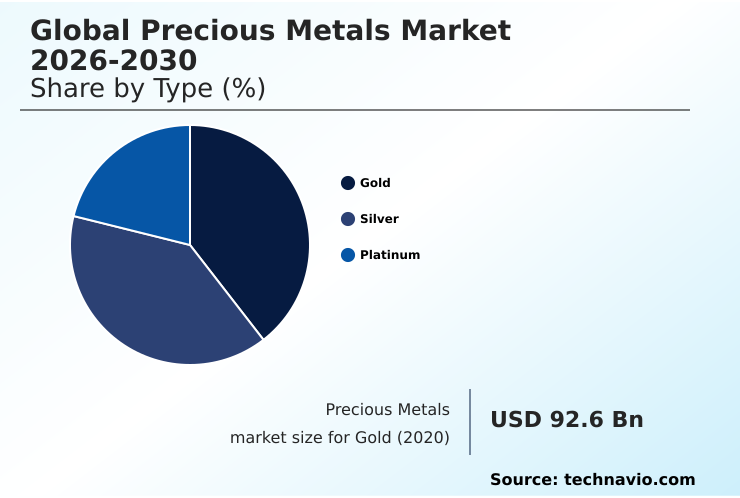
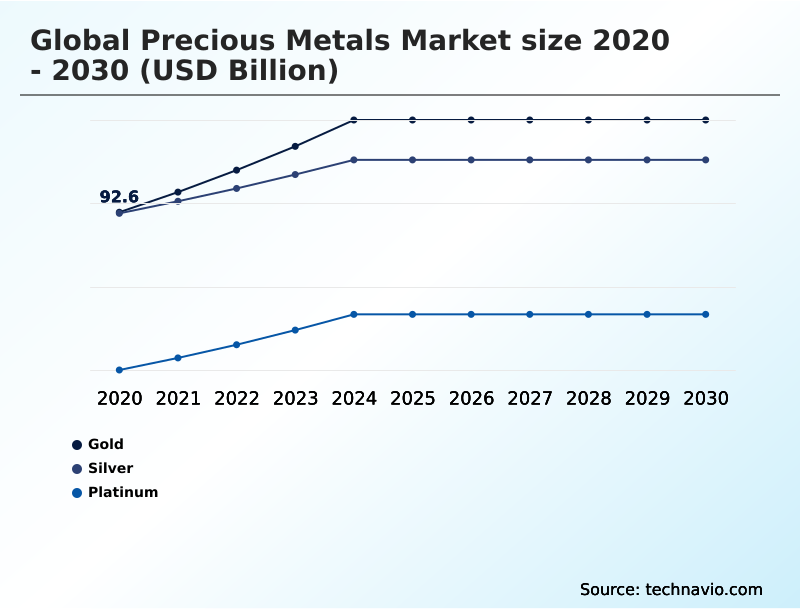
The Gold segment was valued at USD 117.8 billion in 2024 and showed a gradual increase during the forecast period.
Regional Analysis
APAC is estimated to contribute 42.8% to the growth of the global market during the forecast period.Technavio’s analysts have elaborately explained the regional trends and drivers that shape the market during the forecast period.
See How Precious Metals Market Demand is Rising in APAC Get Free Sample
The Asia-Pacific (APAC) region stands as the dominant force in the precious metals market, driven by a combination of robust industrial activity and deep-rooted cultural demand.
In APAC, countries like China and India are pivotal, with China's photovoltaic manufacturing consuming a substantial share of industrial silver, driving significant industrial silver demand. India's jewelry sector provides a consistent floor for gold prices, supported by strong consumer appetite.
This region's market is also bolstered by central bank gold buying as a strategy for financial asset diversification. For example, regional central bank holdings increased by over 4% in the last fiscal year.
The market in North America remains a key hub for investment and trading, with well-established custodial vaulting services and a mature bullion dealer network supporting high transaction volumes.
Market Dynamics
Our researchers analyzed the data with 2025 as the base year, along with the key drivers, trends, and challenges. A holistic analysis of drivers will help companies refine their marketing strategies to gain a competitive advantage.
- Strategic decision-making in the precious metals sector requires a comprehensive understanding of diverse market forces, from industrial applications for silver and platinum to the role of gold in central bank reserve strategy. Companies must analyze the impact of EVs on platinum group metals demand, which is reshaping sourcing priorities for the automotive industry.
- Simultaneously, investment choices are increasingly influenced by ESG factors in precious metals mining investment and the cost comparison of physical bullion vs ETPs, with physical assets often preferred during high-risk periods. The rising silver demand in solar panel manufacturing presents a long-term growth avenue, though it is tempered by geopolitical risks affecting palladium supply chains.
- To mitigate these risks, firms are adopting traceability solutions for precious metals supply chains, often leveraging blockchain applications for metal provenance to combat counterfeit products in e-retailing and ensure compliance. Operations are also being optimized through technological advances in PGM recycling, which can improve yield by over 15% compared to traditional methods.
- The future of precious metals in electronics and the emerging uses of iridium in green hydrogen are creating new demand verticals, forcing a re-evaluation of supply dynamics, particularly for rhodium and other scarce PGMs. This complex environment demands a nuanced approach to sourcing strategies for conflict-free minerals while hedging against inflation.
What are the key market drivers leading to the rise in the adoption of Precious Metals Industry?
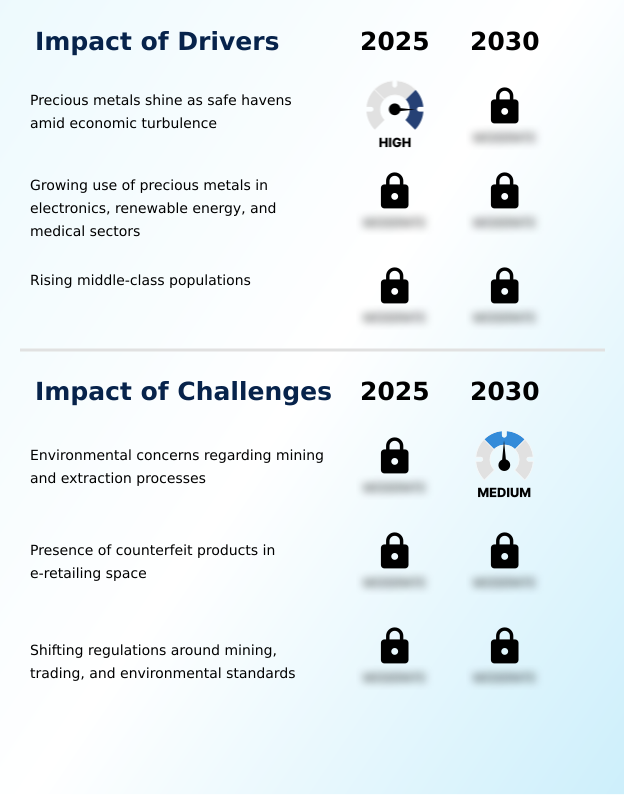
- Precious metals are increasingly sought after as safe-haven assets, providing stability for investors during periods of economic turbulence and geopolitical uncertainty.
- Market growth is fundamentally driven by the dual role of precious metals as both critical industrial components and safe-haven assets.
- Precious metals investing is intensifying as investors seek protection from economic uncertainty, with central bank gold buying serving as a key indicator of this sentiment. This demand for gold as a reserve asset is matched by strong industrial offtake.
- For example, silver paste is indispensable for the electronics sector, and platinum in the automotive industry remains crucial for emissions control. The hydrogen economy catalysts are creating new, structural demand for PGMs.
- This environment is pushing companies towards sustainable mining practices, with some achieving a 10% reduction in carbon emissions per ton of ore processed. Consequently, assets like gold bullion are valued for both their physical properties and their financial stability.
What are the market trends shaping the Precious Metals Industry?
- The escalating global demand for silver is significantly propelled by the expansion of solar panel manufacturing, where it serves as an essential material.
- Key market trends are being shaped by technological advancements and shifting industrial priorities. The growth in photovoltaic manufacturing is a primary driver for silver, where conductive pastes and the broader metallization process are essential. Innovations in this area have enabled a 5% increase in solar cell efficiency, directly impacting silver consumption.
- The expansion of the green energy transition metals space is also boosting demand for iridium catalysts and rhodium plating in new applications. In parallel, the financial sector sees growing interest in tokenized gold ownership, enhancing liquidity for investors.
- These trends underscore a market where industrial necessity and investment innovation converge, driving demand for everything from catalytic converters to high-tech electronics metals amid a complex geopolitical impact on metals.
What challenges does the Precious Metals Industry face during its growth?
- The growth of the precious metals industry is significantly constrained by environmental concerns related to the mining and extraction processes.
- The precious metals market faces significant operational and reputational challenges, primarily stemming from environmental and ethical concerns. Acid mine drainage remains a critical issue, with remediation costs sometimes exceeding initial mining profits by up to 50% in unregulated areas. The threat of resource nationalism creates supply uncertainty, particularly impacting the palladium supply deficit and the wider PGM recycling processes.
- Furthermore, ensuring ethical gold sourcing and mining ESG compliance is now a non-negotiable for downstream users, with supply chain audits increasing operational costs by 10-15% for many producers. This complex landscape, which includes factors like deep-level mining and the palladium alloys market, requires companies to adopt transparent and sustainable operational models to maintain market access and investor confidence.
Exclusive Technavio Analysis on Customer Landscape
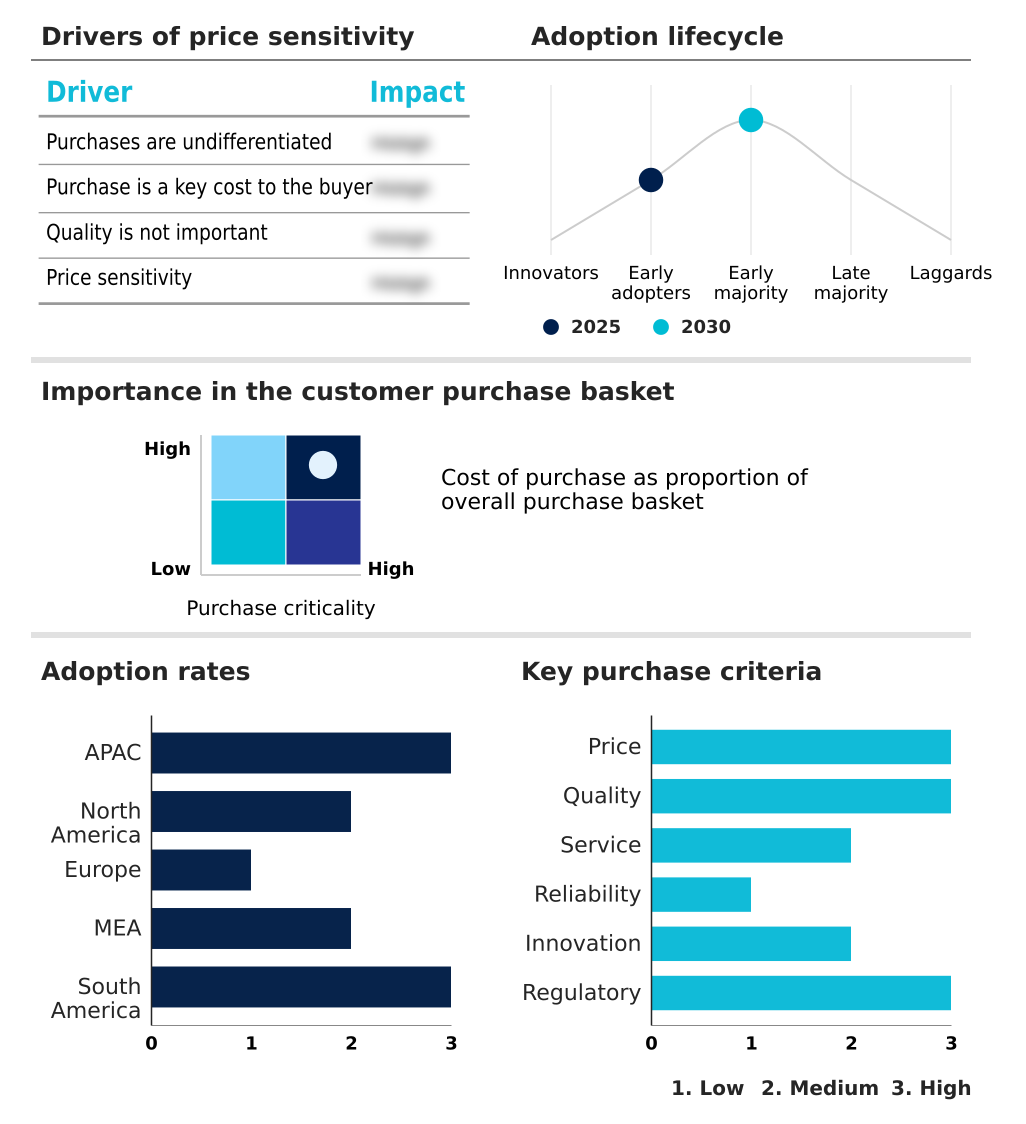
The precious metals market forecasting report includes the adoption lifecycle of the market, covering from the innovator’s stage to the laggard’s stage. It focuses on adoption rates in different regions based on penetration. Furthermore, the precious metals market report also includes key purchase criteria and drivers of price sensitivity to help companies evaluate and develop their market growth analysis strategies.
Customer Landscape of Precious Metals Industry
Competitive Landscape
Companies are implementing various strategies, such as strategic alliances, precious metals market forecast, partnerships, mergers and acquisitions, geographical expansion, and product/service launches, to enhance their presence in the industry.
Anglo American plc - Offerings include the extraction and provision of precious metals such as gold, silver, and platinum group metals, serving both industrial and investment markets globally.
The industry research and growth report includes detailed analyses of the competitive landscape of the market and information about key companies, including:
- Anglo American plc
- Barrick Gold Corp.
- First Majestic Silver Corp.
- First Quantum Minerals
- Freeport McMoRan Inc.
- Glencore Plc
- Gold Fields Ltd.
- Impala Platinum Holdings Ltd.
- Industrias Penoles SAB de CV
- Kinross Gold Corp.
- Lundin Mining Corp.
- Lynas Rare Earths Ltd.
- Neo Performance Materials Inc.
- Newcrest Mining Ltd.
- Newmont Corp.
- Northern Minerals Ltd.
- Pan American Silver Corp.
Qualitative and quantitative analysis of companies has been conducted to help clients understand the wider business environment as well as the strengths and weaknesses of key industry players. Data is qualitatively analyzed to categorize companies as pure play, category-focused, industry-focused, and diversified; it is quantitatively analyzed to categorize companies as dominant, leading, strong, tentative, and weak.
Recent Development and News in Precious metals market
- In October 2024, Newmont Corp. announced the achievement of full commercial production at its Ahafo North project in Ghana, a key development for its gold output.
- In April 2025, the government of India implemented new mandatory hallmarking standards for gold jewelry and artifacts to enhance purity verification and consumer trust.
- In November 2024, a major China-based electronics firm revealed a breakthrough in using silver-coated copper wires for next-generation 6G infrastructure, potentially boosting industrial silver demand.
- In January 2025, Freeport-McMoRan Inc. successfully secured a life-of-resource operational extension for its Grasberg mining district in Indonesia, ensuring long-term copper and gold production.
Dive into Technavio’s robust research methodology, blending expert interviews, extensive data synthesis, and validated models for unparalleled Precious Metals Market insights. See full methodology.
| Market Scope | |
|---|---|
| Page number | 281 |
| Base year | 2025 |
| Historic period | 2020-2024 |
| Forecast period | 2026-2030 |
| Growth momentum & CAGR | Accelerate at a CAGR of 6.5% |
| Market growth 2026-2030 | USD 112.9 billion |
| Market structure | Fragmented |
| YoY growth 2025-2026(%) | 6.1% |
| Key countries | China, Japan, India, South Korea, Australia, Indonesia, US, Canada, Mexico, Germany, UK, France, Italy, Spain, The Netherlands, South Africa, UAE, Turkey, Saudi Arabia, Israel, Brazil, Argentina and Chile |
| Competitive landscape | Leading Companies, Market Positioning of Companies, Competitive Strategies, and Industry Risks |
Research Analyst Overview
- The precious metals market is undergoing a significant strategic re-evaluation, moving beyond its traditional role as a simple fiat currency hedge. Its importance is growing due to the indispensable use of platinum group metals (PGMs) in green hydrogen electrolyzers and other decarbonization technologies.
- This shift has placed immense pressure on the mining extraction process, forcing operators to balance ore grade quality with stringent responsible sourcing standards. Firms are leveraging mineral exploration technology to improve ore processing efficiency, with some achieving a 15% reduction in water usage through closed-loop systems.
- The integration of byproduct metal recovery from base metal mining has become a key boardroom focus for portfolio diversification. Demand for high-purity bullion, investment grade coins, and exchange-traded products (ETPs) remains robust, supported by a global bullion dealer network and secure custodial vaulting services.
- As geopolitical risk mitigation becomes paramount, the market's structure, from smelting and refining to hallmarking standards, is evolving to provide greater transparency and supply chain traceability, fundamentally altering long-term investment and industrial procurement strategies.
What are the Key Data Covered in this Precious Metals Market Research and Growth Report?
-
What is the expected growth of the Precious Metals Market between 2026 and 2030?
-
USD 112.9 billion, at a CAGR of 6.5%
-
-
What segmentation does the market report cover?
-
The report is segmented by Type (Gold, Silver, and Platinum), Application (Industrial, Jewelry, and Investment), Distribution Channel (Offline, and Online) and Geography (APAC, North America, Europe, Middle East and Africa, South America)
-
-
Which regions are analyzed in the report?
-
APAC, North America, Europe, Middle East and Africa and South America
-
-
What are the key growth drivers and market challenges?
-
Precious metals shine as safe havens amid economic turbulence, Environmental concerns regarding mining and extraction processes
-
-
Who are the major players in the Precious Metals Market?
-
Anglo American plc, Barrick Gold Corp., First Majestic Silver Corp., First Quantum Minerals, Freeport McMoRan Inc., Glencore Plc, Gold Fields Ltd., Impala Platinum Holdings Ltd., Industrias Penoles SAB de CV, Kinross Gold Corp., Lundin Mining Corp., Lynas Rare Earths Ltd., Neo Performance Materials Inc., Newcrest Mining Ltd., Newmont Corp., Northern Minerals Ltd. and Pan American Silver Corp.
-
Market Research Insights
- The precious metals market is shaped by a dynamic interplay between industrial consumption and investment demand, creating a complex pricing environment. Industrial offtake, particularly for silver and platinum group metals, is closely tied to technological advancements in green energy and electronics.
- For instance, firms using advanced PGM recycling processes report recovering up to 95% of valuable metals from end-of-life products, a significant improvement over the 80% recovery rate from a decade ago.
- Concurrently, investment flows into physical gold vs ETFs are influenced by macroeconomic indicators and geopolitical stability, with digital precious metals platforms increasing accessibility and enhancing price transparency by over 20%. Strategic decisions are increasingly influenced by mining ESG compliance and the need for robust bullion storage solutions, as institutional portfolios adapt to these evolving market forces.
We can help! Our analysts can customize this precious metals market research report to meet your requirements.
 RIA -
RIA - 
