Playout Automation Market Analysis, Size, and Forecast 2025-2029: North America (US, Canada, and Mexico), APAC (China, India, Japan), Europe (Germany, Russia, UK), South America (Brazil), and Middle East and Africa

Playout Automation Market Analysis, Size, and Forecast 2025-2029:
North America (US, Canada, and Mexico), APAC (China, India, Japan), Europe (Germany, Russia, UK), South America (Brazil), and Middle East and Africa

Published: Apr 2025 217 Pages SKU: IRTNTR43668

Market Overview at a Glance

$4.58 B
Market Opportunity
24.2%
CAGR
19.5
YoY growth 2024-2025(%)

Playout Automation Market Size 2025-2029

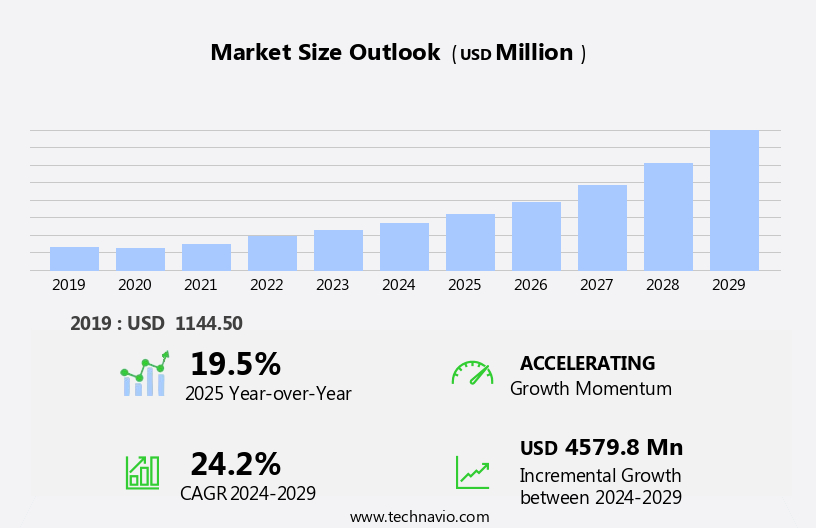
The playout automation market size is forecast to increase by USD 4.58 billion at a CAGR of 24.2% between 2024 and 2029.

  • The market is experiencing significant growth, driven by the increasing demand for multilingual playout and the high popularity of cloud-based Over-The-Top (OTT) channels. With the proliferation of free Internet TV services, broadcasters and media companies are under pressure to streamline their operations and reduce costs. Playout automation offers a solution by automating the process of scheduling, managing, and delivering content to various channels, enabling broadcasters to efficiently meet the demands of diverse audiences. Moreover, the adoption of cloud-based technologies is revolutionizing the playout landscape, providing flexibility, scalability, and cost savings. Cloud-based solutions enable broadcasters to easily manage and distribute content across multiple channels and platforms, reaching viewers on demand. Another trend is the shift from on-premises to cloud-based systems, which offers greater flexibility and cost savings. Robotic arms, heaters, sensors, motors, actuators, pumps, compressors, process lines, and valves are among the key equipment seeing automation implementation. 
  • However, the market is not without challenges, including the need for security measures to protect against piracy and the requirement for seamless integration with various content delivery networks and distribution platforms. Companies seeking to capitalize on this market opportunity must focus on developing innovative solutions that address these challenges while delivering high-quality, personalized content to viewers.

What will be the Size of the Playout Automation Market during the forecast period?

Playout Automation Market Size

 Request Free Sample

  • In the realm of media and entertainment, playout automation is a critical driver of business efficiency and innovation. Key market trends include the management of user engagement through metadata and the optimization of operational processes. Content creation tools and real-time data integration are essential for delivering data-driven content, while collaborative workflows and extended reality enhance the user experience. Cloud-based media services, broadcast graphics, and addressable advertising enable targeted, personalized content delivery. Social media analytics and network management ensure seamless content sharing and disaster recovery. Advanced routing, content licensing, and monetization strategies are essential for industry compliance and revenue growth.  Automation solutions, including DCS, SCADA, PLC, and MES, are integral to controlling production processes in various industries.
  • Content distribution and ingestion are streamlined through digital asset management and fault tolerance, while audience segmentation and programmatic advertising cater to evolving consumer preferences. Interactive television and content recommendations provide new opportunities for user engagement, while audio mixing and editing, rights management, and content distribution remain foundational elements of the market. Broadcast standards and regulations continue to shape the industry, with virtual studio technology and content analytics offering innovative solutions for content production and distribution. Overall, the market is characterized by its dynamic and evolving nature, with continuous advancements in technology and consumer expectations driving growth and innovation. Key technologies include Cutting, Welding, Robotic arms, Heaters, Motors, Pumps, Compressors, Process lines, and Valves.

How is this Playout Automation Industry segmented?

The playout automation industry research report provides comprehensive data (region-wise segment analysis), with forecasts and estimates in "USD million" for the period 2025-2029, as well as historical data from 2019-2023 for the following segments.

  • End-user
    • International broadcasters
    • National broadcasters
  • Genre
    • Sports
    • News
    • Entertainment
    • Cartoon and learning
    • Lifestyle and knowledge
  • Channel
    • Single channel
    • Multiple channel
    • Others
  • Geography
    • North America
      • US
      • Canada
      • Mexico
    • APAC
      • China
      • India
      • Japan
    • Europe
      • Germany
      • Russia
      • UK
    • South America
      • Brazil
    • Middle East and Africa

By End-user Insights

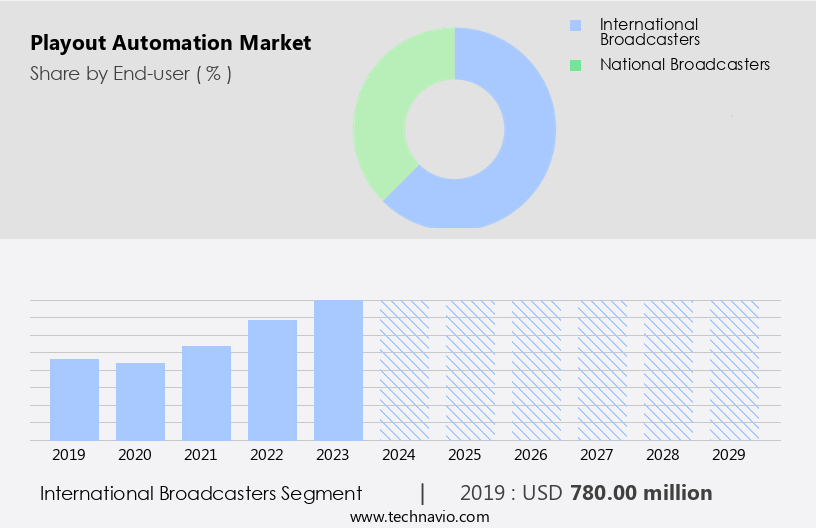
The international broadcasters segment is estimated to witness significant growth during the forecast period. The market experiences steady growth, driven by the international broadcasters segment. This segment, which includes renowned channels such as AXN, HBO, BBC, Discovery, CNN, FOX, and Fashion TV, holds the largest market share in 2024. The reason for this dominance lies in the global acceptance and ubiquitous presence of these channels. Despite varying show broadcast times based on Greenwich Mean Time (GMT), they do not filter content based on countries. Integration of advanced technologies like Cloud Playout, IP-Based Broadcasting, and Real-Time Monitoring plays a significant role in the market's growth. Cloud Computing, Machine Learning, and Big Data Analytics are essential components, enabling broadcasters to optimize content delivery and scheduling. Additionally, advancements in robotics, artificial intelligence, and machine learning have enabled machines to perform cognitive tasks, outperforming humans in areas such as measuring, inspecting, and sorting.

Next-Generation Broadcasting and OTT Platforms are emerging trends, offering Multi-Screen Experiences and Dynamic Ad Insertion. Social Media Integration and Personalized Experiences are also crucial, as audiences increasingly demand interactive and targeted content. Additionally, the market is witnessing the adoption of Virtualized Playout, Edge Computing, and Software-Defined Playout. These technologies ensure security and reliability, making content delivery seamless and efficient. Broadcast Engineering, Media Management, and Media Operations also contribute to the market's expansion, as they facilitate efficient workflows and content archiving. The integration of Artificial Intelligence and API Integration further enhances automation and content metadata management. In summary, The market is thriving due to the integration of advanced technologies, the growing popularity of international broadcasters, and the increasing demand for interactive and personalized content.

Playout Automation Market Size

Get a glance at the market report of share of various segments Request Free Sample

The International broadcasters segment was valued at USD 780.00 billion in 2019 and showed a gradual increase during the forecast period.

Regional Analysis

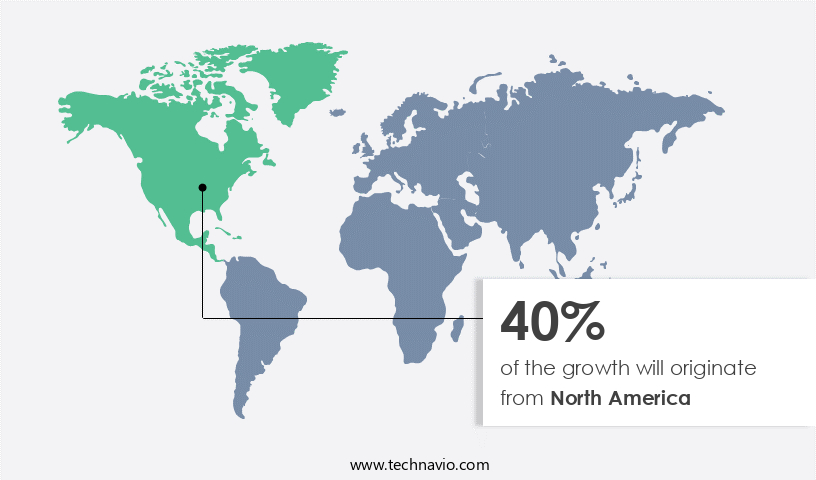
North America is estimated to contribute 40% to the growth of the global market during the forecast period. Technavio's analysts have elaborately explained the regional trends and drivers that shape the market during the forecast period.

Playout Automation Market Share by Geography

For more insights on the market size of various regions, Request Free Sample

The market is experiencing significant advancements, with various components playing integral roles in its evolution. Incorporating Data Privacy ensures secure handling of sensitive information. Channel Management streamlines workflows, while Digital Marketing enhances audience engagement. IP-based broadcasting facilitates content delivery, and Automated Content Acquisition reduces manual efforts. The Internet of Things (IoT) and Traffic Systems optimize operations, and Cloud Playout offers flexibility. Next-generation broadcasting delivers advanced functionalities, and Real-Time Monitoring ensures quality. Media Management and Live Streaming expand reach, while the Master Control Room and On-Air Graphics maintain professionalism. Big Data Analytics offers insights, Social Media Integration broadens audience interaction, and Virtualized Playout and Edge Computing enhance efficiency.

StartFragment Broadcast engineering and broadcast automation ensure seamless operations, and media asset management preserves content. Broadcast control systems manage multiple channels, mobile broadcasting expands accessibility, and content delivery networks ensure swift delivery. Playout automation systems schedule and deliver content, while machine learning optimizes processes. Radio broadcasting, 5G networks, education and training, and automated playout streamline operations further. Workflow automation, live event production, dynamic ad insertion, OTT platforms, multi-screen experiences, automation software, targeted content, interactive content, remote control, corporate communications, digital signage, personalized experiences, hybrid cloud, multi-platform delivery, media operations, streaming services, content archiving, security and reliability, content metadata, television broadcasting, software-defined playout, API integration, and artificial intelligence are all essential components contributing to the market's growth and innovation.EndFragment

Market Dynamics

Our researchers analyzed the data with 2024 as the base year, along with the key drivers, trends, and challenges. A holistic analysis of drivers will help companies refine their marketing strategies to gain a competitive advantage.

What are the key market drivers leading to the rise in the adoption of Playout Automation Industry?

  • Rising need for multilingual playout is the key driver of the market.  The market is experiencing growth due to the increasing demand for multilingual playouts. The expansion of cable and satellite television services in both urban and rural areas creates a vast audience for broadcasters, necessitating linguistic diversity. Playout automation enables broadcasters to cater to diverse viewing preferences, leading to the growth of the market. Multilingual playouts have gained significant traction due to the wide audience base and the penetration of satellite and cable TV in various regions, particularly in Asian countries. Broadcasters utilize Content Delivery and Asset Management (CiaB) systems to automate the playout process using input files. This automation enhances efficiency and flexibility, making it an essential component of the broadcasting industry. Additionally, advancements in robotics, artificial intelligence, and machine learning have enabled machines to perform cognitive tasks, outperforming humans in areas such as measuring, inspecting, and sorting.

What are the market trends shaping the Playout Automation Industry?

  • High popularity of cloud-based OTT channel is the upcoming market trend.  The global Over-The-Top (OTT) industry is experiencing significant growth due to the increasing popularity of the internet and advancements in technologies such as cloud computing, augmented reality, virtual reality, artificial intelligence (AI), and machine learning (ML). The availability of high-speed broadband connections enables consumers to access a wide range of content, including movies, TV shows, and live events, on demand and personalized to their preferences. This has led to the exponential growth of OTT platforms like Netflix, Hulu, and Sling TV. As of Q4 2023, Netflix boasts 260 million paid subscribers worldwide, a significant increase from the 74.76 million subscribers reported in Q4 2015. These trends are expected to continue as technology advances and consumer demand for convenient and customized content solutions increases.

What challenges does the Playout Automation Industry face during its growth?

  • High adoption of free Internet TV services is a key challenge affecting the industry growth.  The television industry is facing intense competition from free Internet TV services, such as YouTube and Hulu, which offer a vast array of content in both high definition and standard definition formats. Consumers have shown a preference for these free services due to their convenience and affordability, leading to a decrease in demand for paid TV subscriptions. In Japan, for instance, the high penetration of broadband and the availability of free TV services have made viewers hesitant to adopt video-on-demand (VoD) services, which are supported by paid subscriptions. This trend poses a significant challenge for paid TV service providers, as they struggle to retain their customer base and generate revenue. The increasing popularity of free Internet TV services has forced the industry to adapt and innovate, offering more competitive pricing and additional features to attract and retain subscribers.

Exclusive Customer Landscape

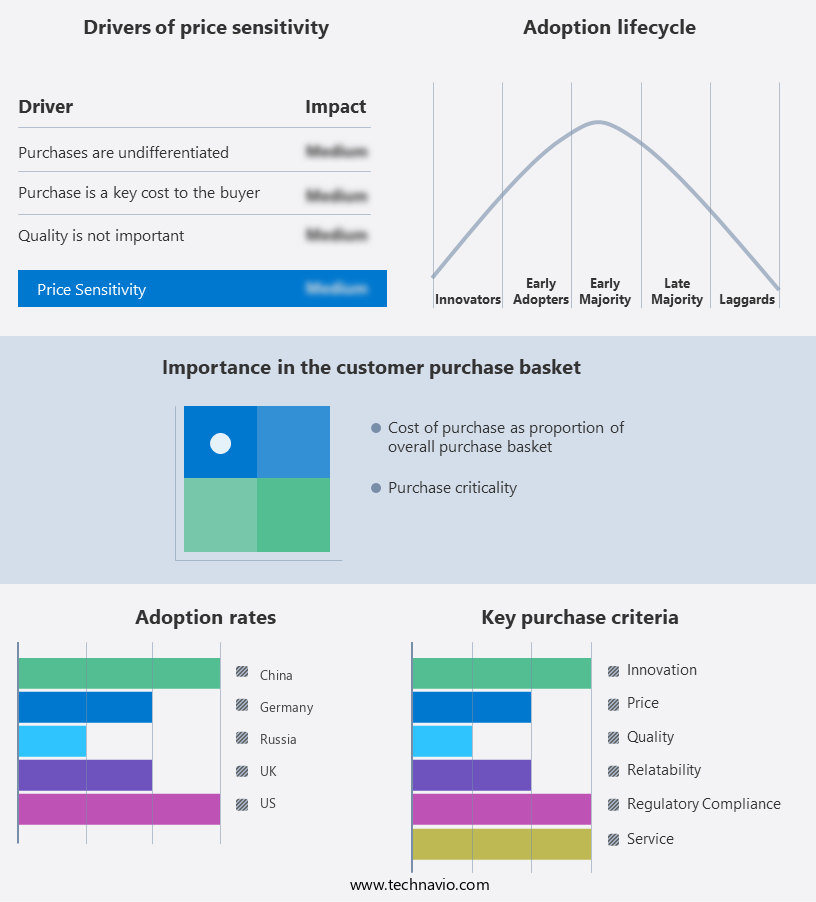
The playout automation market forecasting report includes the adoption lifecycle of the market, covering from the innovator's stage to the laggard's stage. It focuses on adoption rates in different regions based on penetration. Furthermore, the playout automation market report also includes key purchase criteria and drivers of price sensitivity to help companies evaluate and develop their market growth analysis strategies.

Playout Automation Market Share by Geography

 Customer Landscape

Key Companies & Market Insights

Companies are implementing various strategies, such as strategic alliances, playout automation market forecast, partnerships, mergers and acquisitions, geographical expansion, and product/service launches, to enhance their presence in the industry.

305broadcast - The company specializes in playout automation solutions, including Factserve, streamlining broadcast workflows for enhanced efficiency and accuracy.

The industry research and growth report includes detailed analyses of the competitive landscape of the market and information about key companies, including:

  • 305broadcast
  • Amagi Corp.
  • Aveco sro
  • Avid Technology Inc.
  • Avmeda LLC
  • Axel Technology srl
  • Belden Inc.
  • BroadStream Solutions Inc.
  • Cinegy LLC
  • Dalet SA
  • Evertz Technologies Ltd.
  • HARDATA
  • Harmonic Inc.
  • iHeartMedia Inc.
  • Imagine Communications Corp.
  • NVerzion Inc.
  • Pebble Beach Systems Group plc
  • SI Media srl
  • Sony Group Corp.
  • wTVision

Qualitative and quantitative analysis of companies has been conducted to help clients understand the wider business environment as well as the strengths and weaknesses of key industry players. Data is qualitatively analyzed to categorize companies as pure play, category-focused, industry-focused, and diversified; it is quantitatively analyzed to categorize companies as dominant, leading, strong, tentative, and weak.

Research Analyst Overview

Playout automation has emerged as a critical component in the evolving media landscape, enabling broadcasters and content providers to efficiently manage and deliver content across various platforms. The market for playout automation systems continues to grow, driven by the increasing demand for next-generation broadcasting and the proliferation of digital marketing channels. Channel management is a key application area for playout automation, allowing broadcasters to effectively manage their content across multiple channels and platforms. IP-based broadcasting and live streaming have gained significant traction, necessitating the need for automated content acquisition and playout. The Internet of Things (IoT) and traffic systems are also integrating with playout automation systems, providing real-time monitoring and optimization capabilities.

Cloud playout has become increasingly popular due to its cost-effectiveness and flexibility. Broadcast engineering teams can leverage cloud computing and content delivery networks to manage and deliver content in real-time, enabling them to quickly adapt to changing market conditions and viewer preferences. Virtualized playout and edge computing are also gaining traction, providing additional benefits such as improved reliability and reduced latency. Media management and media asset management are essential components of playout automation systems. Big data analytics and machine learning algorithms are being integrated to enable targeted content delivery and personalized experiences for viewers. Social media integration and on-air graphics are also becoming standard features, enabling broadcasters to engage with their audiences in real-time.

Automated playout and workflow automation are key trends in the market, enabling broadcasters to streamline their operations and reduce costs. Live event production and dynamic ad insertion are also major applications, allowing broadcasters to monetize their content in real-time. OTT platforms and multi-screen experiences are driving the demand for automated content scheduling and delivery, ensuring that viewers have access to the right content at the right time. Security and reliability are critical considerations in the market. Broadcast control systems and content delivery networks are being integrated to ensure secure and reliable content delivery. API integration and artificial intelligence are also being used to improve content metadata management and enhance the overall user experience.

The market for playout automation systems is diverse, catering to various applications and industries, including radio broadcasting, education and training, corporate communications, and digital signage. The market is expected to continue growing, driven by the increasing demand for experiences and the need for efficient content delivery across multiple platforms. The market is a dynamic and evolving landscape, driven by the increasing demand for next-generation broadcasting and the proliferation of digital marketing channels. Playout automation systems are enabling broadcasters and content providers to efficiently manage and deliver content across various platforms, while also providing new opportunities for monetization and engagement with audiences. The market is expected to continue growing, driven by the increasing adoption of cloud computing, IoT, and machine learning technologies.

Market Scope

Report Coverage

Details

Page number

217

Base year

2024

Historic period

2019-2023

Forecast period

2025-2029

Growth momentum & CAGR

Accelerate at a CAGR of 24.2%

Market growth 2025-2029

USD 4.58 billion

Market structure

Fragmented

YoY growth 2024-2025(%)

19.5

Key countries

US, Russia, China, UK, Germany, Canada, Mexico, Brazil, Japan, and India

Competitive landscape

Leading Companies, Market Positioning of Companies, Competitive Strategies, and Industry Risks

Request Free Sample

What are the Key Data Covered in this Playout Automation Market Research and Growth Report?

  • CAGR of the Playout Automation industry during the forecast period
  • Detailed information on factors that will drive the growth and forecasting between 2025 and 2029
  • Precise estimation of the size of the market and its contribution of the industry in focus to the parent market
  • Accurate predictions about upcoming growth and trends and changes in consumer behaviour
  • Growth of the market across North America, APAC, Europe, South America, and Middle East and Africa
  • Thorough analysis of the market's competitive landscape and detailed information about companies
  • Comprehensive analysis of factors that will challenge the playout automation market growth of industry companies

We can help! Our analysts can customize this playout automation market research report to meet your requirements.

Get in touch

1 Executive Summary

  • 1.1 Market overview
    • Executive Summary - Chart on Market Overview
    • Executive Summary - Data Table on Market Overview
    • Executive Summary - Chart on Global Market Characteristics
    • Executive Summary - Chart on Market by Geography
    • Executive Summary - Chart on Market Segmentation by End-user
    • Executive Summary - Chart on Market Segmentation by Genre
    • Executive Summary - Chart on Market Segmentation by Channel
    • Executive Summary - Chart on Incremental Growth
    • Executive Summary - Data Table on Incremental Growth
    • Executive Summary - Chart on Company Market Positioning

2 Technavio Analysis

  • 2.1 Analysis of price sensitivity, lifecycle, customer purchase basket, adoption rates, and purchase criteria
    • Analysis of price sensitivity, lifecycle, customer purchase basket, adoption rates, and purchase criteria
  • 2.2 Criticality of inputs and Factors of differentiation
    • Overview on criticality of inputs and factors of differentiation
  • 2.3 Factors of disruption
    • Overview on factors of disruption
  • 2.4 Impact of drivers and challenges
    • Impact of drivers and challenges in 2024 and 2029

3 Market Landscape

  • 3.1 Market ecosystem
    • Parent Market
    • Data Table on - Parent Market
  • 3.2 Market characteristics
    • Market characteristics analysis
  • 3.3 Value chain analysis
    • Value chain analysis

4 Market Sizing

  • 4.1 Market definition
    • Offerings of companies included in the market definition
  • 4.2 Market segment analysis
    • Market segments
  • 4.3 Market size 2024
    • 4.4 Market outlook: Forecast for 2024-2029
      • Chart on Global - Market size and forecast 2024-2029 ($ million)
      • Data Table on Global - Market size and forecast 2024-2029 ($ million)
      • Chart on Global Market: Year-over-year growth 2024-2029 (%)
      • Data Table on Global Market: Year-over-year growth 2024-2029 (%)

    5 Historic Market Size

    • 5.1 Global Playout Automation Market 2019 - 2023
      • Historic Market Size - Data Table on Global Playout Automation Market 2019 - 2023 ($ million)
    • 5.2 End-user segment analysis 2019 - 2023
      • Historic Market Size - End-user Segment 2019 - 2023 ($ million)
    • 5.3 Genre segment analysis 2019 - 2023
      • Historic Market Size - Genre Segment 2019 - 2023 ($ million)
    • 5.4 Channel segment analysis 2019 - 2023
      • Historic Market Size - Channel Segment 2019 - 2023 ($ million)
    • 5.5 Geography segment analysis 2019 - 2023
      • Historic Market Size - Geography Segment 2019 - 2023 ($ million)
    • 5.6 Country segment analysis 2019 - 2023
      • Historic Market Size - Country Segment 2019 - 2023 ($ million)

    6 Qualitative Analysis

    • 6.1 Impact of AI on Global Playout Automation Market

      7 Five Forces Analysis

      • 7.1 Five forces summary
        • Five forces analysis - Comparison between 2024 and 2029
      • 7.2 Bargaining power of buyers
        • Bargaining power of buyers - Impact of key factors 2024 and 2029
      • 7.3 Bargaining power of suppliers
        • Bargaining power of suppliers - Impact of key factors in 2024 and 2029
      • 7.4 Threat of new entrants
        • Threat of new entrants - Impact of key factors in 2024 and 2029
      • 7.5 Threat of substitutes
        • Threat of substitutes - Impact of key factors in 2024 and 2029
      • 7.6 Threat of rivalry
        • Threat of rivalry - Impact of key factors in 2024 and 2029
      • 7.7 Market condition
        • Chart on Market condition - Five forces 2024 and 2029

      8 Market Segmentation by End-user

      • 8.1 Market segments
        • Chart on End-user - Market share 2024-2029 (%)
        • Data Table on End-user - Market share 2024-2029 (%)
      • 8.2 Comparison by End-user
        • Chart on Comparison by End-user
        • Data Table on Comparison by End-user
      • 8.3 International broadcasters - Market size and forecast 2024-2029
        • Chart on International broadcasters - Market size and forecast 2024-2029 ($ million)
        • Data Table on International broadcasters - Market size and forecast 2024-2029 ($ million)
        • Chart on International broadcasters - Year-over-year growth 2024-2029 (%)
        • Data Table on International broadcasters - Year-over-year growth 2024-2029 (%)
      • 8.4 National broadcasters - Market size and forecast 2024-2029
        • Chart on National broadcasters - Market size and forecast 2024-2029 ($ million)
        • Data Table on National broadcasters - Market size and forecast 2024-2029 ($ million)
        • Chart on National broadcasters - Year-over-year growth 2024-2029 (%)
        • Data Table on National broadcasters - Year-over-year growth 2024-2029 (%)
      • 8.5 Market opportunity by End-user
        • Market opportunity by End-user ($ million)
        • Data Table on Market opportunity by End-user ($ million)

      9 Market Segmentation by Genre

      • 9.1 Market segments
        • Chart on Genre - Market share 2024-2029 (%)
        • Data Table on Genre - Market share 2024-2029 (%)
      • 9.2 Comparison by Genre
        • Chart on Comparison by Genre
        • Data Table on Comparison by Genre
      • 9.3 Sports - Market size and forecast 2024-2029
        • Chart on Sports - Market size and forecast 2024-2029 ($ million)
        • Data Table on Sports - Market size and forecast 2024-2029 ($ million)
        • Chart on Sports - Year-over-year growth 2024-2029 (%)
        • Data Table on Sports - Year-over-year growth 2024-2029 (%)
      • 9.4 News - Market size and forecast 2024-2029
        • Chart on News - Market size and forecast 2024-2029 ($ million)
        • Data Table on News - Market size and forecast 2024-2029 ($ million)
        • Chart on News - Year-over-year growth 2024-2029 (%)
        • Data Table on News - Year-over-year growth 2024-2029 (%)
      • 9.5 Entertainment - Market size and forecast 2024-2029
        • Chart on Entertainment - Market size and forecast 2024-2029 ($ million)
        • Data Table on Entertainment - Market size and forecast 2024-2029 ($ million)
        • Chart on Entertainment - Year-over-year growth 2024-2029 (%)
        • Data Table on Entertainment - Year-over-year growth 2024-2029 (%)
      • 9.6 Cartoon and learning - Market size and forecast 2024-2029
        • Chart on Cartoon and learning - Market size and forecast 2024-2029 ($ million)
        • Data Table on Cartoon and learning - Market size and forecast 2024-2029 ($ million)
        • Chart on Cartoon and learning - Year-over-year growth 2024-2029 (%)
        • Data Table on Cartoon and learning - Year-over-year growth 2024-2029 (%)
      • 9.7 Lifestyle and knowledge - Market size and forecast 2024-2029
        • Chart on Lifestyle and knowledge - Market size and forecast 2024-2029 ($ million)
        • Data Table on Lifestyle and knowledge - Market size and forecast 2024-2029 ($ million)
        • Chart on Lifestyle and knowledge - Year-over-year growth 2024-2029 (%)
        • Data Table on Lifestyle and knowledge - Year-over-year growth 2024-2029 (%)
      • 9.8 Market opportunity by Genre
        • Market opportunity by Genre ($ million)
        • Data Table on Market opportunity by Genre ($ million)

      10 Market Segmentation by Channel

      • 10.1 Market segments
        • Chart on Channel - Market share 2024-2029 (%)
        • Data Table on Channel - Market share 2024-2029 (%)
      • 10.2 Comparison by Channel
        • Chart on Comparison by Channel
        • Data Table on Comparison by Channel
      • 10.3 Single channel - Market size and forecast 2024-2029
        • Chart on Single channel - Market size and forecast 2024-2029 ($ million)
        • Data Table on Single channel - Market size and forecast 2024-2029 ($ million)
        • Chart on Single channel - Year-over-year growth 2024-2029 (%)
        • Data Table on Single channel - Year-over-year growth 2024-2029 (%)
      • 10.4 Multiple channel - Market size and forecast 2024-2029
        • Chart on Multiple channel - Market size and forecast 2024-2029 ($ million)
        • Data Table on Multiple channel - Market size and forecast 2024-2029 ($ million)
        • Chart on Multiple channel - Year-over-year growth 2024-2029 (%)
        • Data Table on Multiple channel - Year-over-year growth 2024-2029 (%)
      • 10.5 Others - Market size and forecast 2024-2029
        • Chart on Others - Market size and forecast 2024-2029 ($ million)
        • Data Table on Others - Market size and forecast 2024-2029 ($ million)
        • Chart on Others - Year-over-year growth 2024-2029 (%)
        • Data Table on Others - Year-over-year growth 2024-2029 (%)
      • 10.6 Market opportunity by Channel
        • Market opportunity by Channel ($ million)
        • Data Table on Market opportunity by Channel ($ million)

      11 Customer Landscape

      • 11.1 Customer landscape overview
        • Analysis of price sensitivity, lifecycle, customer purchase basket, adoption rates, and purchase criteria

      12 Geographic Landscape

      • 12.1 Geographic segmentation
        • Chart on Market share by geography 2024-2029 (%)
        • Data Table on Market share by geography 2024-2029 (%)
      • 12.2 Geographic comparison
        • Chart on Geographic comparison
        • Data Table on Geographic comparison
      • 12.3 North America - Market size and forecast 2024-2029
        • Chart on North America - Market size and forecast 2024-2029 ($ million)
        • Data Table on North America - Market size and forecast 2024-2029 ($ million)
        • Chart on North America - Year-over-year growth 2024-2029 (%)
        • Data Table on North America - Year-over-year growth 2024-2029 (%)
      • 12.4 APAC - Market size and forecast 2024-2029
        • Chart on APAC - Market size and forecast 2024-2029 ($ million)
        • Data Table on APAC - Market size and forecast 2024-2029 ($ million)
        • Chart on APAC - Year-over-year growth 2024-2029 (%)
        • Data Table on APAC - Year-over-year growth 2024-2029 (%)
      • 12.5 Europe - Market size and forecast 2024-2029
        • Chart on Europe - Market size and forecast 2024-2029 ($ million)
        • Data Table on Europe - Market size and forecast 2024-2029 ($ million)
        • Chart on Europe - Year-over-year growth 2024-2029 (%)
        • Data Table on Europe - Year-over-year growth 2024-2029 (%)
      • 12.6 South America - Market size and forecast 2024-2029
        • Chart on South America - Market size and forecast 2024-2029 ($ million)
        • Data Table on South America - Market size and forecast 2024-2029 ($ million)
        • Chart on South America - Year-over-year growth 2024-2029 (%)
        • Data Table on South America - Year-over-year growth 2024-2029 (%)
      • 12.7 Middle East and Africa - Market size and forecast 2024-2029
        • Chart on Middle East and Africa - Market size and forecast 2024-2029 ($ million)
        • Data Table on Middle East and Africa - Market size and forecast 2024-2029 ($ million)
        • Chart on Middle East and Africa - Year-over-year growth 2024-2029 (%)
        • Data Table on Middle East and Africa - Year-over-year growth 2024-2029 (%)
      • 12.8 US - Market size and forecast 2024-2029
        • Chart on US - Market size and forecast 2024-2029 ($ million)
        • Data Table on US - Market size and forecast 2024-2029 ($ million)
        • Chart on US - Year-over-year growth 2024-2029 (%)
        • Data Table on US - Year-over-year growth 2024-2029 (%)
      • 12.9 Russia - Market size and forecast 2024-2029
        • Chart on Russia - Market size and forecast 2024-2029 ($ million)
        • Data Table on Russia - Market size and forecast 2024-2029 ($ million)
        • Chart on Russia - Year-over-year growth 2024-2029 (%)
        • Data Table on Russia - Year-over-year growth 2024-2029 (%)
      • 12.10 China - Market size and forecast 2024-2029
        • Chart on China - Market size and forecast 2024-2029 ($ million)
        • Data Table on China - Market size and forecast 2024-2029 ($ million)
        • Chart on China - Year-over-year growth 2024-2029 (%)
        • Data Table on China - Year-over-year growth 2024-2029 (%)
      • 12.11 UK - Market size and forecast 2024-2029
        • Chart on UK - Market size and forecast 2024-2029 ($ million)
        • Data Table on UK - Market size and forecast 2024-2029 ($ million)
        • Chart on UK - Year-over-year growth 2024-2029 (%)
        • Data Table on UK - Year-over-year growth 2024-2029 (%)
      • 12.12 Germany - Market size and forecast 2024-2029
        • Chart on Germany - Market size and forecast 2024-2029 ($ million)
        • Data Table on Germany - Market size and forecast 2024-2029 ($ million)
        • Chart on Germany - Year-over-year growth 2024-2029 (%)
        • Data Table on Germany - Year-over-year growth 2024-2029 (%)
      • 12.13 Mexico - Market size and forecast 2024-2029
        • Chart on Mexico - Market size and forecast 2024-2029 ($ million)
        • Data Table on Mexico - Market size and forecast 2024-2029 ($ million)
        • Chart on Mexico - Year-over-year growth 2024-2029 (%)
        • Data Table on Mexico - Year-over-year growth 2024-2029 (%)
      • 12.14 Japan - Market size and forecast 2024-2029
        • Chart on Japan - Market size and forecast 2024-2029 ($ million)
        • Data Table on Japan - Market size and forecast 2024-2029 ($ million)
        • Chart on Japan - Year-over-year growth 2024-2029 (%)
        • Data Table on Japan - Year-over-year growth 2024-2029 (%)
      • 12.15 Canada - Market size and forecast 2024-2029
        • Chart on Canada - Market size and forecast 2024-2029 ($ million)
        • Data Table on Canada - Market size and forecast 2024-2029 ($ million)
        • Chart on Canada - Year-over-year growth 2024-2029 (%)
        • Data Table on Canada - Year-over-year growth 2024-2029 (%)
      • 12.16 Brazil - Market size and forecast 2024-2029
        • Chart on Brazil - Market size and forecast 2024-2029 ($ million)
        • Data Table on Brazil - Market size and forecast 2024-2029 ($ million)
        • Chart on Brazil - Year-over-year growth 2024-2029 (%)
        • Data Table on Brazil - Year-over-year growth 2024-2029 (%)
      • 12.17 India - Market size and forecast 2024-2029
        • Chart on India - Market size and forecast 2024-2029 ($ million)
        • Data Table on India - Market size and forecast 2024-2029 ($ million)
        • Chart on India - Year-over-year growth 2024-2029 (%)
        • Data Table on India - Year-over-year growth 2024-2029 (%)
      • 12.18 Market opportunity by geography
        • Market opportunity by geography ($ million)
        • Data Tables on Market opportunity by geography ($ million)

      13 Drivers, Challenges, and Opportunity/Restraints

      • 13.1 Market drivers
        • 13.2 Market challenges
          • 13.3 Impact of drivers and challenges
            • Impact of drivers and challenges in 2024 and 2029
          • 13.4 Market opportunities/restraints

            14 Competitive Landscape

            • 14.1 Overview
              • 14.2 Competitive Landscape
                • Overview on criticality of inputs and factors of differentiation
              • 14.3 Landscape disruption
                • Overview on factors of disruption
              • 14.4 Industry risks
                • Impact of key risks on business

              15 Competitive Analysis

              • 15.1 Companies profiled
                • Companies covered
              • 15.2 Company ranking index
                • Company ranking index
              • 15.3 Market positioning of companies
                • Matrix on companies position and classification
              • 15.4 Avid Technology Inc.
                • Avid Technology Inc. - Overview
                • Avid Technology Inc. - Product / Service
                • Avid Technology Inc. - Key offerings
                • SWOT
              • 15.5 Avmeda LLC
                • Avmeda LLC - Overview
                • Avmeda LLC - Product / Service
                • Avmeda LLC - Key offerings
                • SWOT
              • 15.6 Belden Inc.
                • Belden Inc. - Overview
                • Belden Inc. - Business segments
                • Belden Inc. - Key news
                • Belden Inc. - Key offerings
                • Belden Inc. - Segment focus
                • SWOT
              • 15.7 Cinegy LLC
                • Cinegy LLC - Overview
                • Cinegy LLC - Product / Service
                • Cinegy LLC - Key offerings
                • SWOT
              • 15.8 Dalet SA
                • Dalet SA - Overview
                • Dalet SA - Product / Service
                • Dalet SA - Key offerings
                • SWOT
              • 15.9 Evertz Technologies Ltd.
                • Evertz Technologies Ltd. - Overview
                • Evertz Technologies Ltd. - Product / Service
                • Evertz Technologies Ltd. - Key offerings
                • SWOT
              • 15.10 HARDATA
                • HARDATA - Overview
                • HARDATA - Product / Service
                • HARDATA - Key offerings
                • SWOT
              • 15.11 Harmonic Inc.
                • Harmonic Inc. - Overview
                • Harmonic Inc. - Business segments
                • Harmonic Inc. - Key offerings
                • Harmonic Inc. - Segment focus
                • SWOT
              • 15.12 iHeartMedia Inc.
                • iHeartMedia Inc. - Overview
                • iHeartMedia Inc. - Business segments
                • iHeartMedia Inc. - Key offerings
                • iHeartMedia Inc. - Segment focus
                • SWOT
              • 15.13 Imagine Communications Corp.
                • Imagine Communications Corp. - Overview
                • Imagine Communications Corp. - Product / Service
                • Imagine Communications Corp. - Key offerings
                • SWOT
              • 15.14 NVerzion Inc.
                • NVerzion Inc. - Overview
                • NVerzion Inc. - Product / Service
                • NVerzion Inc. - Key offerings
                • SWOT
              • 15.15 Pebble Beach Systems Group plc
                • Pebble Beach Systems Group plc - Overview
                • Pebble Beach Systems Group plc - Business segments
                • Pebble Beach Systems Group plc - Key offerings
                • Pebble Beach Systems Group plc - Segment focus
                • SWOT
              • 15.16 SI Media srl
                • SI Media srl - Overview
                • SI Media srl - Product / Service
                • SI Media srl - Key offerings
                • SWOT
              • 15.17 Sony Group Corp.
                • Sony Group Corp. - Overview
                • Sony Group Corp. - Business segments
                • Sony Group Corp. - Key news
                • Sony Group Corp. - Key offerings
                • Sony Group Corp. - Segment focus
                • SWOT
              • 15.18 wTVision
                • wTVision - Overview
                • wTVision - Product / Service
                • wTVision - Key offerings
                • SWOT

              16 Appendix

              • 16.1 Scope of the report
                • 16.2 Inclusions and exclusions checklist
                  • Inclusions checklist
                  • Exclusions checklist
                • 16.3 Currency conversion rates for US$
                  • Currency conversion rates for US$
                • 16.4 Research methodology
                  • Research methodology
                • 16.5 Data procurement
                  • Information sources
                • 16.6 Data validation
                  • Data validation
                • 16.7 Validation techniques employed for market sizing
                  • Validation techniques employed for market sizing
                • 16.8 Data synthesis
                  • Data synthesis
                • 16.9 360 degree market analysis
                  • 360 degree market analysis
                • 16.10 List of abbreviations
                  • List of abbreviations

                Research Methodology

                Technavio presents a detailed picture of the market by way of study, synthesis, and summation of data from multiple sources. The analysts have presented the various facets of the market with a particular focus on identifying the key industry influencers. The data thus presented is comprehensive, reliable, and the result of extensive research, both primary and secondary.

                INFORMATION SOURCES

                Primary sources

                • Manufacturers and suppliers
                • Channel partners
                • Industry experts
                • Strategic decision makers

                Secondary sources

                • Industry journals and periodicals
                • Government data
                • Financial reports of key industry players
                • Historical data
                • Press releases

                DATA ANALYSIS

                Data Synthesis

                • Collation of data
                • Estimation of key figures
                • Analysis of derived insights

                Data Validation

                • Triangulation with data models
                • Reference against proprietary databases
                • Corroboration with industry experts

                REPORT WRITING

                Qualitative

                • Market drivers
                • Market challenges
                • Market trends
                • Five forces analysis

                Quantitative

                • Market size and forecast
                • Market segmentation
                • Geographical insights
                • Competitive landscape

                Interested in this report?

                Get your sample now to see our research methodology and insights!

                Download Now

                Frequently Asked Questions

                Playout Automation market growth will increase by $ 4579.8 mn during 2025-2029 .

                The Playout Automation market is expected to grow at a CAGR of 24.2% during 2025-2029 .

                Playout Automation market is segmented by End-user( International broadcasters, National broadcasters) Genre( Sports, News, Entertainment, Cartoon and learning, Lifestyle and knowledge) Channel( Single channel, Multiple channel, Others, South America, Middle East and Africa)

                305broadcast, Amagi Corp., Aveco sro, Avid Technology Inc., Avmeda LLC, Axel Technology srl, Belden Inc., BroadStream Solutions Inc., Cinegy LLC, Dalet SA, Evertz Technologies Ltd., HARDATA, Harmonic Inc., iHeartMedia Inc., Imagine Communications Corp., NVerzion Inc., Pebble Beach Systems Group plc, SI Media srl, Sony Group Corp., wTVision are a few of the key vendors in the Playout Automation market.

                North America will register the highest growth rate of 40% among the other regions. Therefore, the Playout Automation market in North America is expected to garner significant business opportunities for the vendors during the forecast period.

                US, Russia, China, UK, Germany, Canada, Mexico, Brazil, Japan, India

                • Rising need for multilingual playoutThe rising demand for multilingual playouts is expected to drive the global playout automation market. Growth in the penetration of cable and satellite television services in rural and urban areas provides a wide audience base for broadcasters. Playout automation enables broadcasters to facilitate linguistic diversity. Diverse viewing preferences increase the demand for channel diversification is the driving factor this market.
                • which consequentially results in the growth of the global playout automation market. The demand for multilingual playouts has gained significant demand due to the wide audience base and growing penetration of satellite and cable TV in rural areas is the driving factor this market.
                • particularly in Asian countries. Most TV service providers offer multilingual playouts for various channels with the use of CiaB is the driving factor this market.
                • which further automates the playout process based on input files. CiaB also assists in inserting multilingual regional-specific commercials during playout. Thus is the driving factor this market.
                • the use of CiaB and the growing need for multilingual playouts are likely to support the revenue inflow of the global playout automation market during the forecast period. is the driving factor this market.

                The Playout Automation market vendors should focus on grabbing business opportunities from the International broadcasters segment as it accounted for the largest market share in the base year.