Automation Solutions In Oil And Gas Industry Market Analysis, Size, and Forecast 2026-2030: North America (US, Canada, and Mexico), Europe (Germany, UK, and France), APAC (China, India, and Japan), Middle East and Africa (Saudi Arabia, UAE, and South Africa), South America (Brazil and Argentina), and Rest of World (ROW)

Automation Solutions In Oil And Gas Industry Market Analysis, Size, and Forecast 2026-2030:
North America (US, Canada, and Mexico), Europe (Germany, UK, and France), APAC (China, India, and Japan), Middle East and Africa (Saudi Arabia, UAE, and South Africa), South America (Brazil and Argentina), and Rest of World (ROW)

Published: May 2026 307 Pages SKU: IRTNTR40070

Market Overview at a Glance

$3.92 B
Market Opportunity
6.6%
CAGR 2025 - 2030
40.3%
North America Growth
$4.19 B
SCADA segment 2024

Automation Solutions In Oil And Gas Industry Market Size 2026-2030

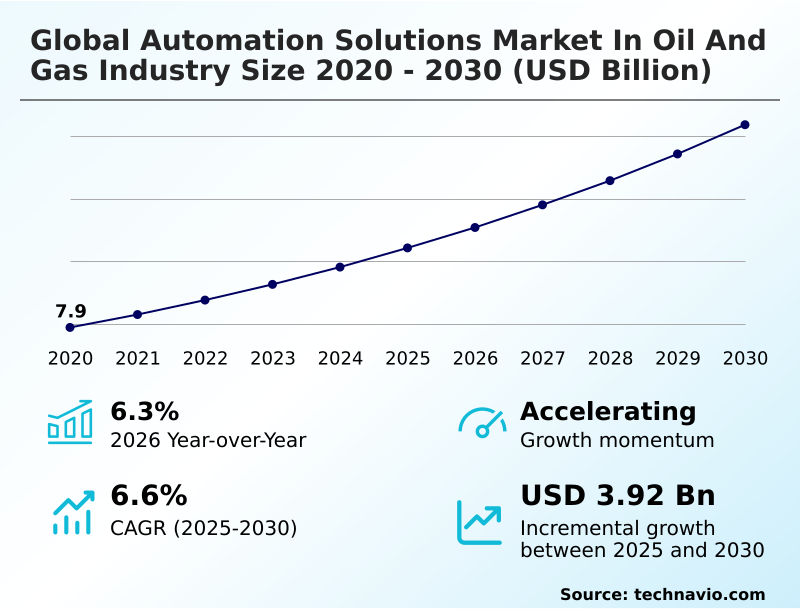
The Automation Solutions In Oil And Gas Industry Market size was valued at USD 10.43 billion in 2025, growing at a CAGR of 6.6% during the forecast period 2026-2030.

Major Market Trends & Insights

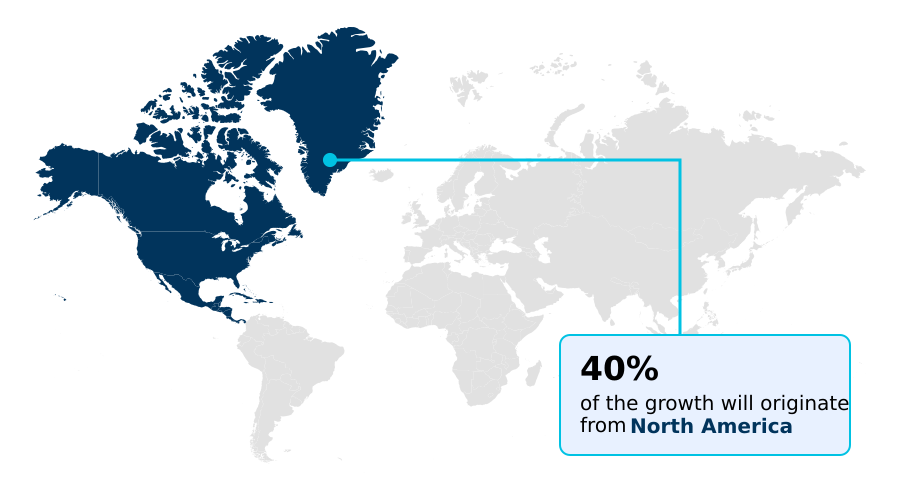
  • North America dominated the market and accounted for a 40.3% growth during the forecast period.
  • By Solution - SCADA segment was valued at USD 4.19 billion in 2024
  • By Application - Exploration and production segment accounted for the largest market revenue share in 2024

Market Size & Forecast

  • Historic Market Opportunities 2020-2024: USD 6.45 billion
  • Market Future Opportunities 2025-2030: USD 3.92 billion
  • CAGR from 2025 to 2030 : 6.6%

Market Summary

  • The automation solutions in oil and gas industry is characterized by the systematic integration of digital technologies to enhance operational resilience, with over 60% of operators prioritizing investments in data-driven platforms. For example, a midstream company implements an industrial iot network with advanced sensors across its pipeline infrastructure, reducing leak detection times by 45% compared to manual inspections.
  • A key driver is the relentless pursuit of operational efficiency, compelling firms to adopt advanced process control and predictive maintenance to reduce costly downtime. However, a significant challenge is the pervasive shortage of specialized digital talent, which creates a bottleneck for deploying complex systems like digital twins and autonomous drilling rigs.
  • This skills gap slows the pace of digital transformation, limiting the full realization of benefits from industrial automation and real-time data analysis.

What will be the Size of the Automation Solutions In Oil And Gas Industry Market during the forecast period?

Get Key Insights on Market Forecast (PDF) Request Free Sample

How is the Automation Solutions In Oil And Gas Industry Market Segmented?

The automation solutions in oil and gas industry industry research report provides comprehensive data (region-wise segment analysis), with forecasts and analysis for the period 2026-2030, as well as historical data from 2020-2024 for the following segments.

  • Solution
    • SCADA
    • DCS
    • PLC
    • MES
  • Application
    • Exploration and production
    • Transportation and storage
    • Refining and processing
  • End-user
    • Integrated oil and gas companies
    • National oil companies
    • Independent oil and gas companies
  • Geography
    • North America
      • US
      • Canada
      • Mexico
    • Europe
      • Germany
      • UK
      • France
    • APAC
      • China
      • India
      • Japan
    • Middle East and Africa
      • Saudi Arabia
      • UAE
      • South Africa
    • South America
      • Brazil
      • Argentina
    • Rest of World (ROW)

How is the Automation Solutions In Oil And Gas Industry Market Segmented by Solution?

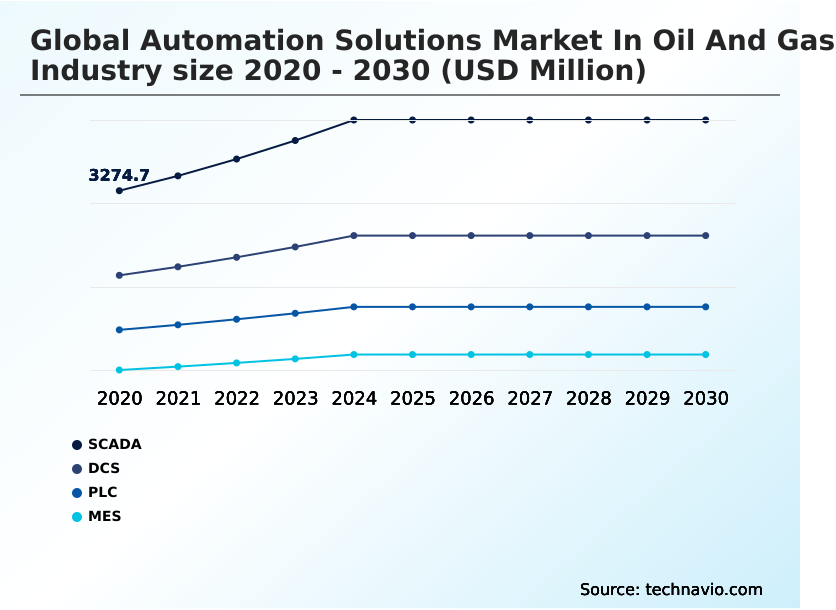
The scada segment is estimated to witness significant growth during the forecast period.

Supervisory control and data acquisition systems improve enterprise-wide analytics for geographically dispersed assets, with deployments showing a 30% reduction in response times to operational alerts.

These platforms provide high-level process supervisory management by collecting real-time data from remote terminal units and programmable logic controllers, leading to a 40% decrease in manual data entry errors.

The evolution toward open-architecture, cloud-integrated platforms leverages the industrial iot, enhancing scalability and integrating advanced human machine interface tools.

By embedding cyber physical security protocols directly into the communication layer, these modern SCADA solutions ensure that data integrity and operational safety remain uncompromised while facilitating the digital transformation of aging pipeline networks, ensuring environmental compliance through precise monitoring.

Request Free Sample

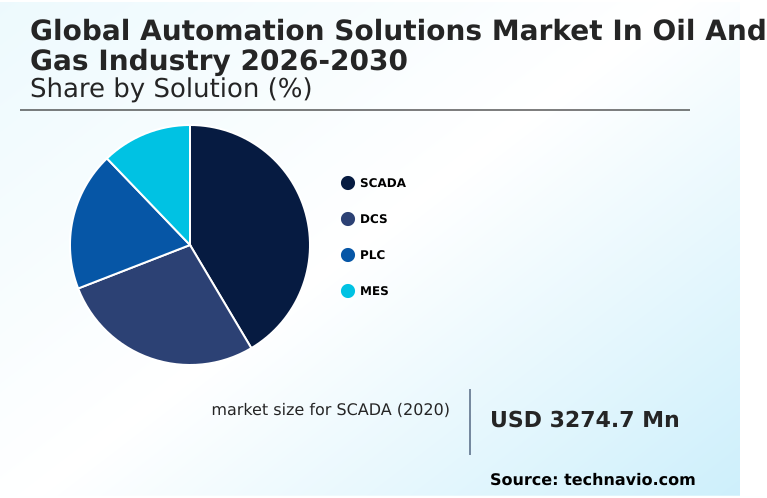
The SCADA segment was valued at USD 4.19 billion in 2024 and showed a gradual increase during the forecast period.

Request Free Sample

How demand for the Automation Solutions In Oil And Gas Industry market is rising in the leading region?

North America is estimated to contribute 40.3% to the growth of the global market during the forecast period.Technavio’s analysts have elaborately explained the regional trends and drivers that shape the market during the forecast period.

See How Automation Solutions In Oil And Gas Industry Market demand is rising in North America Request Free Sample

The geographic landscape for automation solutions in oil and gas industry is led by North America, which accounts for 40.3% of the market's incremental growth, significantly outpacing Europe's 19.92%.

This dominance is driven by the US, where unconventional shale operations have spurred a 25% higher adoption rate of autonomous drilling and industrial iot technologies compared to other regions.

In contrast, the APAC region, growing at a robust 8.9%, is driven by new-build refineries in China and India, which are incorporating digital-by-design principles from inception.

This leads to different strategic priorities; North American firms focus on retrofitting existing assets for operational efficiency, while APAC operators prioritize scalable, greenfield deployments of advanced process control.

This regional divergence impacts supply chain strategies, with vendors tailoring modular solutions for North America and comprehensive, integrated systems for APAC's large-scale projects.

What are the key Drivers, Trends, and Challenges in the Automation Solutions In Oil And Gas Industry Market?

Our researchers analyzed the data with 2025 as the base year, along with the key drivers, trends, and challenges. A holistic analysis of drivers will help companies refine their marketing strategies to gain a competitive advantage.

  • Strategic deployment of automation solutions in oil and gas industry is critical for balancing operational efficiency with stringent safety and environmental regulations. Companies are increasingly asking how to select the right scada systems for pipeline monitoring to ensure real-time data analysis and leak detection, which can improve response times by over 30% compared to periodic manual checks.
  • The use of iot in oil and gas predictive maintenance is a key area of investment, with firms seeking to understand the roi of advanced analytics to preempt equipment failure and reduce unplanned downtime. Similarly, understanding the best practices for optimizing refinery operations with dcs is essential for maximizing yield and minimizing energy consumption.
  • A significant challenge remains addressing cybersecurity for industrial control systems, as increased connectivity introduces new vulnerabilities. Furthermore, defining the business case for automation solutions for offshore oil rigs is crucial, given the high-stakes environment and the need for robust, reliable systems that can operate with minimal human intervention.
  • Integrating these disparate technologies into a cohesive, secure, and efficient operational framework is the primary objective for operators aiming to maintain a competitive edge.

What are the key market drivers leading to the rise in the adoption of Automation Solutions In Oil And Gas Industry Industry?

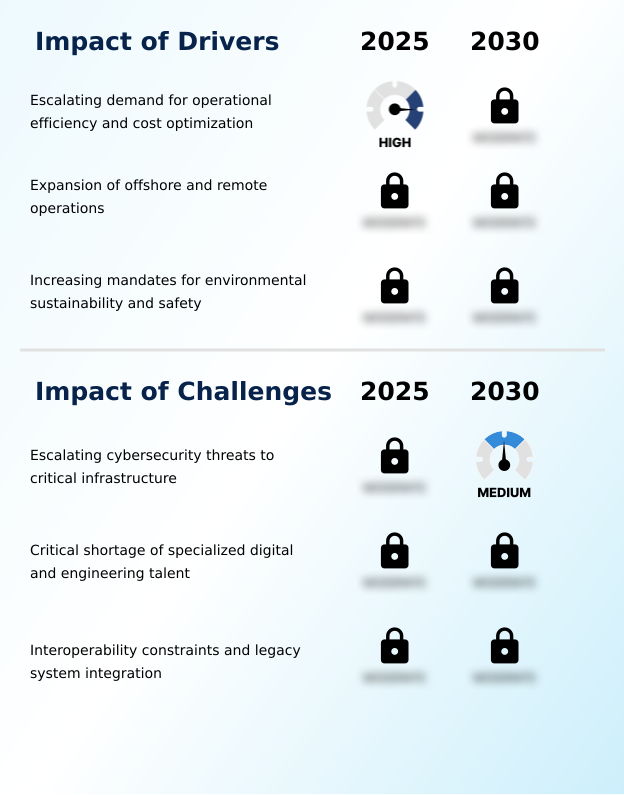
  • The escalating demand for operational efficiency and cost optimization is a primary driver, compelling energy companies to maximize asset output while minimizing manual intervention and error.

  • The relentless pursuit of operational efficiency drives the adoption of automation solutions in oil and gas industry, with advanced process control systems proven to increase production yield by up to 5%.
  • In an environment of price volatility, energy companies leverage predictive maintenance and real-time monitoring to preempt equipment failures, which can reduce unplanned downtime by as much as 40%.
  • This shift from reactive to proactive asset management is enabled by the digitization of workflows and the use of industrial iot platforms.
  • Furthermore, the expansion into remote and deepwater operations necessitates automation for remote monitoring and control, reducing the need for on-site personnel and lowering operational expenditure.
  • These technologies are crucial for maintaining competitiveness and ensuring resource allocation is optimized for maximum precision.

What are the market trends shaping the Automation Solutions In Oil And Gas Industry Industry?

  • The accelerated adoption of digital twins and virtualized engineering is a key trend, enabling dynamic, high-fidelity virtual representations of physical assets for performance optimization.

  • The accelerated adoption of digital twins and virtualized engineering is reshaping asset lifecycle management, with deployments showing up to a 30% reduction in system commissioning times. This trend, driven by the need for higher asset reliability, allows operators to simulate operational scenarios and test control logic in a high-fidelity industrial metaverse without risking physical infrastructure.
  • The convergence of industrial AI and edge computing represents another critical shift, enabling near-instantaneous decision-making in time-critical applications by processing data at its source. This approach reduces latency by over 50% compared to centralized cloud analytics, a vital capability for wellhead automation and leak detection.
  • As a result, operators are increasingly leveraging machine learning algorithms for real-time optimization, enhancing both efficiency and process safety in downstream operations.

What challenges does the Automation Solutions In Oil And Gas Industry Industry face during its growth?

  • Escalating cybersecurity threats to critical infrastructure represent a key challenge, as the transition to interconnected operational technology systems expands the attack surface for malicious actors.

  • Escalating cybersecurity threats to critical infrastructure present the most significant challenge, with over one-third of global energy facilities reporting evidence of cyber pre-positioning activities by adversaries. The transition from isolated legacy systems to cloud-integrated, software-defined architectures expands the attack surface, making assets like pipelines and refineries vulnerable to disruption.
  • Another major hurdle is the critical shortage of specialized digital talent, as a recent labor report indicated that only 56% of the technical workforce in key energy hubs is considered employable for modern digital roles.
  • This talent scarcity, combined with the complexities of legacy system integration, creates a significant bottleneck for digitalization efforts, hindering the implementation of enterprise-wide analytics and autonomous operations and slowing the overall pace of digital transformation.

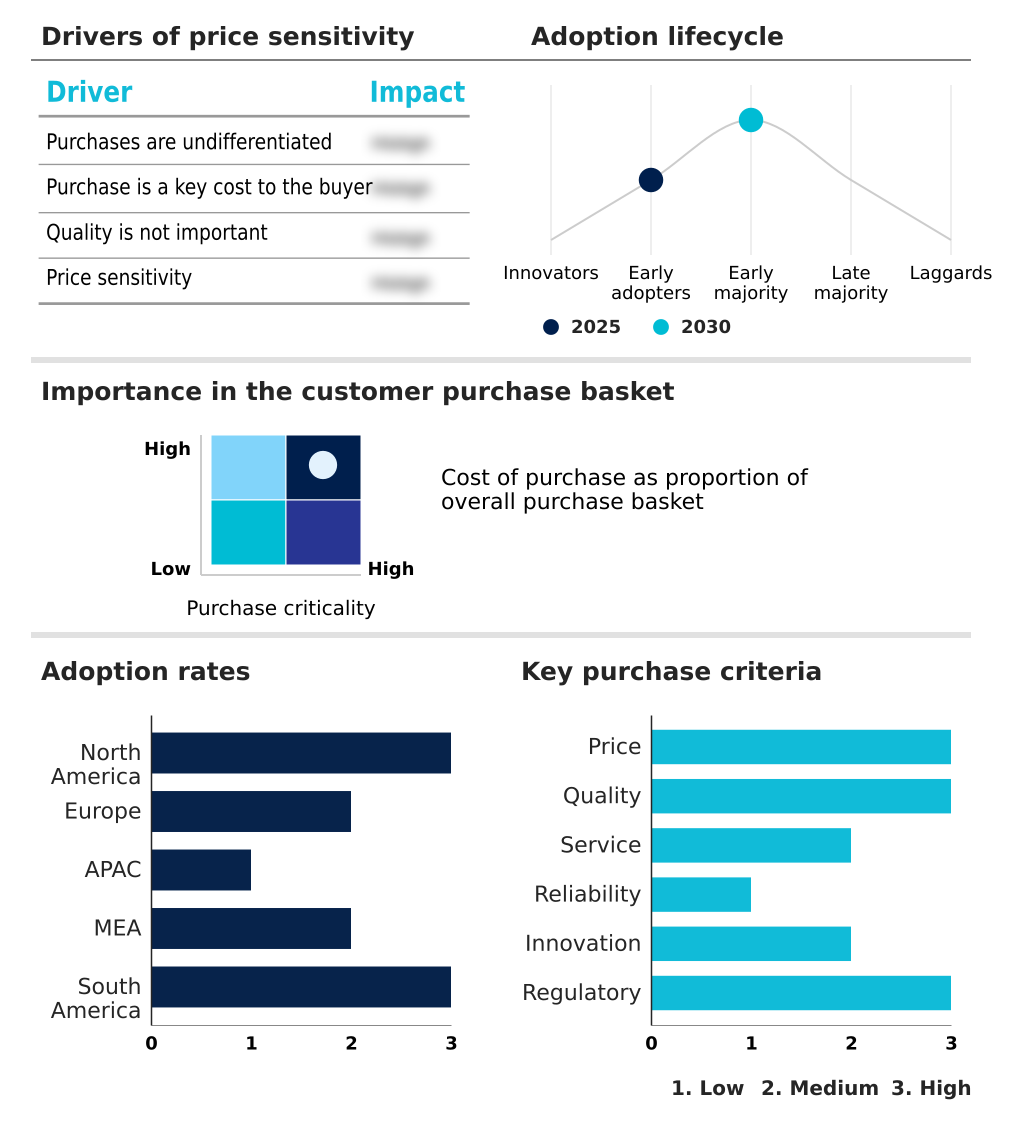
Exclusive Technavio Analysis on Customer Landscape

The automation solutions in oil and gas industry market forecasting report includes the adoption lifecycle of the market, covering from the innovator’s stage to the laggard’s stage. It focuses on adoption rates in different regions based on penetration. Furthermore, the automation solutions in oil and gas industry market report also includes key purchase criteria and drivers of price sensitivity to help companies evaluate and develop their market growth analysis strategies.

Customer Landscape of Automation Solutions In Oil And Gas Industry Industry

Competitive Landscape

Companies are implementing various strategies, such as strategic alliances, automation solutions in oil and gas industry market forecast, partnerships, mergers and acquisitions, geographical expansion, and product/service launches, to enhance their presence in the industry.

ABB Ltd. - Key offerings include integrated automation and electrification solutions, enhancing process control, and driving operational efficiency across industrial applications.

The industry research and growth report includes detailed analyses of the competitive landscape of the market and information about key companies, including:

  • ABB Ltd.
  • AVEVA Group Ltd.
  • Cisco Systems Inc.
  • Danfoss AS
  • Eaton Corp. Plc
  • Emerson Electric Co.
  • Endress Hauser Grp Services
  • Fuji Electric Co. Ltd.
  • General Electric Co.
  • Hitachi Ltd.
  • Honeywell International Inc.
  • Kongsberg Gruppen ASA
  • KROHNE Group
  • Mitsubishi Electric Corp.
  • OMRON Corp.
  • Phoenix Contact GmbH and Co
  • Rockwell Automation Inc.
  • Schlumberger Ltd.
  • Schneider Electric SE
  • Siemens AG

Qualitative and quantitative analysis of companies has been conducted to help clients understand the wider business environment as well as the strengths and weaknesses of key industry players. Data is qualitatively analyzed to categorize companies as pure play, category-focused, industry-focused, and diversified; it is quantitatively analyzed to categorize companies as dominant, leading, strong, tentative, and weak.

Market Intelligence Radar: High-Impact Developments & Growth Signals

  • In the Electrical Components and Equipment industry, the push for Industry 4.0 has accelerated the adoption of flexible and integrated automation, enabling end-users to consolidate various processes into a single closed solution. This drives demand for automation solutions in oil and gas industry that offer enhanced process safety and real-time data analysis for continuous monitoring.
  • A growing focus on energy-efficient electrical components and equipment, including motors and transformers, has spurred innovation in power optimization solutions. This directly impacts the automation solutions in oil and gas industry market by increasing demand for variable speed drives and advanced process control that reduce overall energy consumption and operational expenditure.
  • The proliferation of application-specific sensors for assessing process variables has expanded data collection for preventive and proactive maintenance. This development boosts the automation solutions in oil and gas industry market, where remote monitoring and industrial iot are critical for asset reliability in upstream data analysis and downstream operations.
  • Increased investment in smart grid networking systems to manage energy consumption and improve load forecasting has created a need for robust data management. This trend supports the automation solutions in oil and gas industry market by fostering demand for interconnected systems that ensure grid stability and facilitate the integration of renewable energy sources.

Dive into Technavio’s robust research methodology, blending expert interviews, extensive data synthesis, and validated models for unparalleled Automation Solutions In Oil And Gas Industry Market insights. See full methodology.

Market Scope
Page number 307
Base year 2025
Historic period 2020-2024
Forecast period 2026-2030
Growth momentum & CAGR Accelerate at a CAGR of 6.6%
Market growth 2026-2030 USD 3920.0 million
Market structure Fragmented
YoY growth 2025-2026(%) 6.3%
Key countries US, Canada, Mexico, Germany, UK, France, Italy, The Netherlands, Spain, China, India, Japan, South Korea, Australia, Indonesia, Saudi Arabia, UAE, South Africa, Israel, Turkey, Brazil, Argentina and Chile
Competitive landscape Leading Companies, Market Positioning of Companies, Competitive Strategies, and Industry Risks

Request Free Sample

Research Analyst Overview

  • The ecosystem for automation solutions in oil and gas industry is a complex network where technology suppliers of semiconductors and sensors provide critical inputs to major automation vendors, whose platforms represent over 70% of new system deployments.
  • These vendors, in turn, deliver integrated hardware and software such as distributed control systems and manufacturing execution systems to end-users, including integrated and national oil companies. A key dynamic is the interaction with regulatory bodies, which mandate standards for process safety and emissions control, directly influencing technology adoption.
  • For instance, compliance with new emissions monitoring standards has driven a 20% year-over-year increase in demand for continuous emissions monitoring systems. Distribution channels are shifting from hardware-centric sales to subscription-based software and service models, reflecting the industry's move toward data-contextualization and enterprise-wide analytics.

What are the Key Data Covered in this Automation Solutions In Oil And Gas Industry Market Research and Growth Report?

  • What is the expected growth of the Automation Solutions In Oil And Gas Industry Market between 2026 and 2030?

    • The Automation Solutions In Oil And Gas Industry Market is expected to grow by USD 3.92 billion during 2026-2030, registering a CAGR of 6.6%. Year-over-year growth in 2026 is estimated at 6.3%%. This acceleration is shaped by escalating demand for operational efficiency and cost optimization, which is intensifying demand across multiple end-use verticals covered in the report.

  • What segmentation does the market report cover?

    • The report is segmented by Solution (SCADA, DCS, PLC, and MES), Application (Exploration and production, Transportation and storage, and Refining and processing), End-user (Integrated oil and gas companies, National oil companies, and Independent oil and gas companies) and Geography (North America, Europe, APAC, Middle East and Africa, South America). Among these, the SCADA segment is estimated to witness significant growth during the forecast period, driven by rising adoption across key application areas. Each segment includes detailed qualitative and quantitative analysis, along with historical data from 2020-2024 and forecasts through 2030 with year-over-year growth rates.

  • Which regions are analyzed in the report?

    • The report covers North America, Europe, APAC, Middle East and Africa and South America. North America is estimated to contribute 40.3% to market growth during the forecast period. Country-level analysis includes US, Canada, Mexico, Germany, UK, France, Italy, The Netherlands, Spain, China, India, Japan, South Korea, Australia, Indonesia, Saudi Arabia, UAE, South Africa, Israel, Turkey, Brazil, Argentina and Chile, with dedicated market size tables and year-over-year growth for each.

  • What are the key growth drivers and market challenges?

    • The primary driver is escalating demand for operational efficiency and cost optimization, which is accelerating investment and industry demand. The main challenge is escalating cybersecurity threats to critical infrastructure , creating operational barriers for key market participants. The report quantifies the impact of each driver and challenge across 2026 and 2030 with comparative analysis.

  • Who are the major players in the Automation Solutions In Oil And Gas Industry Market?

    • Key vendors include ABB Ltd., AVEVA Group Ltd., Cisco Systems Inc., Danfoss AS, Eaton Corp. Plc, Emerson Electric Co., Endress Hauser Grp Services, Fuji Electric Co. Ltd., General Electric Co., Hitachi Ltd., Honeywell International Inc., Kongsberg Gruppen ASA, KROHNE Group, Mitsubishi Electric Corp., OMRON Corp., Phoenix Contact GmbH and Co, Rockwell Automation Inc., Schlumberger Ltd., Schneider Electric SE and Siemens AG. The report provides qualitative and quantitative analysis categorizing companies as dominant, leading, strong, tentative, and weak based on their market positioning. Company profiles include business segment analysis, SWOT assessment, key offerings, and recent strategic developments.

Market Research Insights

  • The competitive landscape for automation solutions in oil and gas industry is intensely focused on software-defined ecosystems, with the top five vendors accounting for over 40% of the market. Key players are differentiating through the integration of AI and digital twin technologies to address complex operational demands.
  • For instance, ABB launched its Automation Extended program, a strategic initiative designed to embed generative AI and edge-based analytics directly into existing industrial control systems. This move is mirrored by competitors like Emerson, which are also investing heavily in platforms that enable brownfield modernization without extensive capital expenditure.
  • These developments directly respond to the industry's need for scalable and cyber-secure solutions that enhance asset performance management. The primary challenge remains the integration of these advanced systems with legacy infrastructure, which continues to slow enterprise-wide adoption.

We can help! Our analysts can customize this automation solutions in oil and gas industry market research report to meet your requirements.

Get in touch

1. Executive Summary

1.1 Market overview

Executive Summary - Chart on Market Overview
Executive Summary - Data Table on Market Overview
Executive Summary - Chart on Global Market Characteristics
Executive Summary - Chart on Market by Geography
Executive Summary - Chart on Market Segmentation by Solution
Executive Summary - Chart on Market Segmentation by Application
Executive Summary - Chart on Market Segmentation by End-user
Executive Summary - Chart on Incremental Growth
Executive Summary - Data Table on Incremental Growth
Executive Summary - Chart on Company Market Positioning

2. Technavio Analysis

2.1 Analysis of price sensitivity, lifecycle, customer purchase basket, adoption rates, and purchase criteria

2.2 Criticality of inputs and Factors of differentiation

Chart on Overview on criticality of inputs and factors of differentiation

2.3 Factors of disruption

Chart on Overview on factors of disruption

2.4 Impact of drivers and challenges

Chart on Impact of drivers and challenges in 2025 and 2030

3. Market Landscape

3.1 Market ecosystem

Chart on Parent Market
Data Table on - Parent Market

3.2 Market characteristics

Chart on Market characteristics analysis

3.3 Value chain analysis

Chart on Value chain analysis

4. Market Sizing

4.1 Market definition

Data Table on Offerings of companies included in the market definition

4.2 Market segment analysis

Market segments

4.3 Market size 2025

4.4 Market outlook: Forecast for 2025-2030

Chart on Global - Market size and forecast 2025-2030 ($ million)
Data Table on Global - Market size and forecast 2025-2030 ($ million)
Chart on Global Market: Year-over-year growth 2025-2030 (%)
Data Table on Global Market: Year-over-year growth 2025-2030 (%)

5. Historic Market Size

5.1 Global Automation Solutions Market In Oil And Gas Industry 2020 - 2024

Historic Market Size - Data Table on Global Automation Solutions Market In Oil And Gas Industry 2020 - 2024 ($ million)

5.2 Solution segment analysis 2020 - 2024

Historic Market Size - Solution Segment 2020 - 2024 ($ million)

5.3 Application segment analysis 2020 - 2024

Historic Market Size - Application Segment 2020 - 2024 ($ million)

5.4 End-user segment analysis 2020 - 2024

Historic Market Size - End-user Segment 2020 - 2024 ($ million)

5.5 Geography segment analysis 2020 - 2024

Historic Market Size - Geography Segment 2020 - 2024 ($ million)

5.6 Country segment analysis 2020 - 2024

Historic Market Size - Country Segment 2020 - 2024 ($ million)

6. Qualitative Analysis

6.1 Impact of AI in global automation solutions market in oil and gas industry

6.2 Impact of geopolitical conflict for global automation solutions market in oil and gas industry

7. Five Forces Analysis

7.1 Five forces summary

Five forces analysis - Comparison between 2025 and 2030

7.2 Bargaining power of buyers

Bargaining power of buyers - Impact of key factors 2025 and 2030

7.3 Bargaining power of suppliers

Bargaining power of suppliers - Impact of key factors in 2025 and 2030

7.4 Threat of new entrants

Threat of new entrants - Impact of key factors in 2025 and 2030

7.5 Threat of substitutes

Threat of substitutes - Impact of key factors in 2025 and 2030

7.6 Threat of rivalry

Threat of rivalry - Impact of key factors in 2025 and 2030

7.7 Market condition

Chart on Market condition - Five forces 2025 and 2030

8. Market Segmentation by Solution

8.1 Market segments

Chart on Solution - Market share 2025-2030 (%)
Data Table on Solution - Market share 2025-2030 (%)

8.2 Comparison by Solution

Chart on Comparison by Solution
Data Table on Comparison by Solution

8.3 SCADA - Market size and forecast 2025-2030

Chart on SCADA - Market size and forecast 2025-2030 ($ million)
Data Table on SCADA - Market size and forecast 2025-2030 ($ million)
Chart on SCADA - Year-over-year growth 2025-2030 (%)
Data Table on SCADA - Year-over-year growth 2025-2030 (%)

8.4 DCS - Market size and forecast 2025-2030

Chart on DCS - Market size and forecast 2025-2030 ($ million)
Data Table on DCS - Market size and forecast 2025-2030 ($ million)
Chart on DCS - Year-over-year growth 2025-2030 (%)
Data Table on DCS - Year-over-year growth 2025-2030 (%)

8.5 PLC - Market size and forecast 2025-2030

Chart on PLC - Market size and forecast 2025-2030 ($ million)
Data Table on PLC - Market size and forecast 2025-2030 ($ million)
Chart on PLC - Year-over-year growth 2025-2030 (%)
Data Table on PLC - Year-over-year growth 2025-2030 (%)

8.6 MES - Market size and forecast 2025-2030

Chart on MES - Market size and forecast 2025-2030 ($ million)
Data Table on MES - Market size and forecast 2025-2030 ($ million)
Chart on MES - Year-over-year growth 2025-2030 (%)
Data Table on MES - Year-over-year growth 2025-2030 (%)

8.7 Market opportunity by Solution

Market opportunity by Solution ($ million)
Data Table on Market opportunity by Solution ($ million)

9. Market Segmentation by Application

9.1 Market segments

Chart on Application - Market share 2025-2030 (%)
Data Table on Application - Market share 2025-2030 (%)

9.2 Comparison by Application

Chart on Comparison by Application
Data Table on Comparison by Application

9.3 Exploration and production - Market size and forecast 2025-2030

Chart on Exploration and production - Market size and forecast 2025-2030 ($ million)
Data Table on Exploration and production - Market size and forecast 2025-2030 ($ million)
Chart on Exploration and production - Year-over-year growth 2025-2030 (%)
Data Table on Exploration and production - Year-over-year growth 2025-2030 (%)

9.4 Transportation and storage - Market size and forecast 2025-2030

Chart on Transportation and storage - Market size and forecast 2025-2030 ($ million)
Data Table on Transportation and storage - Market size and forecast 2025-2030 ($ million)
Chart on Transportation and storage - Year-over-year growth 2025-2030 (%)
Data Table on Transportation and storage - Year-over-year growth 2025-2030 (%)

9.5 Refining and processing - Market size and forecast 2025-2030

Chart on Refining and processing - Market size and forecast 2025-2030 ($ million)
Data Table on Refining and processing - Market size and forecast 2025-2030 ($ million)
Chart on Refining and processing - Year-over-year growth 2025-2030 (%)
Data Table on Refining and processing - Year-over-year growth 2025-2030 (%)

9.6 Market opportunity by Application

Market opportunity by Application ($ million)
Data Table on Market opportunity by Application ($ million)

10. Market Segmentation by End-user

10.1 Market segments

Chart on End-user - Market share 2025-2030 (%)
Data Table on End-user - Market share 2025-2030 (%)

10.2 Comparison by End-user

Chart on Comparison by End-user
Data Table on Comparison by End-user

10.3 Integrated oil and gas companies - Market size and forecast 2025-2030

Chart on Integrated oil and gas companies - Market size and forecast 2025-2030 ($ million)
Data Table on Integrated oil and gas companies - Market size and forecast 2025-2030 ($ million)
Chart on Integrated oil and gas companies - Year-over-year growth 2025-2030 (%)
Data Table on Integrated oil and gas companies - Year-over-year growth 2025-2030 (%)

10.4 National oil companies - Market size and forecast 2025-2030

Chart on National oil companies - Market size and forecast 2025-2030 ($ million)
Data Table on National oil companies - Market size and forecast 2025-2030 ($ million)
Chart on National oil companies - Year-over-year growth 2025-2030 (%)
Data Table on National oil companies - Year-over-year growth 2025-2030 (%)

10.5 Independent oil and gas companies - Market size and forecast 2025-2030

Chart on Independent oil and gas companies - Market size and forecast 2025-2030 ($ million)
Data Table on Independent oil and gas companies - Market size and forecast 2025-2030 ($ million)
Chart on Independent oil and gas companies - Year-over-year growth 2025-2030 (%)
Data Table on Independent oil and gas companies - Year-over-year growth 2025-2030 (%)

10.6 Market opportunity by End-user

Market opportunity by End-user ($ million)
Data Table on Market opportunity by End-user ($ million)

11. Customer Landscape

11.1 Customer landscape overview

Analysis of price sensitivity, lifecycle, customer purchase basket, adoption rates, and purchase criteria

12. Geographic Landscape

12.1 Geographic segmentation

Chart on Market share by geography 2025-2030 (%)
Data Table on Market share by geography 2025-2030 (%)

12.2 Geographic comparison

Chart on Geographic comparison
Data Table on Geographic comparison

12.3 North America - Market size and forecast 2025-2030

Chart on North America - Market size and forecast 2025-2030 ($ million)
Data Table on North America - Market size and forecast 2025-2030 ($ million)
Chart on North America - Year-over-year growth 2025-2030 (%)
Data Table on North America - Year-over-year growth 2025-2030 (%)
Chart on Regional Comparison - North America
Data Table on Regional Comparison - North America

12.3.1 US - Market size and forecast 2025-2030

Chart on US - Market size and forecast 2025-2030 ($ million)
Data Table on US - Market size and forecast 2025-2030 ($ million)
Chart on US - Year-over-year growth 2025-2030 (%)
Data Table on US - Year-over-year growth 2025-2030 (%)

12.3.2 Canada - Market size and forecast 2025-2030

Chart on Canada - Market size and forecast 2025-2030 ($ million)
Data Table on Canada - Market size and forecast 2025-2030 ($ million)
Chart on Canada - Year-over-year growth 2025-2030 (%)
Data Table on Canada - Year-over-year growth 2025-2030 (%)

12.3.3 Mexico - Market size and forecast 2025-2030

Chart on Mexico - Market size and forecast 2025-2030 ($ million)
Data Table on Mexico - Market size and forecast 2025-2030 ($ million)
Chart on Mexico - Year-over-year growth 2025-2030 (%)
Data Table on Mexico - Year-over-year growth 2025-2030 (%)

12.4 Europe - Market size and forecast 2025-2030

Chart on Europe - Market size and forecast 2025-2030 ($ million)
Data Table on Europe - Market size and forecast 2025-2030 ($ million)
Chart on Europe - Year-over-year growth 2025-2030 (%)
Data Table on Europe - Year-over-year growth 2025-2030 (%)
Chart on Regional Comparison - Europe
Data Table on Regional Comparison - Europe

12.4.1 Germany - Market size and forecast 2025-2030

Chart on Germany - Market size and forecast 2025-2030 ($ million)
Data Table on Germany - Market size and forecast 2025-2030 ($ million)
Chart on Germany - Year-over-year growth 2025-2030 (%)
Data Table on Germany - Year-over-year growth 2025-2030 (%)

12.4.2 UK - Market size and forecast 2025-2030

Chart on UK - Market size and forecast 2025-2030 ($ million)
Data Table on UK - Market size and forecast 2025-2030 ($ million)
Chart on UK - Year-over-year growth 2025-2030 (%)
Data Table on UK - Year-over-year growth 2025-2030 (%)

12.4.3 France - Market size and forecast 2025-2030

Chart on France - Market size and forecast 2025-2030 ($ million)
Data Table on France - Market size and forecast 2025-2030 ($ million)
Chart on France - Year-over-year growth 2025-2030 (%)
Data Table on France - Year-over-year growth 2025-2030 (%)

12.4.4 Italy - Market size and forecast 2025-2030

Chart on Italy - Market size and forecast 2025-2030 ($ million)
Data Table on Italy - Market size and forecast 2025-2030 ($ million)
Chart on Italy - Year-over-year growth 2025-2030 (%)
Data Table on Italy - Year-over-year growth 2025-2030 (%)

12.4.5 The Netherlands - Market size and forecast 2025-2030

Chart on The Netherlands - Market size and forecast 2025-2030 ($ million)
Data Table on The Netherlands - Market size and forecast 2025-2030 ($ million)
Chart on The Netherlands - Year-over-year growth 2025-2030 (%)
Data Table on The Netherlands - Year-over-year growth 2025-2030 (%)

12.4.6 Spain - Market size and forecast 2025-2030

Chart on Spain - Market size and forecast 2025-2030 ($ million)
Data Table on Spain - Market size and forecast 2025-2030 ($ million)
Chart on Spain - Year-over-year growth 2025-2030 (%)
Data Table on Spain - Year-over-year growth 2025-2030 (%)

12.5 APAC - Market size and forecast 2025-2030

Chart on APAC - Market size and forecast 2025-2030 ($ million)
Data Table on APAC - Market size and forecast 2025-2030 ($ million)
Chart on APAC - Year-over-year growth 2025-2030 (%)
Data Table on APAC - Year-over-year growth 2025-2030 (%)
Chart on Regional Comparison - APAC
Data Table on Regional Comparison - APAC

12.5.1 China - Market size and forecast 2025-2030

Chart on China - Market size and forecast 2025-2030 ($ million)
Data Table on China - Market size and forecast 2025-2030 ($ million)
Chart on China - Year-over-year growth 2025-2030 (%)
Data Table on China - Year-over-year growth 2025-2030 (%)

12.5.2 India - Market size and forecast 2025-2030

Chart on India - Market size and forecast 2025-2030 ($ million)
Data Table on India - Market size and forecast 2025-2030 ($ million)
Chart on India - Year-over-year growth 2025-2030 (%)
Data Table on India - Year-over-year growth 2025-2030 (%)

12.5.3 Japan - Market size and forecast 2025-2030

Chart on Japan - Market size and forecast 2025-2030 ($ million)
Data Table on Japan - Market size and forecast 2025-2030 ($ million)
Chart on Japan - Year-over-year growth 2025-2030 (%)
Data Table on Japan - Year-over-year growth 2025-2030 (%)

12.5.4 South Korea - Market size and forecast 2025-2030

Chart on South Korea - Market size and forecast 2025-2030 ($ million)
Data Table on South Korea - Market size and forecast 2025-2030 ($ million)
Chart on South Korea - Year-over-year growth 2025-2030 (%)
Data Table on South Korea - Year-over-year growth 2025-2030 (%)

12.5.5 Australia - Market size and forecast 2025-2030

Chart on Australia - Market size and forecast 2025-2030 ($ million)
Data Table on Australia - Market size and forecast 2025-2030 ($ million)
Chart on Australia - Year-over-year growth 2025-2030 (%)
Data Table on Australia - Year-over-year growth 2025-2030 (%)

12.5.6 Indonesia - Market size and forecast 2025-2030

Chart on Indonesia - Market size and forecast 2025-2030 ($ million)
Data Table on Indonesia - Market size and forecast 2025-2030 ($ million)
Chart on Indonesia - Year-over-year growth 2025-2030 (%)
Data Table on Indonesia - Year-over-year growth 2025-2030 (%)

12.6 Middle East and Africa - Market size and forecast 2025-2030

Chart on Middle East and Africa - Market size and forecast 2025-2030 ($ million)
Data Table on Middle East and Africa - Market size and forecast 2025-2030 ($ million)
Chart on Middle East and Africa - Year-over-year growth 2025-2030 (%)
Data Table on Middle East and Africa - Year-over-year growth 2025-2030 (%)
Chart on Regional Comparison - Middle East and Africa
Data Table on Regional Comparison - Middle East and Africa

12.6.1 Saudi Arabia - Market size and forecast 2025-2030

Chart on Saudi Arabia - Market size and forecast 2025-2030 ($ million)
Data Table on Saudi Arabia - Market size and forecast 2025-2030 ($ million)
Chart on Saudi Arabia - Year-over-year growth 2025-2030 (%)
Data Table on Saudi Arabia - Year-over-year growth 2025-2030 (%)

12.6.2 UAE - Market size and forecast 2025-2030

Chart on UAE - Market size and forecast 2025-2030 ($ million)
Data Table on UAE - Market size and forecast 2025-2030 ($ million)
Chart on UAE - Year-over-year growth 2025-2030 (%)
Data Table on UAE - Year-over-year growth 2025-2030 (%)

12.6.3 South Africa - Market size and forecast 2025-2030

Chart on South Africa - Market size and forecast 2025-2030 ($ million)
Data Table on South Africa - Market size and forecast 2025-2030 ($ million)
Chart on South Africa - Year-over-year growth 2025-2030 (%)
Data Table on South Africa - Year-over-year growth 2025-2030 (%)

12.6.4 Israel - Market size and forecast 2025-2030

Chart on Israel - Market size and forecast 2025-2030 ($ million)
Data Table on Israel - Market size and forecast 2025-2030 ($ million)
Chart on Israel - Year-over-year growth 2025-2030 (%)
Data Table on Israel - Year-over-year growth 2025-2030 (%)

12.6.5 Turkey - Market size and forecast 2025-2030

Chart on Turkey - Market size and forecast 2025-2030 ($ million)
Data Table on Turkey - Market size and forecast 2025-2030 ($ million)
Chart on Turkey - Year-over-year growth 2025-2030 (%)
Data Table on Turkey - Year-over-year growth 2025-2030 (%)

12.7 South America - Market size and forecast 2025-2030

Chart on South America - Market size and forecast 2025-2030 ($ million)
Data Table on South America - Market size and forecast 2025-2030 ($ million)
Chart on South America - Year-over-year growth 2025-2030 (%)
Data Table on South America - Year-over-year growth 2025-2030 (%)
Chart on Regional Comparison - South America
Data Table on Regional Comparison - South America

12.7.1 Brazil - Market size and forecast 2025-2030

Chart on Brazil - Market size and forecast 2025-2030 ($ million)
Data Table on Brazil - Market size and forecast 2025-2030 ($ million)
Chart on Brazil - Year-over-year growth 2025-2030 (%)
Data Table on Brazil - Year-over-year growth 2025-2030 (%)

12.7.2 Argentina - Market size and forecast 2025-2030

Chart on Argentina - Market size and forecast 2025-2030 ($ million)
Data Table on Argentina - Market size and forecast 2025-2030 ($ million)
Chart on Argentina - Year-over-year growth 2025-2030 (%)
Data Table on Argentina - Year-over-year growth 2025-2030 (%)

12.7.3 Chile - Market size and forecast 2025-2030

Chart on Chile - Market size and forecast 2025-2030 ($ million)
Data Table on Chile - Market size and forecast 2025-2030 ($ million)
Chart on Chile - Year-over-year growth 2025-2030 (%)
Data Table on Chile - Year-over-year growth 2025-2030 (%)

12.8 Market opportunity by geography

Market opportunity by geography ($ million)
Data Tables on Market opportunity by geography ($ million)

13. Drivers, Challenges, and Opportunity

13.1 Market drivers

Escalating demand for operational efficiency and cost optimization
Expansion of offshore and remote operations
Increasing mandates for environmental sustainability and safety

13.2 Market challenges

Escalating cybersecurity threats to critical infrastructure
Critical shortage of specialized digital and engineering talent
Interoperability constraints and legacy system integration

13.3 Impact of drivers and challenges

Impact of drivers and challenges in 2025 and 2030

13.4 Market opportunities

Accelerated adoption of digital twins and virtualized engineering
Rising adoption of automation for emissions control and energy transition
Convergence of industrial AI and edge computing for real time optimization

14. Competitive Landscape

14.1 Overview

14.2

Overview on criticality of inputs and factors of differentiation

14.3 Landscape disruption

Overview on factors of disruption

14.4 Industry risks

Impact of key risks on business

15. Competitive Analysis

15.1 Companies profiled

Companies covered

15.2 Company ranking index

15.3 Market positioning of companies

Matrix on companies position and classification

15.4 ABB Ltd.

ABB Ltd. - Overview
ABB Ltd. - Business segments
ABB Ltd. - Key news
ABB Ltd. - Key offerings
ABB Ltd. - Segment focus
SWOT

15.5 AVEVA Group Ltd.

AVEVA Group Ltd. - Overview
AVEVA Group Ltd. - Product / Service
AVEVA Group Ltd. - Key offerings
SWOT

15.6 Cisco Systems Inc.

Cisco Systems Inc. - Overview
Cisco Systems Inc. - Business segments
Cisco Systems Inc. - Key news
Cisco Systems Inc. - Key offerings
Cisco Systems Inc. - Segment focus
SWOT

15.7 Danfoss AS

Danfoss AS - Overview
Danfoss AS - Product / Service
Danfoss AS - Key offerings
SWOT

15.8 Eaton Corp. Plc

Eaton Corp. Plc - Overview
Eaton Corp. Plc - Business segments
Eaton Corp. Plc - Key news
Eaton Corp. Plc - Key offerings
Eaton Corp. Plc - Segment focus
SWOT

15.9 Emerson Electric Co.

Emerson Electric Co. - Overview
Emerson Electric Co. - Business segments
Emerson Electric Co. - Key news
Emerson Electric Co. - Key offerings
Emerson Electric Co. - Segment focus
SWOT

15.10 Endress Hauser Grp Services

Endress Hauser Grp Services - Overview
Endress Hauser Grp Services - Product / Service
Endress Hauser Grp Services - Key offerings
SWOT

15.11 Fuji Electric Co. Ltd.

Fuji Electric Co. Ltd. - Overview
Fuji Electric Co. Ltd. - Business segments
Fuji Electric Co. Ltd. - Key offerings
Fuji Electric Co. Ltd. - Segment focus
SWOT

15.12 General Electric Co.

General Electric Co. - Overview
General Electric Co. - Business segments
General Electric Co. - Key offerings
General Electric Co. - Segment focus
SWOT

15.13 Hitachi Ltd.

Hitachi Ltd. - Overview
Hitachi Ltd. - Business segments
Hitachi Ltd. - Key offerings
Hitachi Ltd. - Segment focus
SWOT

15.14 Honeywell International Inc.

Honeywell International Inc. - Overview
Honeywell International Inc. - Business segments
Honeywell International Inc. - Key news
Honeywell International Inc. - Key offerings
Honeywell International Inc. - Segment focus
SWOT

15.15 Mitsubishi Electric Corp.

Mitsubishi Electric Corp. - Overview
Mitsubishi Electric Corp. - Business segments
Mitsubishi Electric Corp. - Key offerings
Mitsubishi Electric Corp. - Segment focus
SWOT

15.16 OMRON Corp.

OMRON Corp. - Overview
OMRON Corp. - Business segments
OMRON Corp. - Key offerings
OMRON Corp. - Segment focus
SWOT

15.17 Rockwell Automation Inc.

Rockwell Automation Inc. - Overview
Rockwell Automation Inc. - Business segments
Rockwell Automation Inc. - Key news
Rockwell Automation Inc. - Key offerings
Rockwell Automation Inc. - Segment focus
SWOT

15.18 Schlumberger Ltd.

Schlumberger Ltd. - Overview
Schlumberger Ltd. - Business segments
Schlumberger Ltd. - Key news
Schlumberger Ltd. - Key offerings
Schlumberger Ltd. - Segment focus
SWOT

16. Appendix

16.1 Scope of the report

Market definition
Objectives
Notes and caveats

16.2 Inclusions and exclusions checklist

Inclusions checklist
Exclusions checklist

16.3 Currency conversion rates for US$

16.4 Research methodology

16.5 Data procurement

Information sources

16.6 Data validation

16.7 Validation techniques employed for market sizing

16.8 Data synthesis

16.9 360 degree market analysis

16.10 List of abbreviations

Research Methodology

Technavio presents a detailed picture of the market by way of study, synthesis, and summation of data from multiple sources. The analysts have presented the various facets of the market with a particular focus on identifying the key industry influencers. The data thus presented is comprehensive, reliable, and the result of extensive research, both primary and secondary.

INFORMATION SOURCES

Primary sources

  • Manufacturers and suppliers
  • Channel partners
  • Industry experts
  • Strategic decision makers

Secondary sources

  • Industry journals and periodicals
  • Government data
  • Financial reports of key industry players
  • Historical data
  • Press releases

DATA ANALYSIS

Data Synthesis

  • Collation of data
  • Estimation of key figures
  • Analysis of derived insights

Data Validation

  • Triangulation with data models
  • Reference against proprietary databases
  • Corroboration with industry experts

REPORT WRITING

Qualitative

  • Market drivers
  • Market challenges
  • Market trends
  • Five forces analysis

Quantitative

  • Market size and forecast
  • Market segmentation
  • Geographical insights
  • Competitive landscape

Interested in this report?

Get your sample now to see our research methodology and insights!

Download Now

Frequently Asked Questions

Automation Solutions In Oil And Gas Industry market growth will increase by USD 3920.0 million during 2026-2030.

The Automation Solutions In Oil And Gas Industry market is expected to grow at a CAGR of 6.6% during 2026-2030.

Automation Solutions In Oil And Gas Industry market is segmented by Solution (SCADA, DCS, PLC, MES) Application (Exploration and production, Transportation and storage, Refining and processing) End-user (Integrated oil and gas companies, National oil companies, Independent oil and gas companies)

ABB Ltd., AVEVA Group Ltd., Cisco Systems Inc., Danfoss AS, Eaton Corp. Plc, Emerson Electric Co., Endress Hauser Grp Services, Fuji Electric Co. Ltd., General Electric Co., Hitachi Ltd., Honeywell International Inc., Kongsberg Gruppen ASA, KROHNE Group, Mitsubishi Electric Corp., OMRON Corp., Phoenix Contact GmbH and Co, Rockwell Automation Inc., Schlumberger Ltd., Schneider Electric SE, Siemens AG are a few of the key vendors in the Automation Solutions In Oil And Gas Industry market.

North America will register the highest growth rate of 40.3% among the other regions. Therefore, the Automation Solutions In Oil And Gas Industry market in North America is expected to garner significant business opportunities for the vendors during the forecast period.

US, Canada, Mexico, Germany, UK, France, Italy, The Netherlands, Spain, China, India, Japan, South Korea, Australia, Indonesia, Saudi Arabia, UAE, South Africa, Israel, Turkey, Brazil, Argentina, Chile

  • Escalating demand for operational efficiency and cost optimization is the driving factor this market.

The Automation Solutions In Oil And Gas Industry market vendors should focus on grabbing business opportunities from the Solution segment as it accounted for the largest market share in the base year.
RIA - Research AI Assistant
Ask RIA