POS Terminals In Retail Sector Market Size 2026-2030
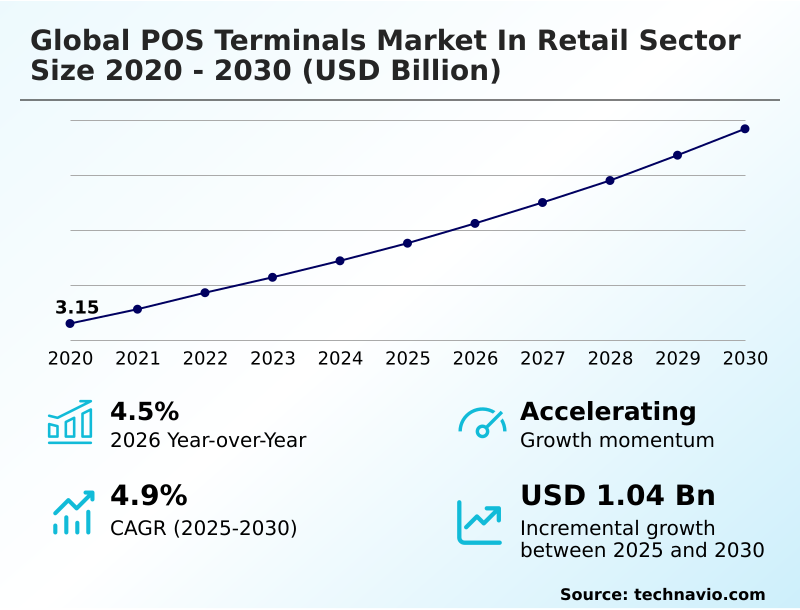
The pos terminals in retail sector market size is valued to increase by USD 1.04 billion, at a CAGR of 4.9% from 2025 to 2030. Rising adoption of digital and cashless payment methods will drive the pos terminals in retail sector market.
Major Market Trends & Insights
- APAC dominated the market and accounted for a 48.4% growth during the forecast period.
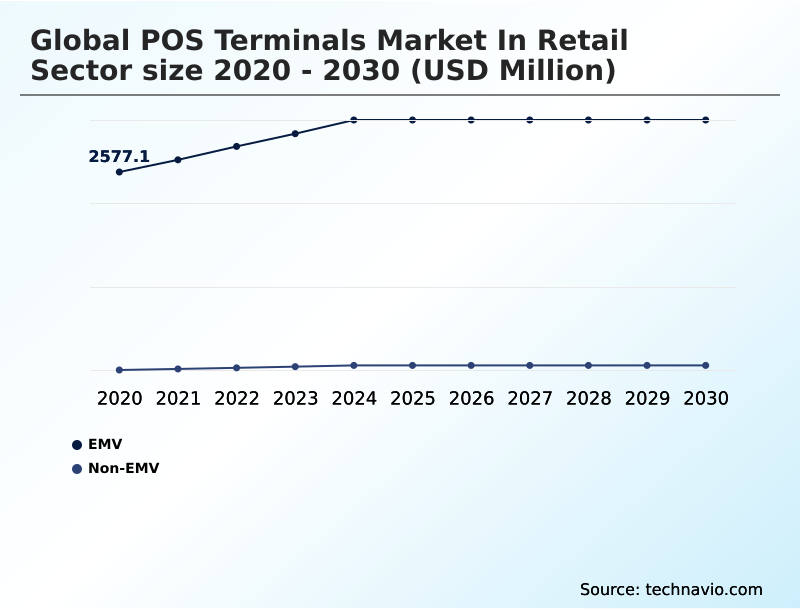
- By Technology - EMV segment was valued at USD 3.10 billion in 2024
- By Product - Contact segment accounted for the largest market revenue share in 2024
Market Size & Forecast
- Market Opportunities: USD 1.77 billion
- Market Future Opportunities: USD 1.04 billion
- CAGR from 2025 to 2030 : 4.9%
Market Summary
- The POS terminals market in retail sector is undergoing a significant transformation, moving beyond simple transaction processing to become central hubs for business intelligence and customer engagement. This evolution is driven by the widespread consumer shift toward digital and contactless payments, compelling retailers to adopt more sophisticated systems.
- A key driver is the need for seamless omnichannel retail operations, where inventory, sales, and customer data are synchronized across physical stores and e-commerce platforms. For instance, a fashion retailer can use integrated POS data to automatically update online stock levels after an in-store purchase, preventing overselling and improving customer satisfaction. However, this increased connectivity introduces challenges, primarily around data security.
- Ensuring that all transaction data is protected through robust measures like end-to-end encryption is critical for maintaining consumer trust and complying with global regulations. The trend is toward flexible, cloud-based solutions that offer scalability, real-time analytics, and the ability to integrate with other business management tools, ultimately enhancing operational efficiency.
What will be the Size of the POS Terminals In Retail Sector Market during the forecast period?
Get Key Insights on Market Forecast (PDF) Get Free Sample
How is the POS Terminals In Retail Sector Market Segmented?
The pos terminals in retail sector industry research report provides comprehensive data (region-wise segment analysis), with forecasts and estimates in "USD million" for the period 2026-2030, as well as historical data from 2020-2024 for the following segments.
- Technology
- EMV
- Non-EMV
- Product
- Contact
- Contactless
- End-user
- Supermarket
- Specialty store
- Hypermarket
- Gas stations
- Others
- Geography
- APAC
- China
- Japan
- India
- North America
- US
- Canada
- Mexico
- Europe
- Germany
- UK
- France
- South America
- Brazil
- Argentina
- Colombia
- Middle East and Africa
- Saudi Arabia
- UAE
- South Africa
- Rest of World (ROW)
- APAC
By Technology Insights
The emv segment is estimated to witness significant growth during the forecast period.
The market is fundamentally segmented by the adoption of secure payment technologies, with EMV chip technology serving as the global standard.
This segment's dominance is driven by its ability to significantly reduce counterfeit fraud by over 75% compared to legacy magnetic stripe systems.
Modern terminals integrating this technology now commonly support contactless payment acceptance via near field communication, catering to consumer demand for speed.
Further segmentation is seen in form factors, including mobile point of sale devices for floor staff and self-service pos kiosks for faster checkouts.
Advanced systems often include biometric authentication and support for qr code payment systems, while also integrating with enterprise resource planning and customer relationship management platforms to provide a holistic view of operations, all while adhering to payment card industry standards.
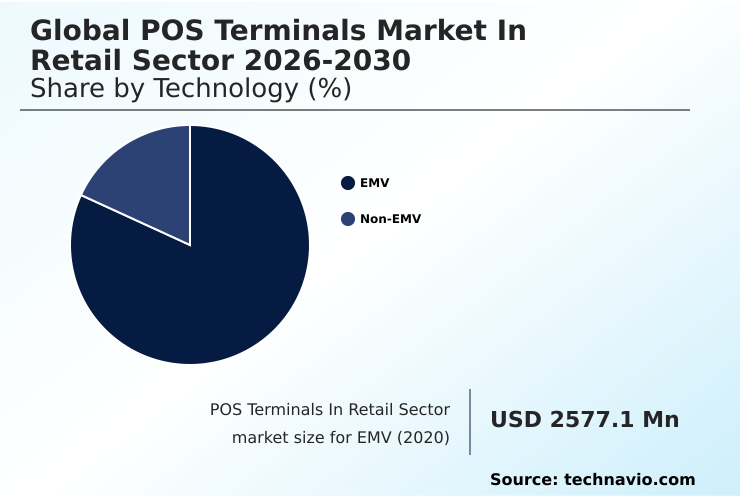
The EMV segment was valued at USD 3.10 billion in 2024 and showed a gradual increase during the forecast period.
Regional Analysis
APAC is estimated to contribute 48.4% to the growth of the global market during the forecast period.Technavio’s analysts have elaborately explained the regional trends and drivers that shape the market during the forecast period.
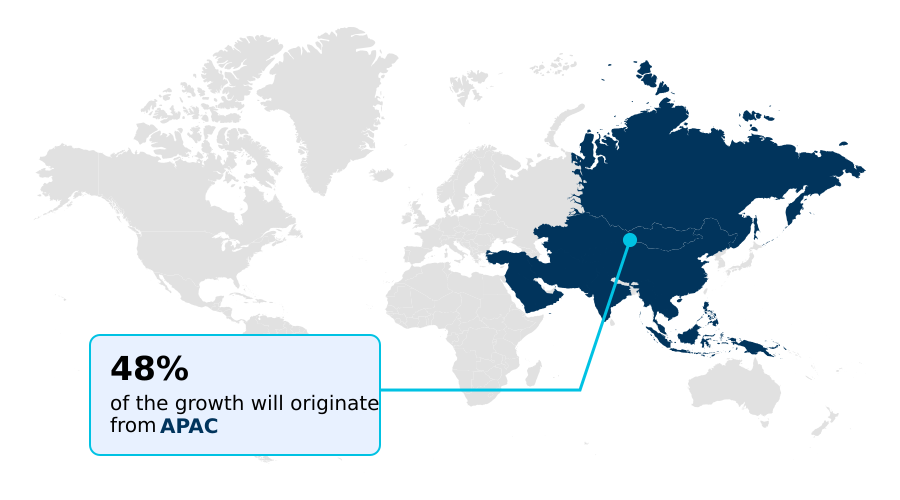
See How POS Terminals In Retail Sector Market Demand is Rising in APAC Get Free Sample
The geographic landscape is marked by distinct regional dynamics. In APAC, rapid digitization and government initiatives are driving widespread adoption of android-based pos devices and smart pos terminals, with some markets seeing over a 50% increase in digital transactions year-over-year.
In contrast, North America and Europe are mature markets focused on upgrading systems to support advanced features like ai-driven personalization and loyalty program integration. These upgrades often shorten the pos hardware lifecycle from 7 years to 5 years.
Across regions, there's a growing emphasis on cross-border payment acceptance to support tourism and e-commerce. The integration of digital receipting systems and a secure card reader is becoming a global standard, improving both customer experience and environmental sustainability.
Market Dynamics
Our researchers analyzed the data with 2025 as the base year, along with the key drivers, trends, and challenges. A holistic analysis of drivers will help companies refine their marketing strategies to gain a competitive advantage.
- Retailers evaluating their technology stack often weigh cloud pos vs on-premise cost, with cloud models offering lower initial outlays and greater scalability. A key strategic decision involves integrating pos with e-commerce platforms, which is central to resolving omnichannel pos system implementation challenges and creating a unified customer view.
- To stay competitive, businesses constantly explore how to improve pos transaction speed, as a reduction of even a few seconds can increase customer throughput by over 10% during peak hours compared to legacy systems. This is particularly crucial for pos terminals for high-volume supermarkets.
- For smaller enterprises, finding the best pos systems for small retail that are both affordable and feature-rich is a priority, while for specialized environments, selecting pos terminals for gas stations requires adherence to specific safety and integration standards. Security remains a major focus across the board.
- Adhering to emv compliance for retail businesses and following pos data security best practices are non-negotiable. This includes understanding android pos terminal security features and the benefits of biometric payment authentication in retail. The impact of softpos on retail hardware is also a growing consideration, offering a software-based alternative.
- When choosing a retail pos hardware provider, factors like support for retail automation with pos terminals and ease of retail pos system integration with erp are critical.
- Addressing the challenges of legacy pos system upgrades is often the first step toward building a modern, efficient retail ecosystem and realizing the full benefits of self-service checkout kiosks and a unified commerce pos platform that reduces checkout friction with contactless payments.
What are the key market drivers leading to the rise in the adoption of POS Terminals In Retail Sector Industry?
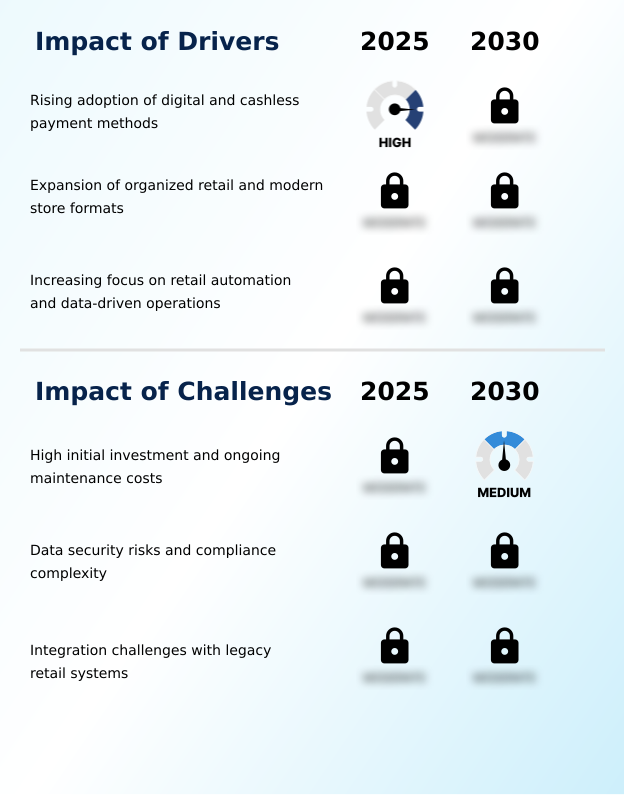
- The rising adoption of digital and cashless payment methods is a key driver propelling market growth.
- Market growth is largely driven by the expansion of organized retail and the increasing need for operational automation.
- Retailers are investing in systems that feature deep hardware and software integration to improve transaction processing speed, reducing average customer checkout times by over 25%.
- The demand for real-time inventory synchronization between warehouses and stores is critical, with modern systems preventing stockouts and improving sales forecasting. Key functionalities like payment gateway integration and end-to-end encryption are now standard.
- These advanced terminals facilitate centralized data management and enable dynamic pricing strategies, allowing businesses to respond to market changes instantly.
- The use of automated reporting tools and integrated billing systems has been shown to reduce administrative errors by more than 40%, further fueling adoption.
What are the market trends shaping the POS Terminals In Retail Sector Industry?
- The increasing adoption of cloud-based POS terminals is an important market trend. This shift is fueled by the need for centralized data management and greater scalability.
- A primary trend shaping the market is the rapid shift toward cloud-based pos solutions, which offer centralized control and enable seamless omnichannel retail operations. These systems are essential for creating a unified commerce platform, with implementations showing a 30% improvement in inventory accuracy across online and physical stores.
- The adoption of all-in-one pos systems and multi-functional payment terminals is growing, as they provide a streamlined hardware footprint. Furthermore, the emergence of the softpos solution, which turns commercial devices into payment terminals, reduces hardware dependency by up to 50% for smaller merchants.
- All modern systems, including specialized outdoor payment terminals, are built with security at their core, incorporating secure boot protocols and adhering to the pci pts poi certification and data security standard.
What challenges does the POS Terminals In Retail Sector Industry face during its growth?
- High initial investment and ongoing maintenance costs pose a significant challenge to the industry's growth.
- Significant market challenges stem from data security risks and the complexity of integration. Adherence to stringent payment security standards requires continuous investment, with compliance costs representing up to 15% of a retailer's IT security budget. The need for secure integrated payment processing is paramount, pushing vendors to offer advanced payment tokenization services.
- However, integrating modern retail automation systems with legacy platforms can be difficult, extending hardware refresh cycles and delaying the benefits of data-driven sales insights. Ensuring robust real-time transaction monitoring to combat fraud is a constant pressure.
- Furthermore, as demand for digital wallet acceptance and unattended retail solutions grows, achieving seamless supply chain logistics integration without compromising security remains a primary operational hurdle for many businesses.
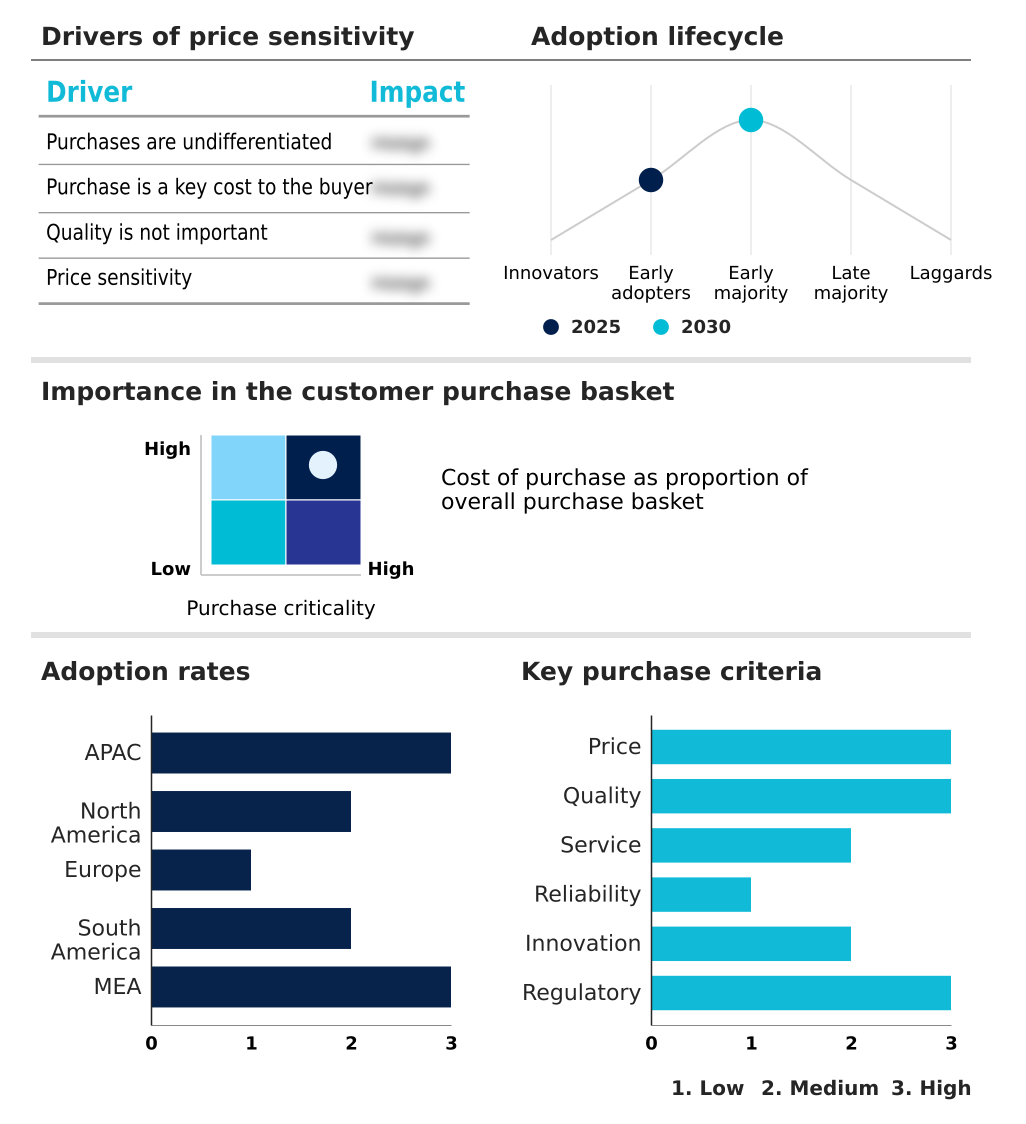
Exclusive Technavio Analysis on Customer Landscape
The pos terminals in retail sector market forecasting report includes the adoption lifecycle of the market, covering from the innovator’s stage to the laggard’s stage. It focuses on adoption rates in different regions based on penetration. Furthermore, the pos terminals in retail sector market report also includes key purchase criteria and drivers of price sensitivity to help companies evaluate and develop their market growth analysis strategies.
Customer Landscape of POS Terminals In Retail Sector Industry
Competitive Landscape
Companies are implementing various strategies, such as strategic alliances, pos terminals in retail sector market forecast, partnerships, mergers and acquisitions, geographical expansion, and product/service launches, to enhance their presence in the industry.
BBPOS International Ltd. - Delivers secure, customized payment solutions, specializing in advanced mobile and smart point-of-sale systems designed for modern retail environments.
The industry research and growth report includes detailed analyses of the competitive landscape of the market and information about key companies, including:
- BBPOS International Ltd.
- Block Inc.
- Diebold Nixdorf Incorp.
- Fiserv Inc.
- Fujitsu Ltd.
- HP Inc.
- Lightspeed Commerce Inc.
- NCR Payment Solutions LLC
- NEC Corp.
- New POS Technology Ltd.
- Oracle Corp.
- PAX Global Technology Ltd.
- Posiflex Technology Inc.
- Qashier Pte Ltd.
- Samsung Electronics Co. Ltd.
- Toshiba Corp.
- Touch Dynamic
- VeriFone Inc.
- Worldline SA
Qualitative and quantitative analysis of companies has been conducted to help clients understand the wider business environment as well as the strengths and weaknesses of key industry players. Data is qualitatively analyzed to categorize companies as pure play, category-focused, industry-focused, and diversified; it is quantitatively analyzed to categorize companies as dominant, leading, strong, tentative, and weak.
Recent Development and News in Pos terminals in retail sector market
- In August 2024, Mastercard launched its global Payment Passkey Service in India, replacing passwords with biometric authentication to secure and accelerate online checkouts.
- In November 2024, Mastercard and Network International expanded their partnership to accelerate digital payment adoption across the UAE and the broader Middle East and Africa region using Mastercard Move solutions.
- In January 2025, Verifone introduced its Victa range of future-ready payment devices and the Verifone Tap softPOS solution to enhance commerce and payment experiences for businesses.
- In March 2025, Fiserv Inc. launched its Clover point-of-sale system in Australia, providing an all-in-one platform for small-to-medium businesses to manage payments and operations.
Dive into Technavio’s robust research methodology, blending expert interviews, extensive data synthesis, and validated models for unparalleled POS Terminals In Retail Sector Market insights. See full methodology.
| Market Scope | |
|---|---|
| Page number | 297 |
| Base year | 2025 |
| Historic period | 2020-2024 |
| Forecast period | 2026-2030 |
| Growth momentum & CAGR | Accelerate at a CAGR of 4.9% |
| Market growth 2026-2030 | USD 1039.4 million |
| Market structure | Fragmented |
| YoY growth 2025-2026(%) | 4.5% |
| Key countries | China, Japan, India, South Korea, Australia, Indonesia, US, Canada, Mexico, Germany, UK, France, Italy, Spain, The Netherlands, Brazil, Argentina, Colombia, Saudi Arabia, UAE, South Africa, Israel and Turkey |
| Competitive landscape | Leading Companies, Market Positioning of Companies, Competitive Strategies, and Industry Risks |
Research Analyst Overview
- The market is evolving from standalone hardware to deeply integrated ecosystems, defined by advanced hardware and software integration. Boardroom decisions now heavily rely on data-driven sales insights gathered from these systems to shape corporate strategy. The deployment of a unified commerce platform that supports omnichannel retail operations is no longer optional.
- This shift is underpinned by technologies like emv chip technology and contactless payment acceptance, which enhance both security and convenience. Modern retail automation systems, from mobile point of sale devices to self-service pos kiosks, are designed to increase transaction processing speed, with some retailers achieving a 20% reduction in customer wait times.
- Security is paramount, addressed through end-to-end encryption, payment tokenization services, and pci pts poi certification for android-based pos devices and smart pos terminals equipped with a secure card reader.
- The rise of the softpos solution and innovations like biometric authentication are further transforming the landscape, while loyalty program integration and integrated payment processing through sophisticated payment gateway integration drive customer retention and operational efficiency. Real-time inventory synchronization is a key benefit derived from these platforms.
What are the Key Data Covered in this POS Terminals In Retail Sector Market Research and Growth Report?
-
What is the expected growth of the POS Terminals In Retail Sector Market between 2026 and 2030?
-
USD 1.04 billion, at a CAGR of 4.9%
-
-
What segmentation does the market report cover?
-
The report is segmented by Technology (EMV, and Non-EMV), Product (Contact, and Contactless), End-user (Supermarket, Specialty store, Hypermarket, Gas stations, and Others) and Geography (APAC, North America, Europe, South America, Middle East and Africa)
-
-
Which regions are analyzed in the report?
-
APAC, North America, Europe, South America and Middle East and Africa
-
-
What are the key growth drivers and market challenges?
-
Rising adoption of digital and cashless payment methods, High initial investment and ongoing maintenance costs
-
-
Who are the major players in the POS Terminals In Retail Sector Market?
-
BBPOS International Ltd., Block Inc., Diebold Nixdorf Incorp., Fiserv Inc., Fujitsu Ltd., HP Inc., Lightspeed Commerce Inc., NCR Payment Solutions LLC, NEC Corp., New POS Technology Ltd., Oracle Corp., PAX Global Technology Ltd., Posiflex Technology Inc., Qashier Pte Ltd., Samsung Electronics Co. Ltd., Toshiba Corp., Touch Dynamic, VeriFone Inc. and Worldline SA
-
Market Research Insights
- The market's dynamism is driven by the integration of advanced software capabilities into hardware. The adoption of all-in-one pos systems that combine payment processing with customer relationship management and enterprise resource planning functionalities improves operational efficiency by over 30%. The rising demand for digital wallet acceptance and qr code payment systems is pushing retailers to upgrade their infrastructure.
- Centralized data management via the cloud allows for remote system monitoring and the use of automated reporting tools, which has been shown to reduce administrative overhead by 25%. Innovations in near field communication and ai-driven personalization are enhancing the customer experience, while adherence to the payment card industry data security standard remains a critical focus throughout the pos hardware lifecycle.
We can help! Our analysts can customize this pos terminals in retail sector market research report to meet your requirements.
 RIA -
RIA - 
